
An unlikely duo!

With the fallout of banks playing right before our eyes now, we see some opportunities in unique places. To set the stage, it’s no doubt that banks will be taking the brunt of the blow for now as this crisis continues to play out; whether or not it becomes a contagion event, we’ll see. The key upcoming event that will mark the next decisive direction markets are headed will be the next Federal Open Market Committee (FOMC) meeting.
One opportunity we see here is to go short on the bank/financials sector and long on more defensive sectors as we head into volatile times ahead. One way we can achieve this could be to look at a Financials “heavy” equity index, such as the S&P/TSX 60 Index*, and a “light” index, such as the MSCI Taiwan Index.
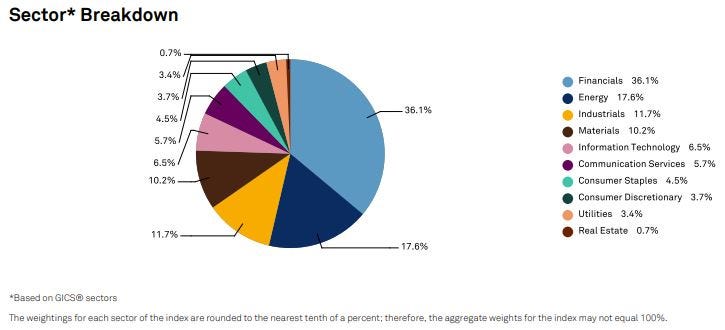
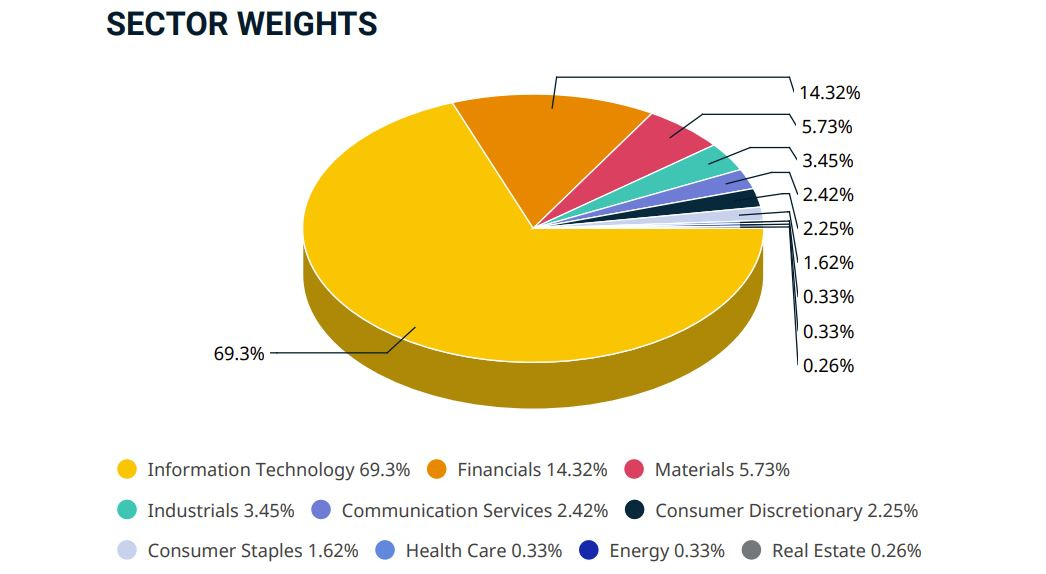
Digging deeper into the index components, the S&P/TSX 60 Index consists of 36% weightage in Financials, while the MSCI Taiwan Index consists of only 14% weightage in Financials, which are pretty low when compared to other major equity indices. On the other hand, Information Technology, at close to 70% of the MSCI Taiwan Index, is more than 10 times the weightage of S&P/TSX 60 Index. We want to highlight, however, that while 70% is weighted as Information Technology, the top 3 names alone (Taiwan Semiconductor Manufacturing Company Limited, Hon Hai Precision Industry Co., Ltd. and MediaTek Inc.) make up 50% of the MSCI Taiwan Index and are fundamentally manufacturing businesses, which we consider more defensive in nature.
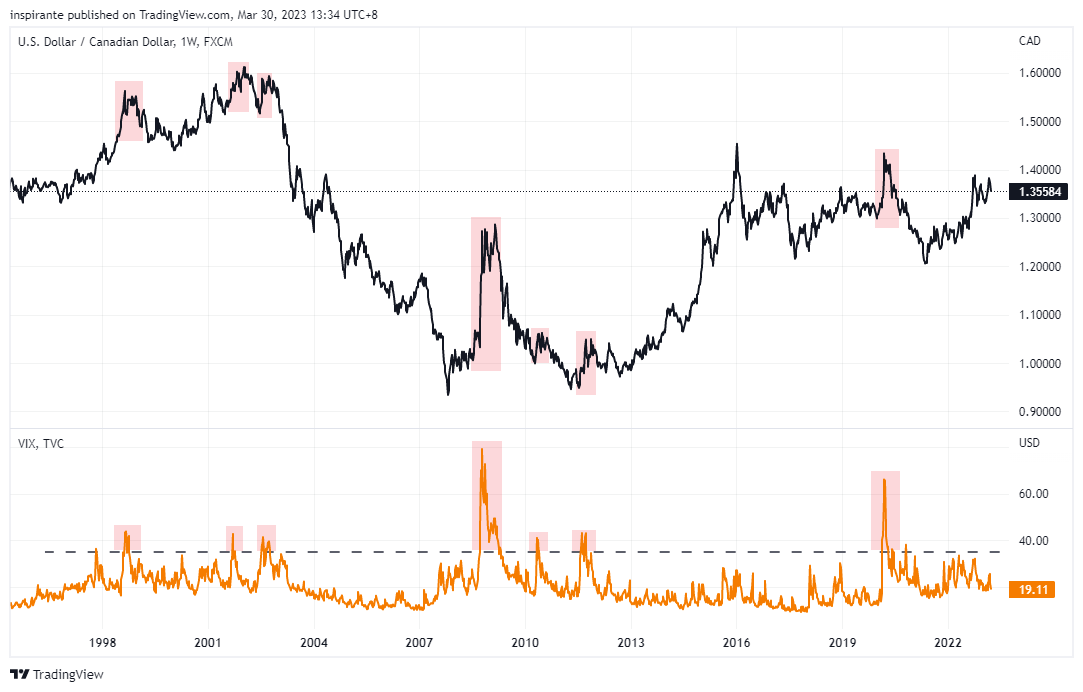
By pairing these two indices, you can essentially be short on Financials (short S&P/TSX 60 Index Futures (SXF™)) and long on the Tech/Manufacturing sector (long MSCI Taiwan (USD) Index Futures) in one trade. In addition to that, the S&P/TSX 60 Index is denominated in CAD while the MSCI Taiwan Index is denominated in USD. If we were to short the S&P/TSX 60 Index and long the MSCI Taiwan Index, it would give us the added benefit of being long on the US dollar exposure and short on the Canadian dollar (i.e. long USDCAD). This could prove to be useful in volatile periods, when the flight to safe haven currency takes effect. As seen from the chart below, every time volatility breaks out, the USDCAD rallies as investors move their exposure back to the dollar.
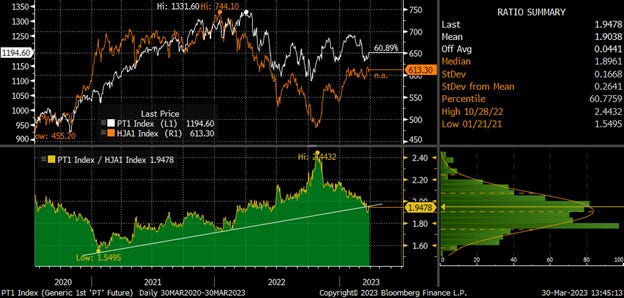
When we look at the ratio of the S&P/TSX 60 Index Standard Futures (SXF) against the MSCI Taiwan Index Futures, we can get a sense of the relative pricing of the two index futures. Trading in an upward trend since 2020, the ratio reached a high of 2.44 in late 2022 as the MSCI Taiwan Index was sold off. A recovery in the MSCI Taiwan Index now brings the ratio lower, testing the trend support. Given the bearish view on Financials, if the S&P/TSX 60 Index trades lower, this ratio would be compressed further. A break downwards below the current trend support could trigger more downside for the pair’s ratio.
To set up this trade, one way to pair the two index futures would be to hedge the notional exposure.
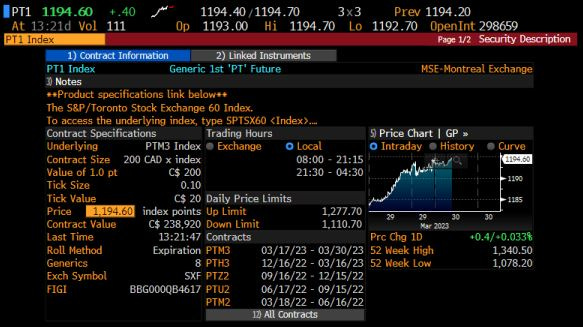
A short position on one SXF contract would result in a short on CAD 238,920 of notional exposure, assuming the current price of CAD 1,194.60.
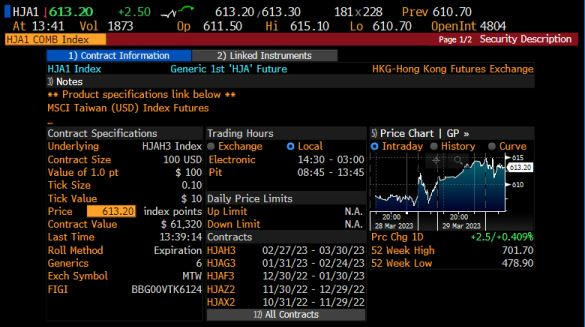
While a long position on one MSCI Taiwan Index Futures contract? would result in a long on USD 61,320 of notional exposure, assuming the current price of USD 613.2.
Converting the CAD 238,920 exposure to USD at the USDCAD rate of 1.356 would give us roughly USD 176,195. Therefore, to hedge the notional exposure, we would require roughly three MSCI Taiwan Index Futures, bringing the net notional exposure to:
1 S&P/TSX 60 Index Futures : 3 MSCI Taiwan Index Futures
USD 176,195 : 3 x USD 61,320 (USD 183,960)
The set-up of this trade would require careful management, as the two products are listed on different exchanges, and their “liquidity” profiles are concentrated during different time zones. Specifically, the bulk of liquidity for the S&P/TSX 60 Index is during Canadian hours, while, for MSCI Taiwan Index, it is during Asian hours.
In conclusion, the risk of further decline in Financials due to the fallout from the banking industry and uncertainty regarding the future interest rate path are key considerations now. Defensive sectors, such as manufacturing, may offer more stability in volatile times and a long dollar exposure may serve as a useful hedge. Overall, these factors make this trade one to watch closely.
Reference:
https://money.tmx.com/en/quote/%5ETX60/constituents
https://www.m-x.ca/en/markets/index-derivatives/sxf
Disclaimer:
The contents in this idea are intended for information purposes only and do not constitute investment recommendations or advice. Nor are they used to promote any specific products or services. They serve as an integral part of a case study to demonstrate fundamental concepts in risk management under given market scenarios. A full version of the disclaimer is available in our profile description.
Copyright © Bourse de Montréal Inc. All rights reserved. Do not copy, distribute, sell or modify this article without Bourse de Montréal Inc.’s prior written consent. This information is provided for information purposes only. The views, opinions and advice provided in this article reflect those of the individual author. Neither TMX Group Limited nor any of its affiliated companies guarantees the completeness of the information contained in this article, and we are not responsible for any errors or omissions in or your use of, or reliance on, the information. This article is not intended to provide legal, accounting, tax, investment, financial or other advice and should not be relied upon for such advice. The information provided is not an invitation to purchase securities listed on Montreal Exchange, Toronto Stock Exchange and/or TSX Venture Exchange. TMX Group and its affiliated companies do not endorse or recommend any securities referenced in this publication. Montréal Exchange, MX and SXF are the trademarks of Bourse de Montréal Inc. TMX, the TMX design, The Future is Yours to See., TSX, and Voir le futur. Réaliser l’avenir. are the trademarks of TSX Inc. and are used under license.
*The S&P/TSX 60 Index (the “Index”) is the product of S&P Dow Jones Indices LLC or its affiliates ("SPDJI") and TSX Inc. ("TSX"). Standard & Poor's® and S&P® are registered trademarks of Standard & Poor's Financial Services LLC ("S&P"); Dow Jones® is a registered trademark of Dow Jones Trademark Holdings LLC ("Dow Jones"); and TSX® is a registered trademark of TSX. SPDJI, Dow Jones, S&P, their respective affiliates and TSX do not sponsor, endorse, sell or promote any products based on the Index and none of such parties make any representation regarding the advisability of investing in such product(s) nor do they have any liability for any errors, omissions or interruptions of the Index or any data related thereto.