
Gradually, then suddenly
Gradually, then suddenly
First published on 2022-07-06


Markets in Focus

Since its inception, the S&P 500 Volatility Index (VIX) has demonstrated four distinct regimes: the range between 34 and 44 usually marked market panic and capitulation, and there were only a few existential events above the range of 45, such as the Great Financial Crisis in 2008 and the pandemic in 2020. We are now just near the top of the 16 - 34 range, suggesting the market is under pressure, but the selloff has been orderly, and we have not yet reached the firesale and capitulation phase.

The US equity market continued its downtrend with multiple bear market rallies along the way. The Relative Strength Index (RSI) suggests that the downward momentum is still strong; hence the bottom is not in yet. Back in February, when S&P 500 index was still above 4400, we already noted that “Sell the Rally” would replace “Buy the Dip” in an aggressive central bank tightening cycle.

After breaking above a critical resistance level at 22 in the aftermath of the pandemic, silver was stuck in the 22 – 30 range for nearly two years. In the recent risk asset selloffs, silver finally lost the support level at 22. A strong US Dollar and a hawkish Fed are both headwinds for silver. The next support is at around 18.
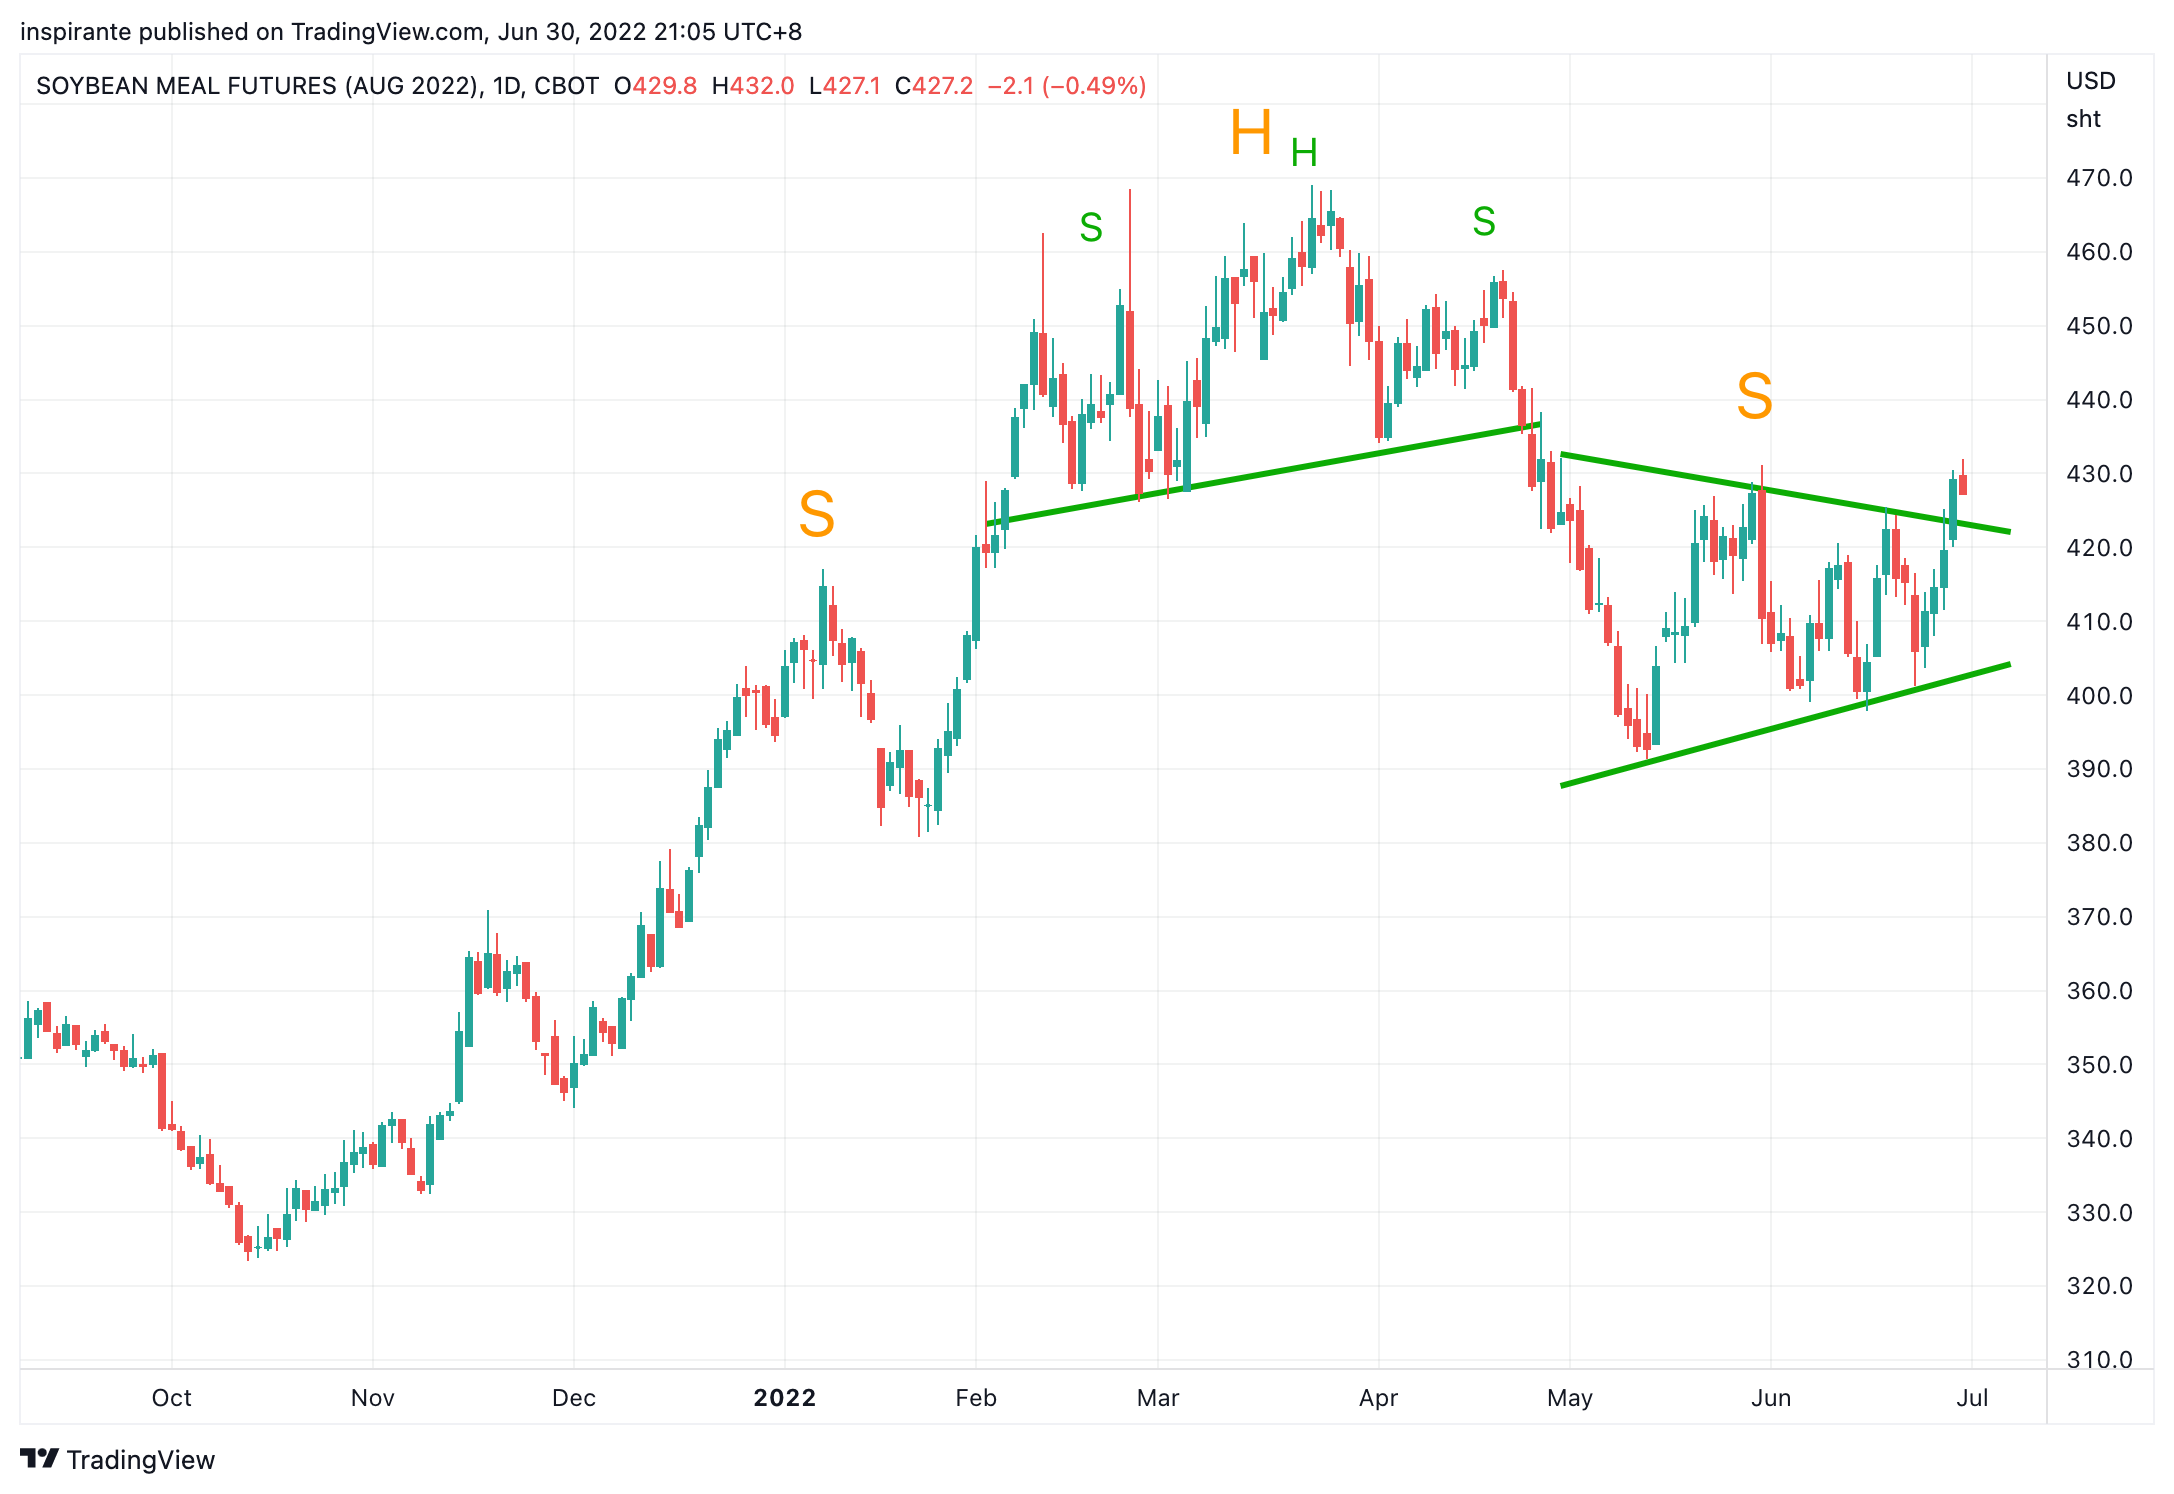
Soybean Meal had completed a Head-and-Shoulder (H&S) top from February to May and sharply sold off when the neckline was breached. Since then, it has been consolidating in a symmetrical triangle. It has now broken out of the triangle and completed a bigger H&S top failure pattern since late 2021, suggesting that the next leg higher has already launched.
Market Views
“‘How did you go bankrupt?’ Bill asked. ‘Two ways,’ Mike said. ‘Gradually, then suddenly.’” – Ernest Hemingway
Although US equities have had one of the worst first-halves in history, it is appropriate to describe the selling as rather “orderly” so far. Just by looking at the sub-30 level of VIX, someone would hardly believe that the S&P 500 Index has dropped more than 20% from its high at the beginning of the year.
The VIX is also known as the “fear index.” It is calculated based on the S&P 500 Index options implied volatility. The episodic eruption of the VIX happens when the market is under stress, and the majority of long-only investors rush to buy put options to protect from further market selloff, pushing up the premium (hence implied volatility). The 34 – 44 range is usually where notable market bottoms are found. The current VIX is only at 29, slightly above the historical average. This led us to believe that we are still at the “gradual” phase, and we have not seen the “sudden” phase yet, where the market becomes bidless and flooded with firesale orders from people getting margin called.
Turning to some of the commodity markets of late, we might get a taste of what the “sudden” phase looks like. Take copper, for example, its price dropped more than 20% from 4.57 to 3.64 within less than a month. At the same time, soybean oil also dropped more than 20% from 80 to 64. December 2022 Corn contract dropped 15% from 749 to 635 in just nine trading days. December 2022 Cotton No.2 contract dropped a whopping 32% from the high of 134 to 91 in slightly more than a month. One of the most staggering moves happened in Lumber, as the July contract collapsed 56% from 1200 to 520 since early March.
Among different asset classes, equities are usually the “last mover,” the slowest to react to changes in macro factors such as an aggressive and hawkish Fed, a strong US Dollar, and potential demand destructions, just to name a few. These factors, combined with profit-taking after a long run, contributed to many commodities’ sudden and drastic selloffs. As we observe more risk assets sitting at critical support levels, the prospect is getting higher by the day for the last straw to finally break the “orderly” market and trigger the sudden cascade of liquidation – time to exercise caution.
How to play the theme out
A hypothetical investor can consider the following trades1:
Case Study 1: Short Micro Silver Future
If the investor were to short the Micro Silver future (SILU2) at 20.2 and set the stop above 22.8, his maximum loss per contract would be (22.8 – 20.2) x 1000 = 2600 USD. An initial target points to 18 and subsequently 14, resulting in (20.2 – 18) x 1000 = 2200 USD and (20.2 – 14) x 1000 = 6200 USD.
Case Study 2: Long Soybean Meal Future
If the investor were to long the Soybean Meal future (ZMQ2) at around 427 and set the stop below 413, his maximum loss per contract would be (427 – 413) x 100 = 1400 USD. A measured target points to, resulting in (470 – 427) x 100 = 4300 USD.
The Rearview Mirror
A look into history could help us position ourselves better for the future. This section provides a rundown of market moves across major asset classes between April and June.

Like the other US equity indices, the Dow Jones is also in a downtrend, despite several bear market rallies. The index continued to register lower highs and lower lows. The next psychologically significant support is at 30000. We discussed shorting the US equity market in March and April.

The US Dollar Index has confirmed the breakout from a seven-year symmetrical triangle as the Fed turned hawkish to curb inflation. A measured target of the DXY points to 112 or even 120.

The Australian Dollar is sitting at an important support at 0.68. Our case study to short at 0.747 in April captured the recent high before dropping almost 9% soon after.

EUR/USD is still at its seven-year support level at around 1.04. Recently, we expected more hawkish moves by the ECB and the strength of the Euro. So far, it has not materialized yet.

After a sharp weakening against the US Dollar, the CNH has been consolidating around the 6.7 level. We structured a case study to long USD/CNH at 6.55 in April. Now the initial target has been met; we still believe it has the potential to reach 7.
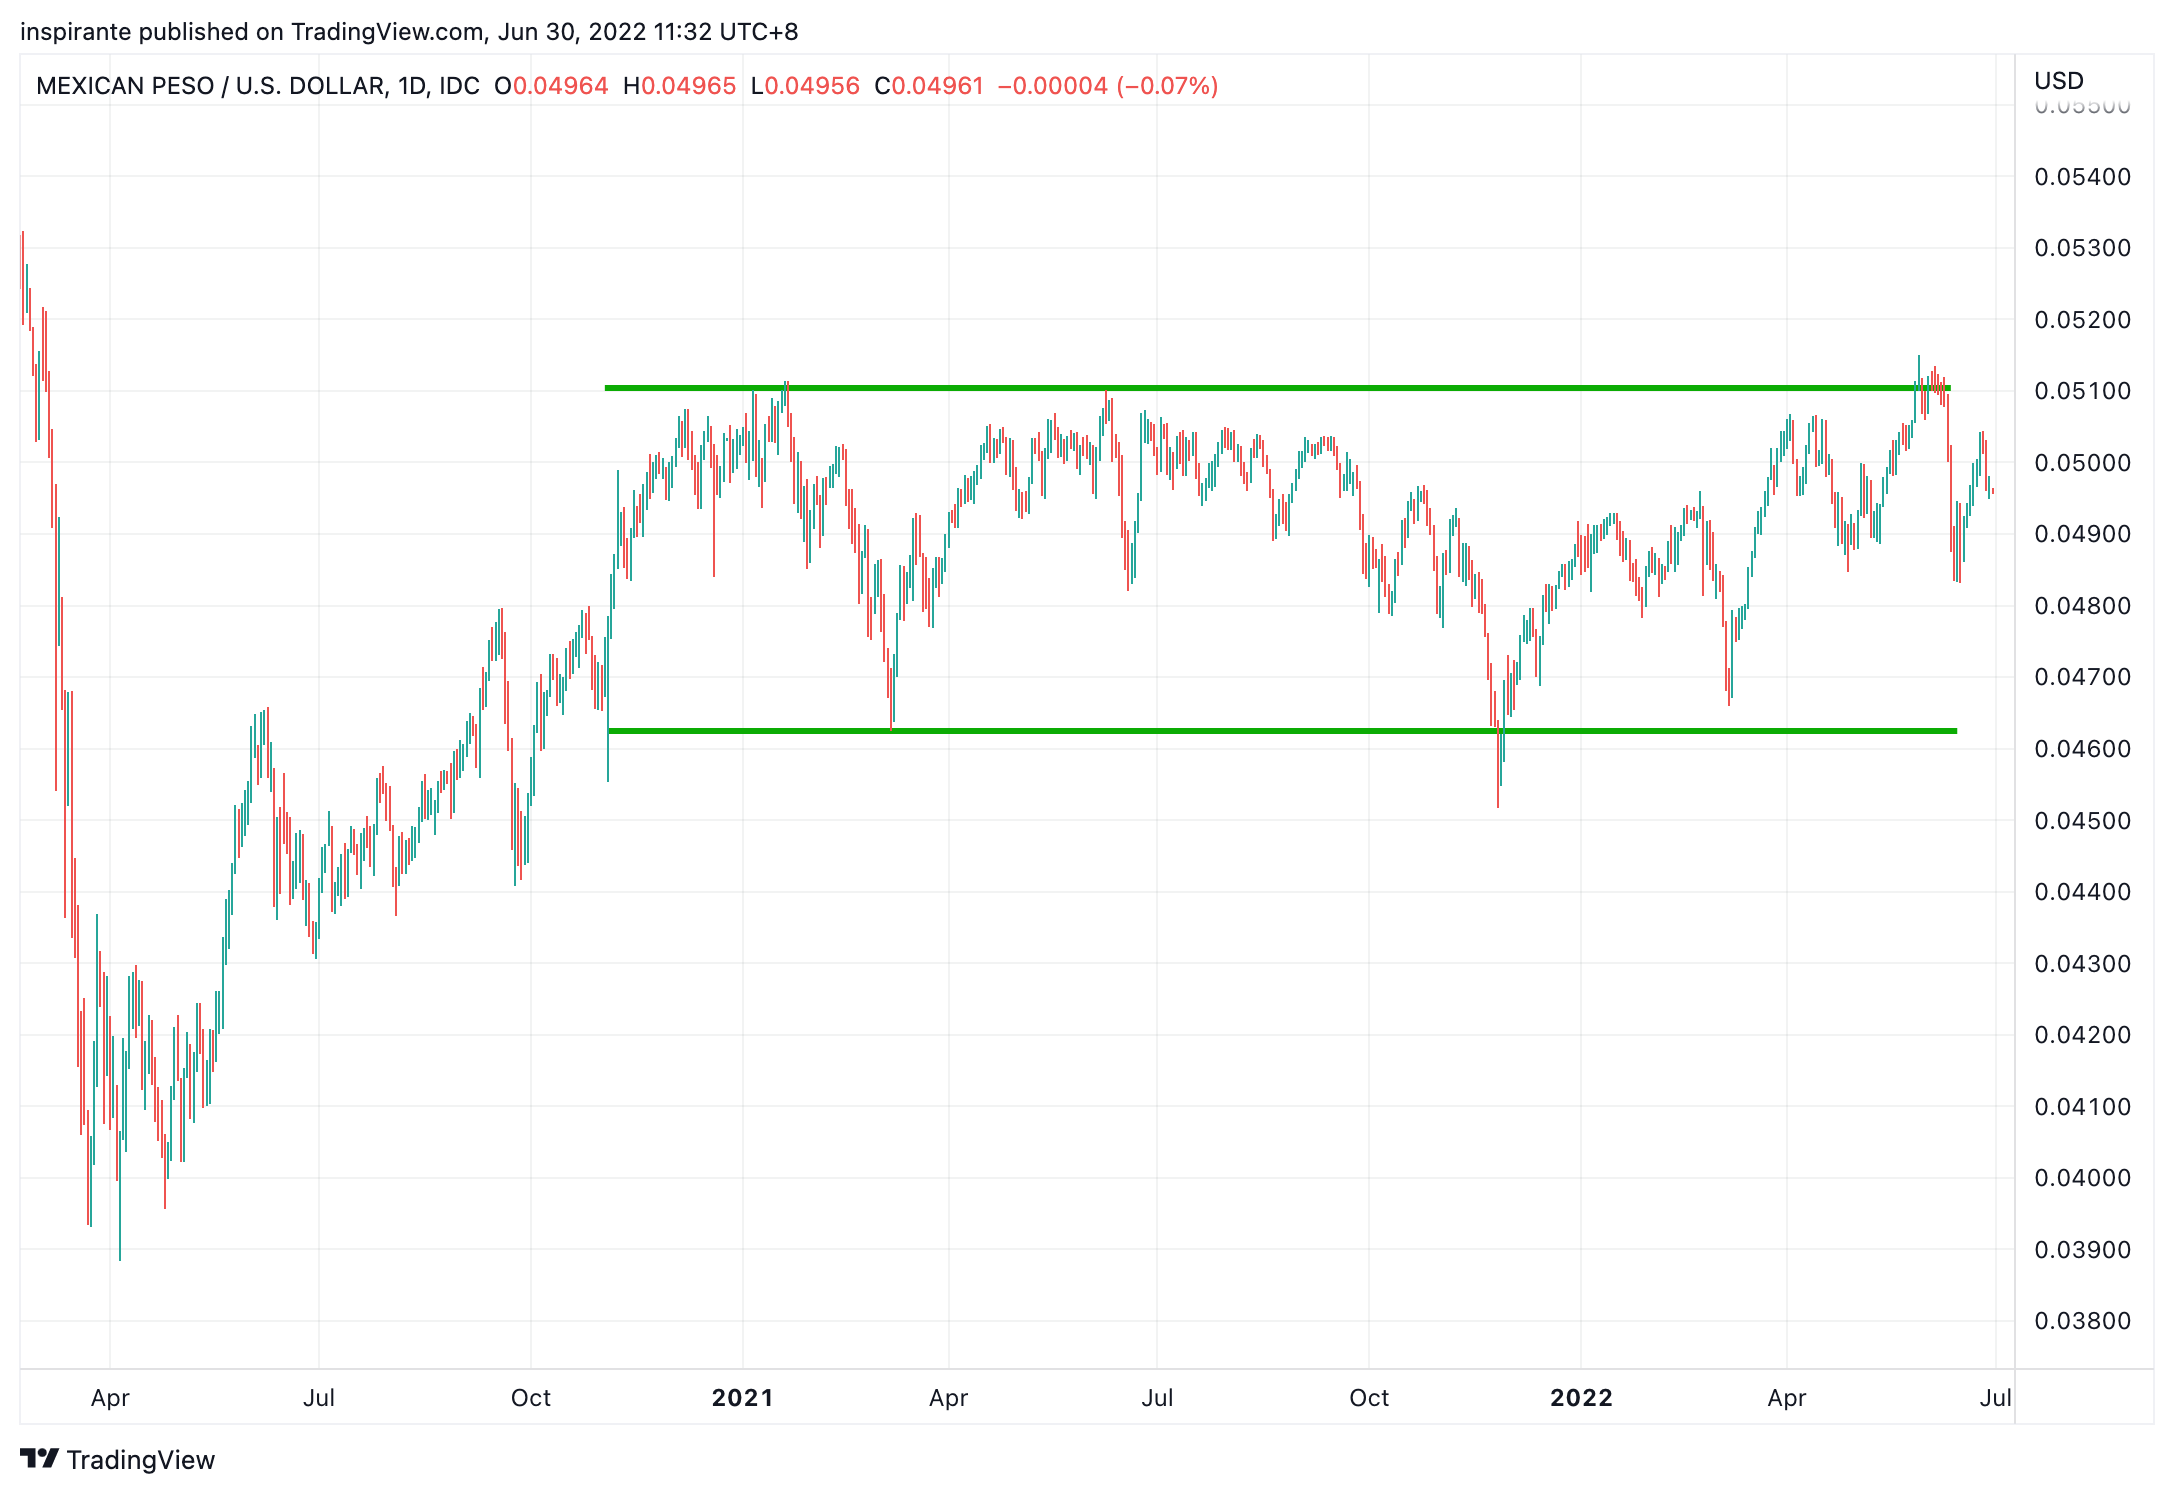
The breakout from the rectangle trading range in early June turned out to be a false break. MXN/USD was rejected hard back into the range.

WTI Crude Oil broke out from the ascending triangle in May. It almost reached our initial target of 120. Although it has experienced a sharp selloff in June, the uptrend for crude oil is still intact.

We had a case study to long RBOB Gasoline at 3.28 when it broke out from a symmetrical triangle in April. It surpassed our first target at 3.6 and almost reached our second target at 4.4.

We discussed shorting copper at 4.27 in early May. Since June, copper has had a sharp selloff, breaking the twelve-month rectangle range. Our first target at 4.0 was quickly reached, and the next target at 3.5 is in sight.

Soybean Oil had a massive selloff of over 20% in less than a month. It seemed to have found its footing at the support level at 62.5. It has rebounded since then. Nevertheless, the bullish trend of soybean oil has been jeopardized.

Similarly, Soybean also jumped off the cliff before rebounding at the 1400 support level. It could be forming a broadening top pattern if the commodity selloff continues.
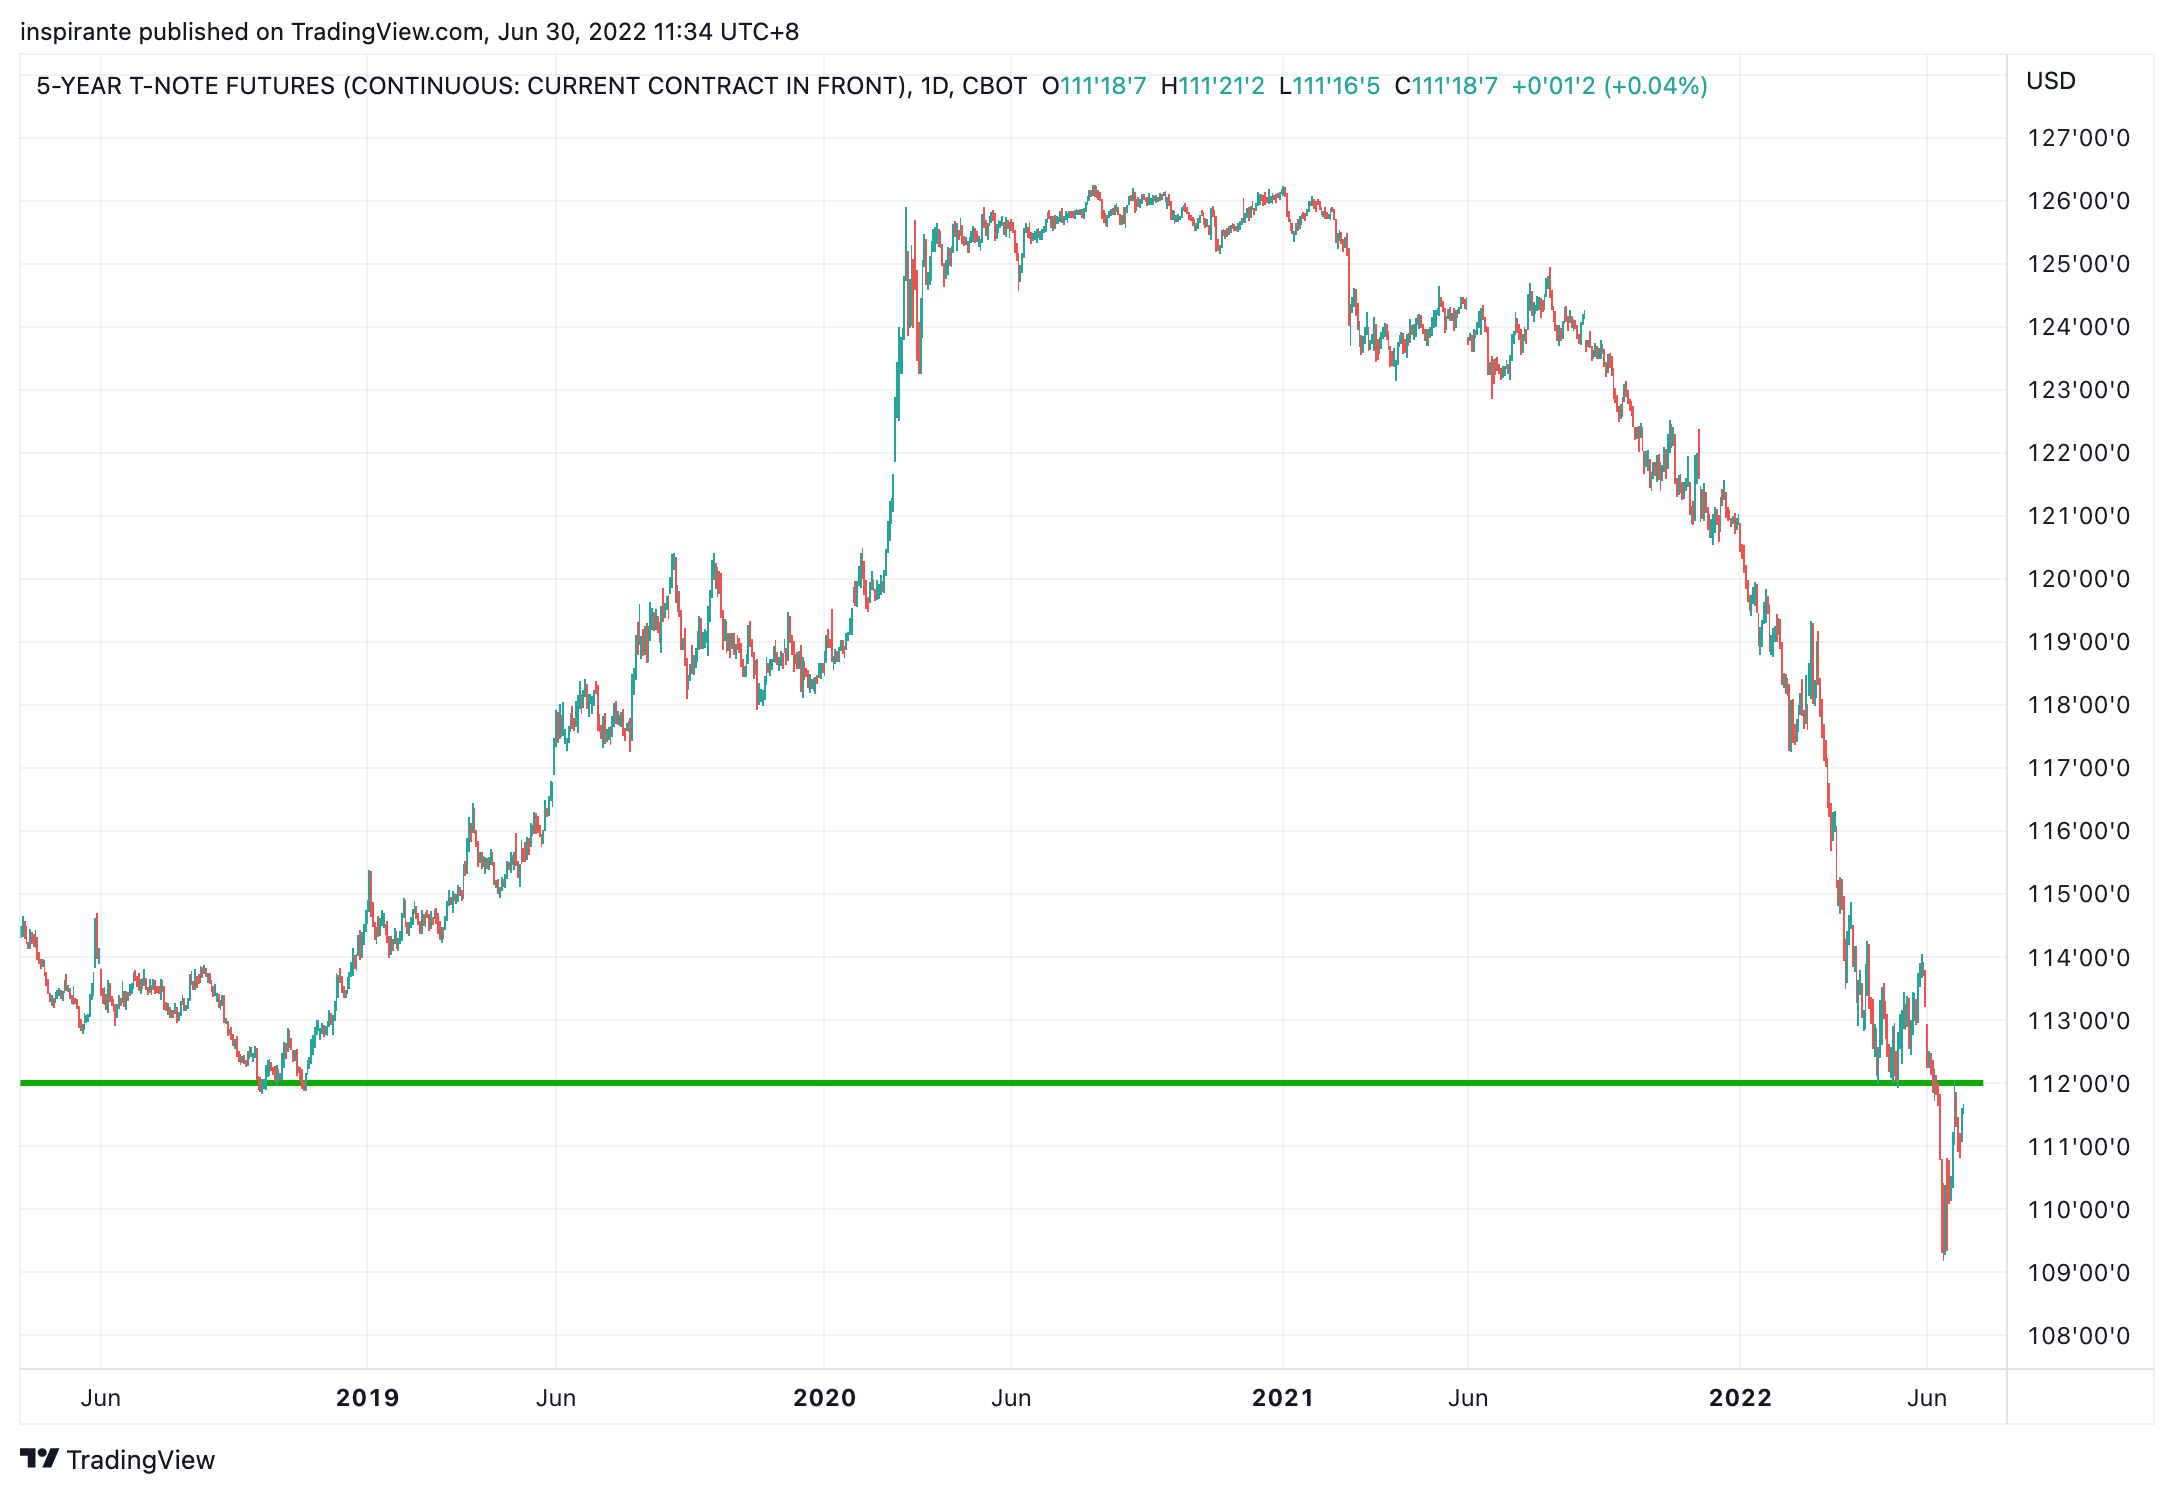
Ever since inflation started running hot and the market began to price in the hawkish pivot of the Fed, the 5-year T-Note future fell like a stone. In early June, it decidedly broke the 112 level. Now, the 5-year yield is at 3.2%, the highest since September 2008.
Original Link: https://www.cmegroup.com/newsletters/fresh-from-the-trading-room/files/fresh-from-the-trading-room-2022-07-05.pdf
Examples cited above are for illustration only and shall not be construed as investment recommendations or advice. They serve as an integral part of a case study to demonstrate fundamental concepts in risk management under given market scenarios.
 | A guest post by
|