Markets in focus
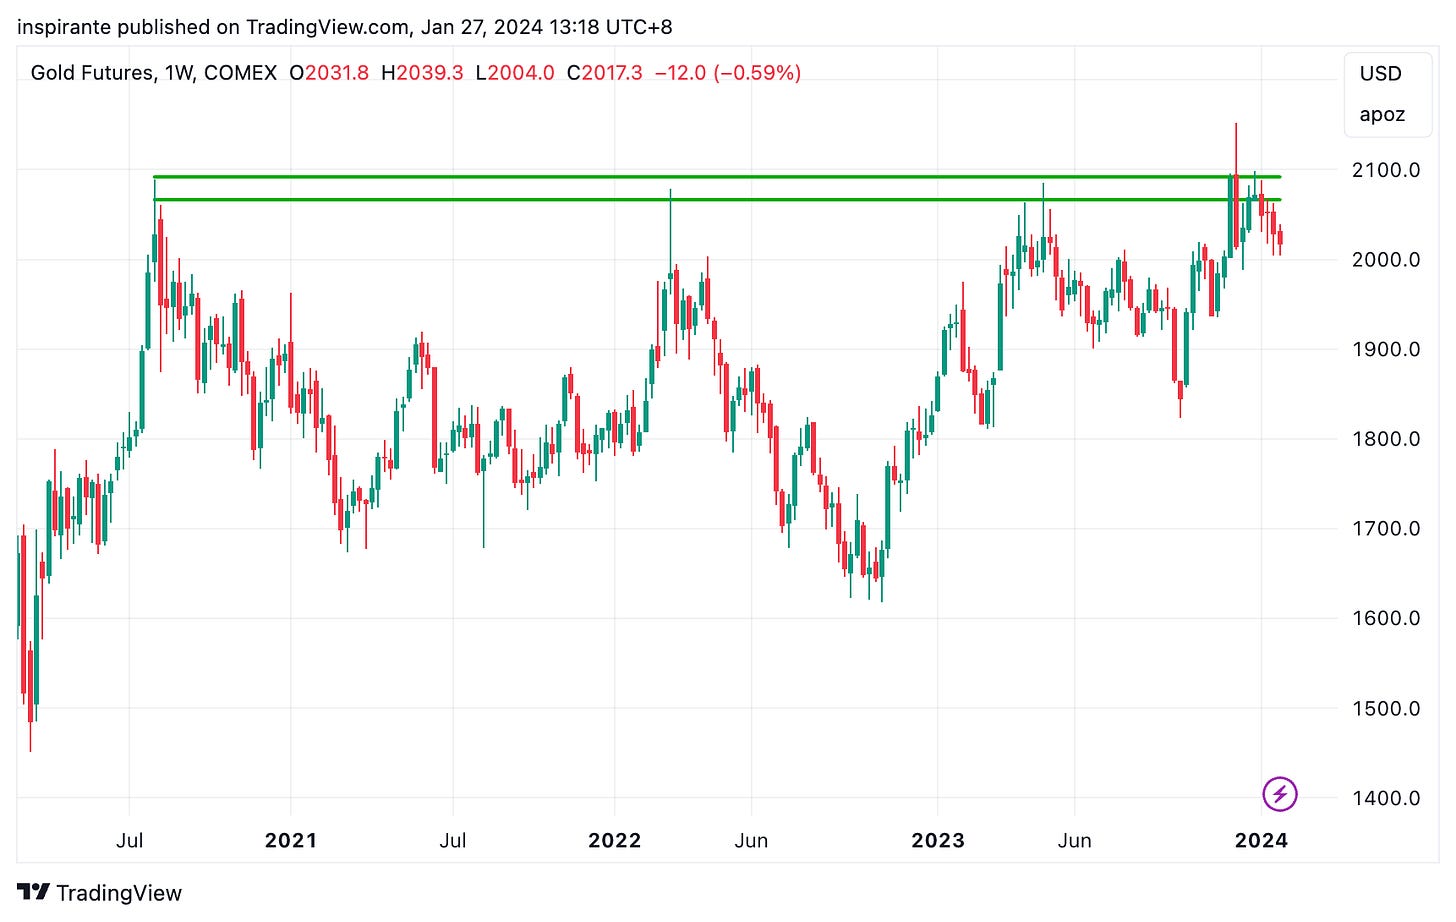
Gold has repeatedly encountered resistance at the 2100 level, facing rejections four times in the past three years. Currently, it's consolidating above 2000 following its latest breakout attempt. The chart shows no significant technical damage, and the upward momentum remains evidently intact.
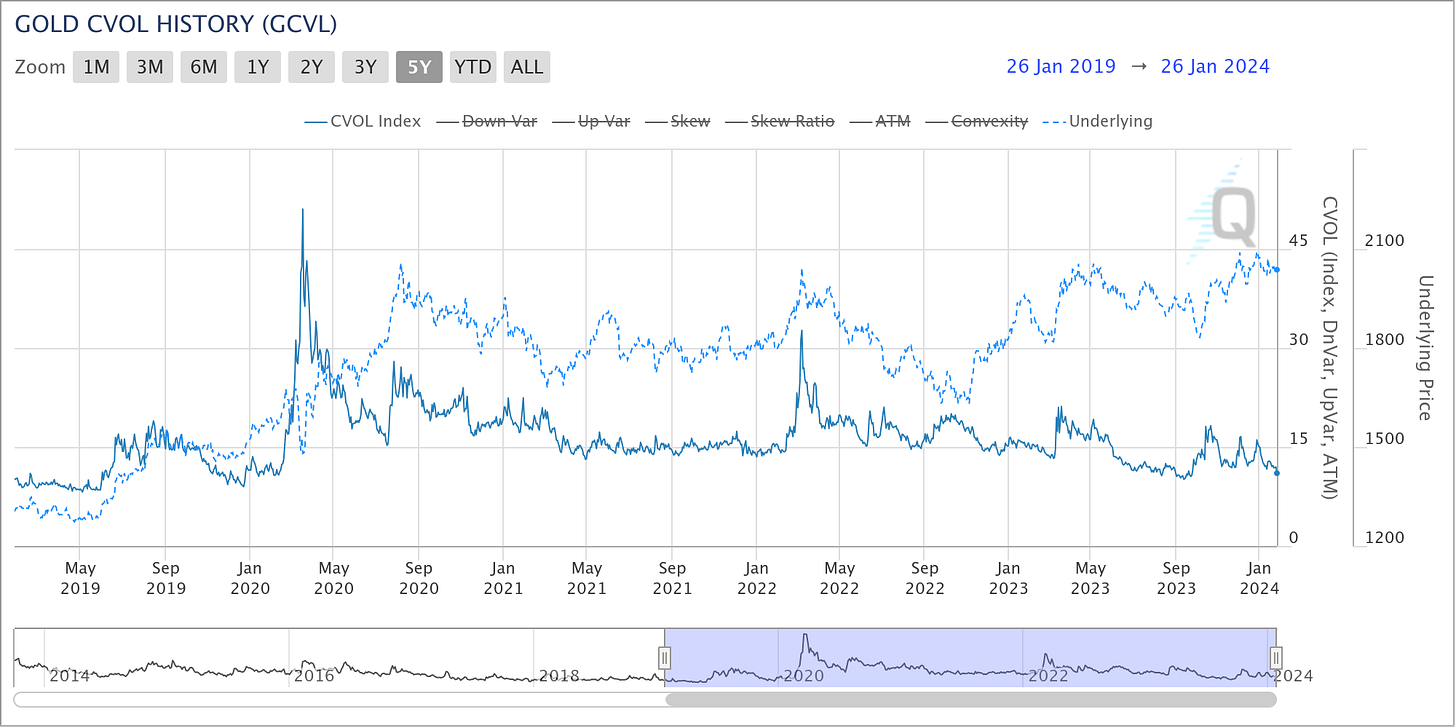
Gold volatility, as indicated by the CME Group Volatility Index (CVOL), is hovering near pre-pandemic lows. This contrasts with previous price peaks where volatility notably spiked, marking a distinct divergence in the volatility-price relationship.
Copper is currently within a 20-month symmetrical triangle, consistently trading below the critical resistance level at 4.0. As the price approaches the triangle's apex, the likelihood of a breakout increases, signaling a potentially significant move ahead.
Like gold's, copper's volatility has retreated to pre-pandemic levels. This decline reflects the commodity's narrow trading range and suggests that the market has not yet positioned itself for a significant breakout move.
The Copper/Gold ratio demonstrates a strong correlation with the ISM Purchasing Managers Index (PMI), a key measure of U.S. manufacturing sector activity. A PMI rebound above 50, indicating expansion in manufacturing, would likely favor copper's performance relative to gold, as historical trends suggest.
Our market views
Scanning through the volatility landscape of major asset classes with the CME Group Volatility Index (CVOL), it's hard not to notice the subdued implied volatility across the board, except in the energy sector. We've touched on our positive outlook for energy in our last piece, especially given its underwhelming performance over the past year and now, with technicals pointing towards an upward breakout. Our stance here remains unchanged; recent price actions in crude and heating oil continue to support this view.
Shifting the focus to the metals sector, this appears to be the next area primed for a significant shift, likely leading to a breakout in both price and volatility. Let's start with copper, or 'Dr. Copper' as it's often called. Recalling our in-depth discussion from May 2022, we believed copper still had much room to grow in the current cycle. However, we also noted potential short-term headwinds like tightening central bank policies and recession risks. As shown in Figure 3, copper experienced a more than 30% drop in the following three months and has since been consolidating within a symmetrical triangle. Fast forward nearly two years, and with the hiking cycle seemingly in the rearview mirror, a 'soft landing' scenario is now becoming the prevailing narrative. The U.S. equity market, especially tech stocks, has already surged to new heights. Copper, however, hasn't seen the same level of investor interest, with its implied volatility at its lowest since the pandemic. If the equity market's optimism about the economy and Fed policies holds true, we expect copper to catch up, driven once again by its fundamental strengths. From a technical perspective, the potential breakout could be even more pronounced as copper edges closer to the apex of its multi-year symmetrical triangle.
Then there's gold – a unique asset that always evokes strong, often dividing, opinions. Whether seen as timeless money or just a 'barbaric rock,' gold's recent price movement is undeniably telling an important story. Gold prices recently hit an all-time high, currently consolidating just below the $2,100 level, a significant resistance point that has capped its ascent several times since 2020. Looking at gold's past, heightened implied volatility often accompanied its peaks, driven by major events like the mid-2020 pandemic response, the Russia-Ukraine conflict in 2022, and economic downturns in 2023. But unlike before, where volatility spikes were fleeting and followed by sharp price drops, the market is reacting differently this time. Even as gold climbed above $2,000, the lack of a volatility surge might indicate a market that's confident, or maybe even a bit complacent, about the current macroeconomic scene, seeing gold as rightly priced. This steady ascent, not sparked by a singular event, supports our view of gold.
In conclusion, the technical patterns and subdued volatility in the metals sector have captured our attention. This environment enables us to strategically leverage options for a favorable risk-reward balance.
How do we express our views?
We consider expressing our views via the following hypothetical trades1:
Case study 1: Long copper call options
We would consider taking a long position of copper's at-the-money call options that expire in late March (HXEJ4 3.9 C) at a premium of 0.1039 points, or 25000 x 0.1039 = 2597.5 USD. The implied volatility is around 17%. At the option expiry, if the copper futures price is above 3.9 + 0.1039 = 4.0039, the position would be in profit. The maximum potential loss for the position is the premium paid. Before the option expiry, both underlying price increase and implied volatility increase would benefit the option price, other things being equal. The payout diagram below is generated by QuickStrike’s Strategy Simulator.
Case study 2: Long gold call options
We would consider taking a long position of gold's at-the-money call options that expire in late March (OGJ4 2050 C) at a premium of 28.5 points, or 100 x 28.5 = 2850 USD. The implied volatility is around 10.7%. At the option expiry, if the gold futures price is above 2050 + 28.5 = 2078.5, the position would be in profit. The maximum potential loss for the position is the premium paid. Before the option expiry, both underlying price increase and implied volatility increase would benefit the option price, other things being equal. The payout diagram below is generated by QuickStrike’sStrategy Simulator.
Original link here.
EXAMPLES CITED ABOVE ARE FOR ILLUSTRATION ONLY AND SHALL NOT BE CONSTRUED AS INVESTMENT RECOMMENDATIONS OR ADVICE. THEY SERVE AS AN INTEGRAL PART OF A CASE STUDY TO DEMONSTRATE FUNDAMENTAL CONCEPTS IN RISK MANAGEMENT UNDER GIVEN MARKET SCENARIOS. PLEASE REFER TO FULL DISCLAIMERS AT THE END OF THE COMMENTARY.


