Introduction
A warm welcome to our first independent piece, where we share some thoughts we have on the quarter ahead. By way of introduction, we’re Inspirante Trading Solutions (ITS), a research/education arm of Synergy Link Capital. Before we continue any further, what we write or say in this piece should NOT be construed as investment advice.
Our aim with these pieces is for us to further develop conviction in our views as we research and share them. Having our views challenged and exchanging discussions seems to be a healthy way for us to develop and explore our ideas. Perhaps gaining new and fresh insights through these interactions. We hope to make this a quarterly, plus ad hoc series (fingers crossed), where we share our thoughts every quarter and supplementary ad hoc piece if we spot anything interesting or thought-provoking.
What we’re thinking:
Fed has to balance its two mandates of employment and stable prices.
Employment still shows signs of strength, but real wages are still stuck in negative YOY territory.
Fed’s historical reaction of raising rates higher than inflation points to further tightening.
But market expectations seem to disagree, expecting the Fed to cut rates as early as Q4 2023.
We think markets front running the fed may lead to loosening financial conditions, which might allow inflation to linger—forcing the fed to tighten further.
On top of that, QT is only just started, which could further drain liquidity.
And a higher rate regime may be here to stay.
All are pointing towards further downside for equities.
Why we’re thinking what we’re thinking:
Why the Fed might stay hawkish.
With all the chatter on the Fed Pivot, let’s start by reminding ourselves of the Fed’s mandate,
Maximum employment
Stable Prices and Moderate Long-Term Interest Rates
Consider this, you’re Jerome Powell, the US is currently facing decades-high inflation, but unemployment remains close to an all-time low.
Your options;
Hawkish: Focus on squashing inflation and continue tightening to prevent the dreaded runaway or double peak inflation. Wait until clear signs of inflation stabilizing towards the long-run target or an uncomfortable recession. Knowing you were very, very wrong on your previous ‘transitory’ call and, as a result, eased policy into a never-seen-in four decades high inflation period.
Dovish: Front-run lagging economic indicators are starting to show signs of peaking. Start to ease up on tightening and even consider pivoting to avoid a recession and achieve the proverbial soft landing.
Tough position, not one we’ll want to be in. Now in each situation, let’s see what happens if you get it wrong.
Dovish, and inflation pops higher; you’ve just made two bad policy timing calls in a row. Embarrassingly you have to come back, hope everyone excuses your mistake, and tighten again, putting markets in yet another season of frenzy.
Or
Hawkish, and equity markets will hate you for a bit; markets take a while to re-align expectations and maybe dip into a recession. But at least now you’ve achieved your mandate and can say that you did what you could to bring down the never seen in 40-year inflation beast, all while paying homage to the ‘keeping at it’ (Paul Volcker) mentality.
To us, it seems the room for error on the Hawkish side is quite a bit larger. The modern fed and its many tools have some experience under its belt navigating out of a recession (Think rate cuts, QE, YCC). Still, it has hardly any experience navigating out of high inflation. For what it’s worth, the current rate hiking strategy seems to work well. And if it does work as intended, then why reverse course and risk losing control? And even if they take it too far, they have proven their abilities to get out of a recession. Hence, we wouldn’t bet on the fed reversing course soon.
But enough with the thought experiments, you say, let’s look at some data!
On Employment
One thing is clear here; if anything, the job markets seem primed to be able to take on further tightening on the employment front, with indicators such as Initial claims still close to the all-time low.
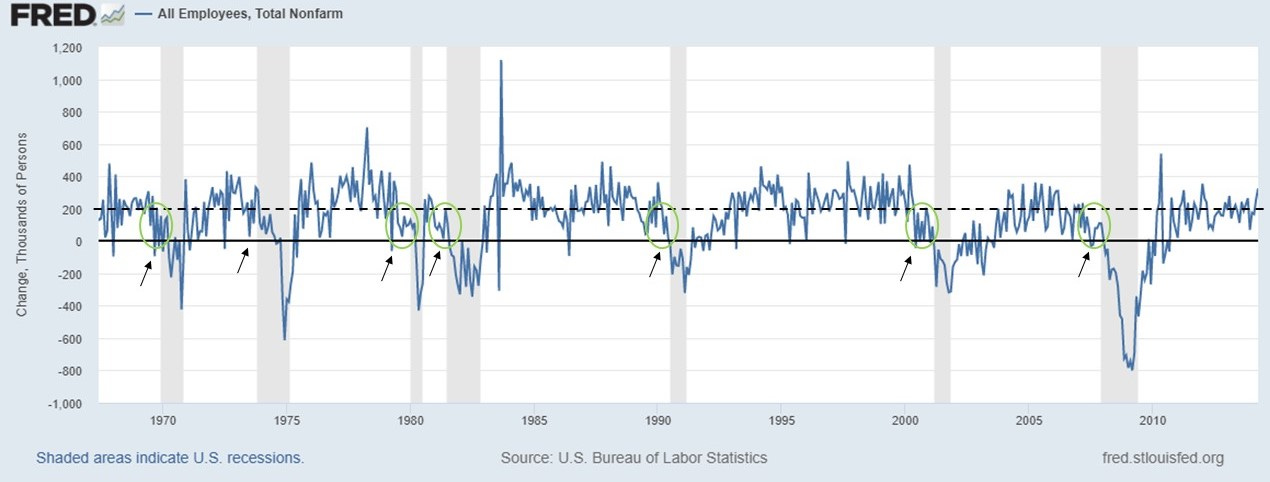
With the December nonfarm payrolls coming out at 223K, beating expectations, the labor market is once again demonstrating its strength. In fact, historically, the non-farm payroll numbers dip below the 200K mark for a rough average of 6 months before going into recession (Circles). And print a sub 50K number prior to every single recession (Arrows)
With current non-farm payroll numbers comfortably above the 50K mark and not yet under the 200K range, we think there is still a while to go before the employment show that it’s hurting. More importantly, this signals that the labor market can take further tightness.
Aside from employment tightness, another metric that might be worth looking at is wages on a real basis. This chart from Charlie Bilello shows on an inflation-adjusted basis, American workers have actually been making less for the past 21 months as inflation continues to outpace wages.
The effect of this strain is showing up in the form of people running down savings to cope with rising prices. In fact, Personal Savings Rate is only just slightly off all-time lows seen in 2005, giving the Fed another point of worry and a ‘wage-inflation’ gap to close as they try to regain control over real wages.
On inflation & rates
We’ll like to start by reminding everyone of this:
The Fed’s very own summary of economic projection in December 2021 of a 0.9% target rate by the end of 2022. Oh god, how wrong they’ve been, and if anything, it’s clear even the fed got caught by surprise here. With the fed playing catch up throughout 2022 by hiking a hefty 425 basis points, we naturally wonder if that is enough to curtail the inflation demon.
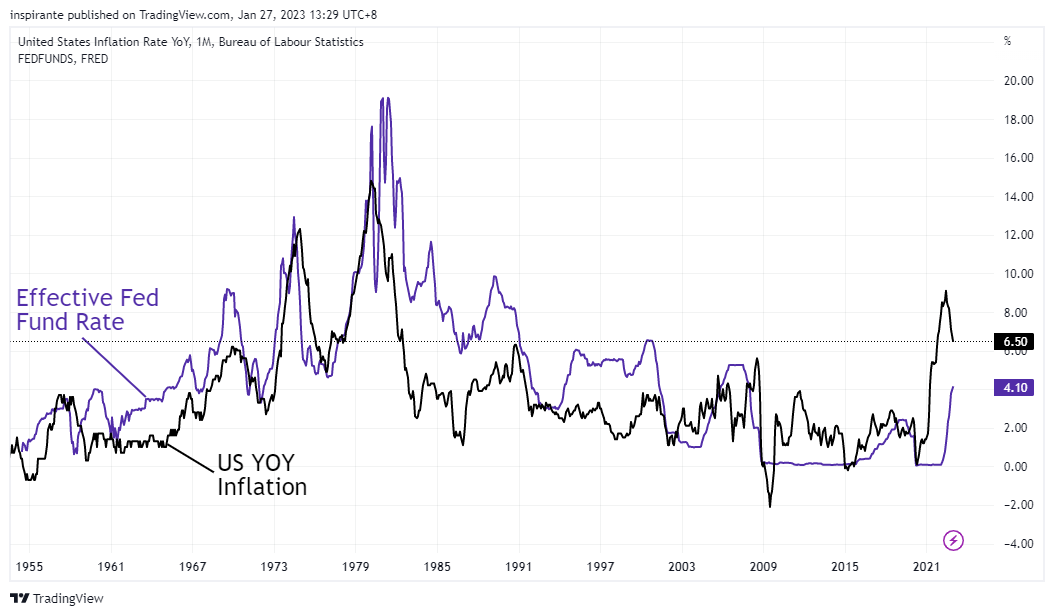
To answer this, let’s look back at past inflationary periods. Each time yoy inflation crept up above 5.75%, it took hiking rates above inflation (highlighted) before inflation finally subsided.
Viewed with a different lens, this inflation/rate dynamic can be split into two different regimes, pre-1980s and post-1980s.
What’s interesting to us is how, in the pre-1980s, this differential seems to hover around 0, leaning more often on the negative side, meaning rates are higher than the inflation environment. But post the 1980s Inflation and the ensuing rate hikes, a whole new regime unfolded. As rates tumbled, the world got more and more comfortable with letting the inflation-rate gap creep wider as we observed the 40-year uptrend.
The 2022 Inflation spike has clearly broken this pattern, and the question is, is this a regime-changing inflation shock, or will it just revert to the trend mean? Fundamentally we think such spikes in the charts highlight central bankers’ panic points as they attempt to arrest inflation quickly, often overdoing it, causing the inflation-rates differentials to fall back to the ‘base line’ or lower, with the 75’ & 80’s period as a clear example. Our best guess here is that this differential is likely to fall back to at least the trend bottom or further, which currently seems to be near parity. Meaning rates and inflation reach an equilibrium.
With rates still a whopping 240 bps behind inflation, the road ahead seems to have two clear paths now, either inflation comes down naturally, or the fed has to giddy up on the Hawkish rhetoric.
Looking ahead…
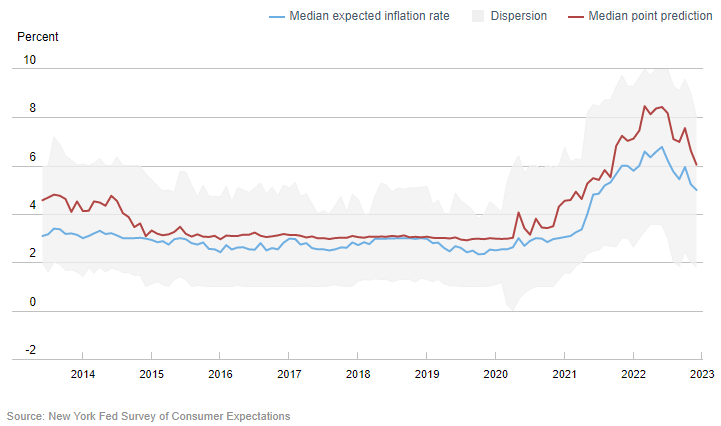
The market-implied road ahead seems to be as such. Using the NY Fed Survey of Consumer Expectations for the One-year ahead Inflation expectations and taking it at face value, we are looking at an expected 5% inflation level in December 2023.
As for expected rates, we can use the handy Fedwatch tool by CME to get the market-implied forward path. Which appears to be one more rate hike in February 2023 before holding out until November 2023 after which market expectation is for the Fed to pivot.
Plotting it all out we get something that looks like the chart above. With expected inflation just shy of rates at the end of 2023. Will this be enough to bring inflation down to the long-run target of 2%?
History seems to tell us no. Remember as we established above, historical precedence show rates have to be higher than inflation for inflation to finally come down. In fact, for the 3 of the 4 episodes when inflation surged above 5.75%, rates were on average 240 bps higher than inflation when inflation peaked, the only time rates were lower than inflation when inflation peaked was in 1974, when inflation never truly got sequestered, dipping only just under 5% at its lowest before coming back to haunt the fed again in 1977. TLDR; Rates >> Inflation
Considering all these, we think on balance that there is a case to be made that the fed will remain tighter than current expectations. With the labor market still proving strong, the decision to remain on a tightening path becomes an easier one. Historical precedence also seems to sway the votes to remain tighter for longer. From a policy mistake point of view, remaining tighter for longer seems to be the easier option out, even if it turns out to be the wrong choice.
Additionally, Financial Conditions remain relatively loose and have turned looser even in the face of the hikes.
This could be yet another signal to the fed that more can be done to slow inflation down.
On Equities
Policy rates discussions aside, here are a few other things that we think might weigh on equities.
The fed’s balance sheet is on track to contract by the most since the 2018 taper tantrum, which, if you remember, brought about spates of volatility.
Putting the current tightening in perspective, it has barely started. The Fed’s balance sheet, at 5.31% off the peak, is not even half of the previous episodes of balance sheet reductions. More pain to come, as they say…
Money Supply M2, has just experienced its first annual decline on record since 1959.
And as Goldman Sachs Asset Management points out, ever since the 2008 GFC near 0 interest rates has forced investors to take on more risk to generate return resulting in the ‘There Is No Alternative (TINA)’ regime. This has resulted in a one-way boom as attention was focused mostly on equities. With rates adjusting higher and possible for the long haul, it does appear that the ‘There Are Reasonable Alternatives (TARA)’ regime is coming into the picture.
Conclusion
All in, we see a Fed that will hold rates higher for longer as they can (employment remains relatively resilient), and they should (to get out of negative real wages and to keep inflation under control). Additionally, the effect of quantitative tightening remains to be seen as it gains traction, and investors rethinking the TINA to TARA regime change should weigh on equities.
If there’s anything we’ve learned over the past three years, it would be “Don’t fight the fed.” We’ll wait patiently to see their move.
Indeed, we are not ignorant of the vastly different demographics, fiscal policies, energy complex, and world in general when making these past comparisons. Our point here is to provide a simple framework to understand this complex macro situation and hopefully for you to include this point of view when making your own analysis.
Stuff to watch out for…
In this section, we highlight some interesting points that we think are worth keeping on your radar.
North American Fertilizer Prices YoY leads US Food CPI by six months. This should alleviate the already rolling-over CPI figure as we continue to watch this data point.
US Energy Inventories are close to multi-decade lows and falling at the fastest rate ever seen.
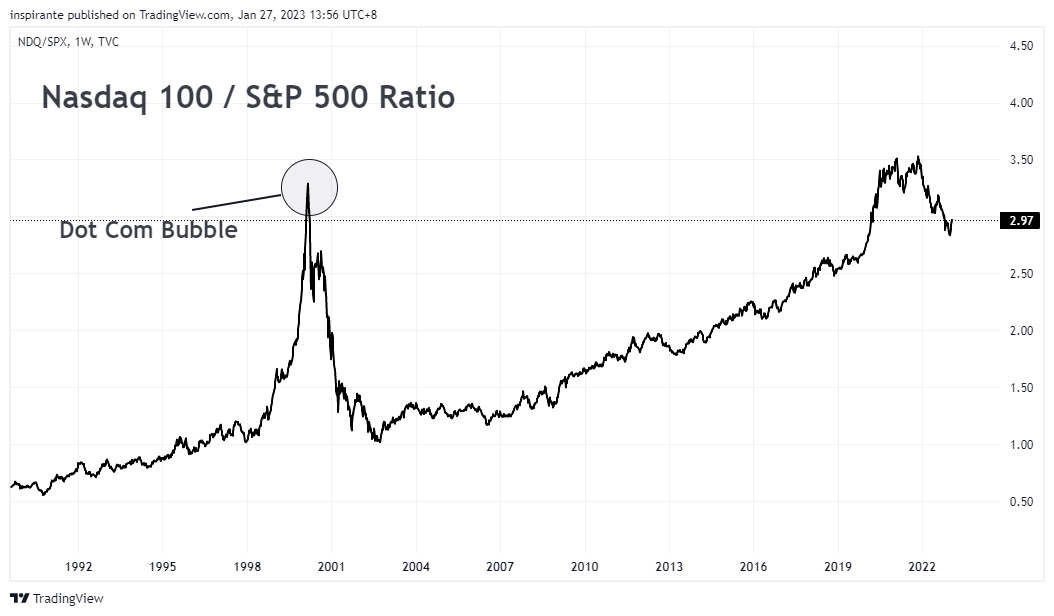
The Nasdaq100/S&P500 ratio, although off the all-time high, is still pretty elevated compared to the 2000s period.
BOJ’s Kuroda term comes to an end soon. Will this usher a new era of policy for Japan?
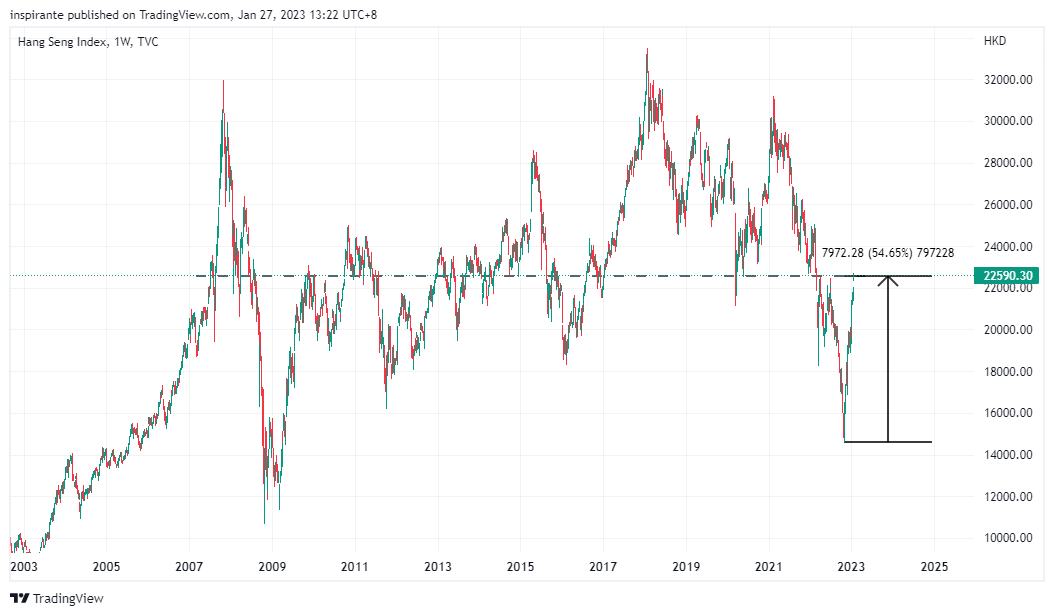
After a whopping 54% rally from the bottom, is it time to fade the Chinese equities rally?
If you’ve made it to the end, we thank you for supporting this piece! Please consider subscribing to our Substack as we continue to share our thoughts, and we also publish different research content on our other channels/mediums linked here.
References
https://www.federalreservehistory.org/essays/great-inflation
https://www.stlouisfed.org/publications/regional-economist/2022/june/getting-ahead-of-inflation-lesson-1974-1983
https://www.cmegroup.com/markets/interest-rates/cme-fedwatch-tool.html
Disclaimer
Full Disclaimer: https://inspirantets.com/disclaimer.html


