
A few weeks where decades happen
A few weeks where decades happen
First published on 2022-03-30


Markets in Focus
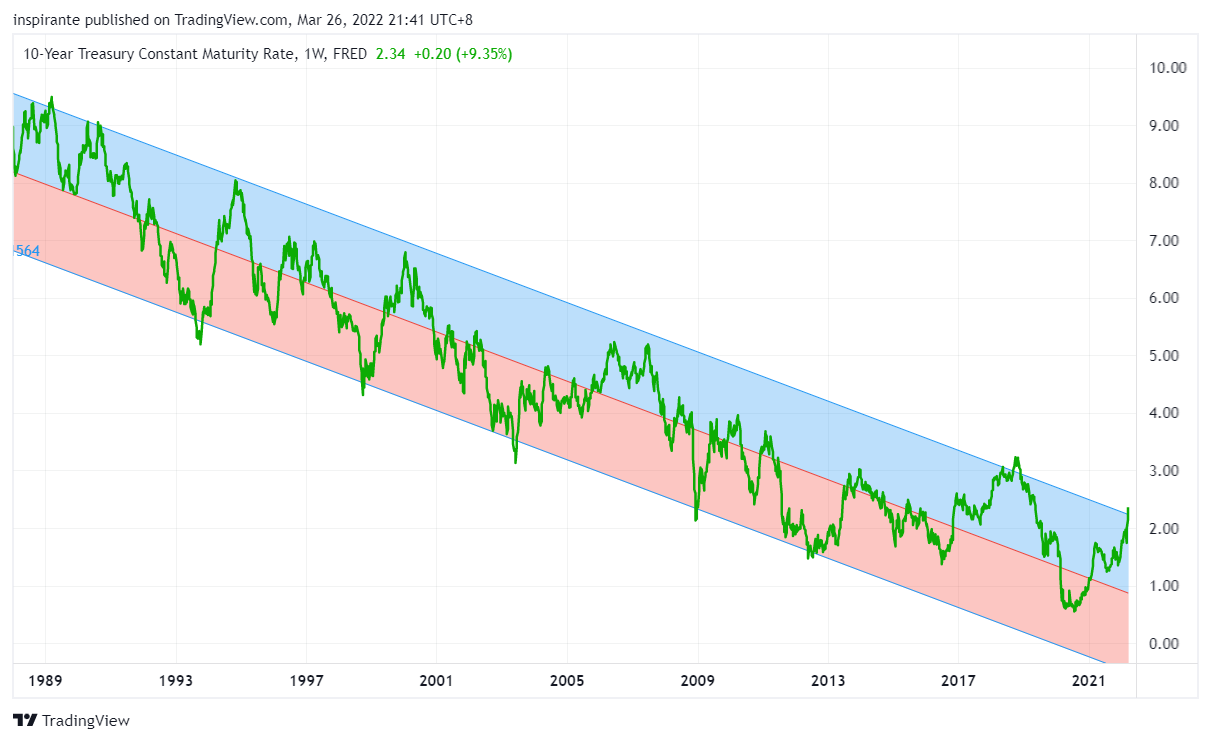
The US 10-year yield has had one of the fastest rises since the cycle low to reach the top of its 40-year downtrend channel. The monthly Relative Strength Index (RSI) also suggests a correction, if not a big reversal, is long overdue.
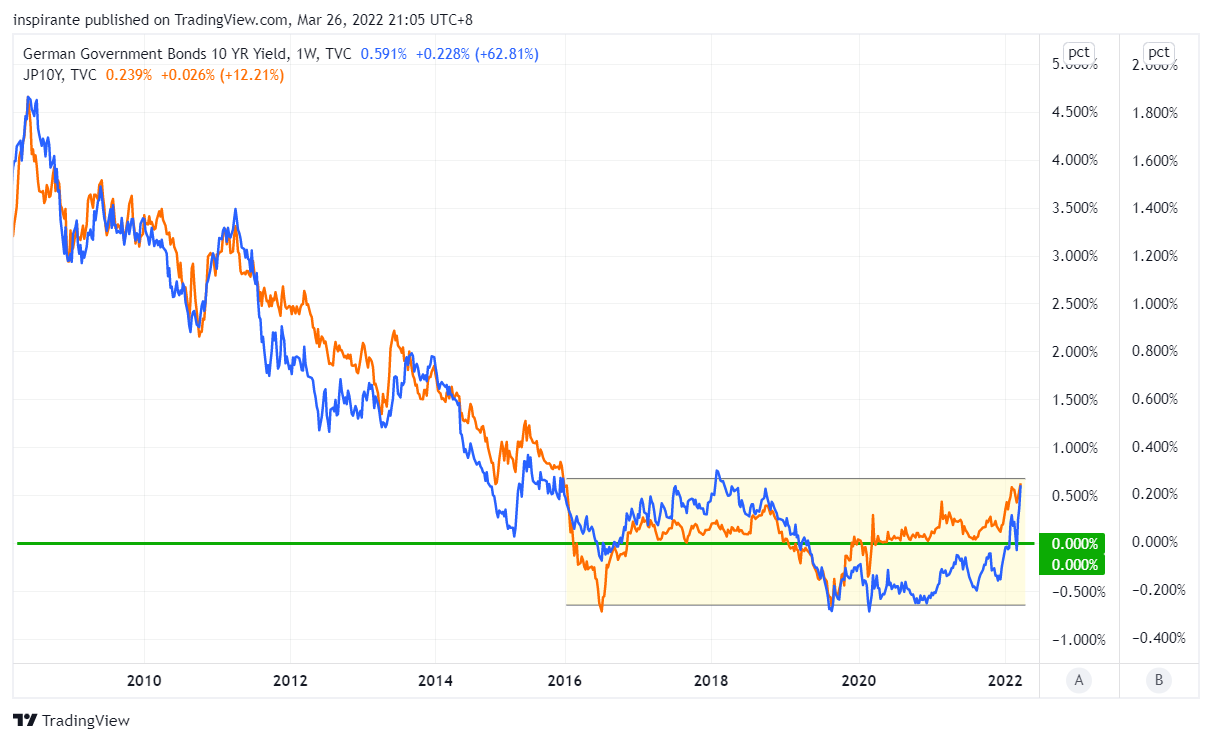
The German 10-year (Bund) yield and Japan 10-year (JGB) yield have both risen to the top of their ranges for the past six years. The ECB introduced negative interest rates in 2014, and the BoJ also went negative in 2016. Now, these bond yields are well inside the positive territory.
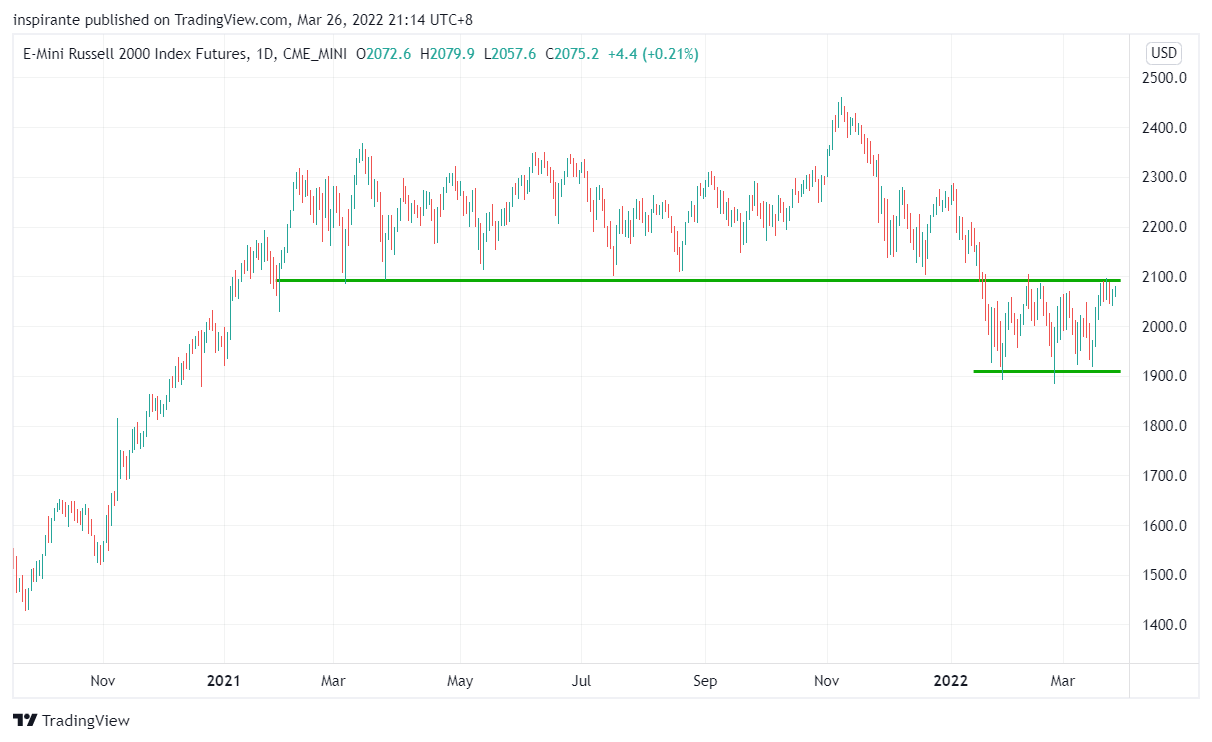
After breaking down from the twelve-month support, the Russell 2000 Index consolidated, and the 2100 level has now turned into a strong resistance that rejected the index’s rebound multiple times.
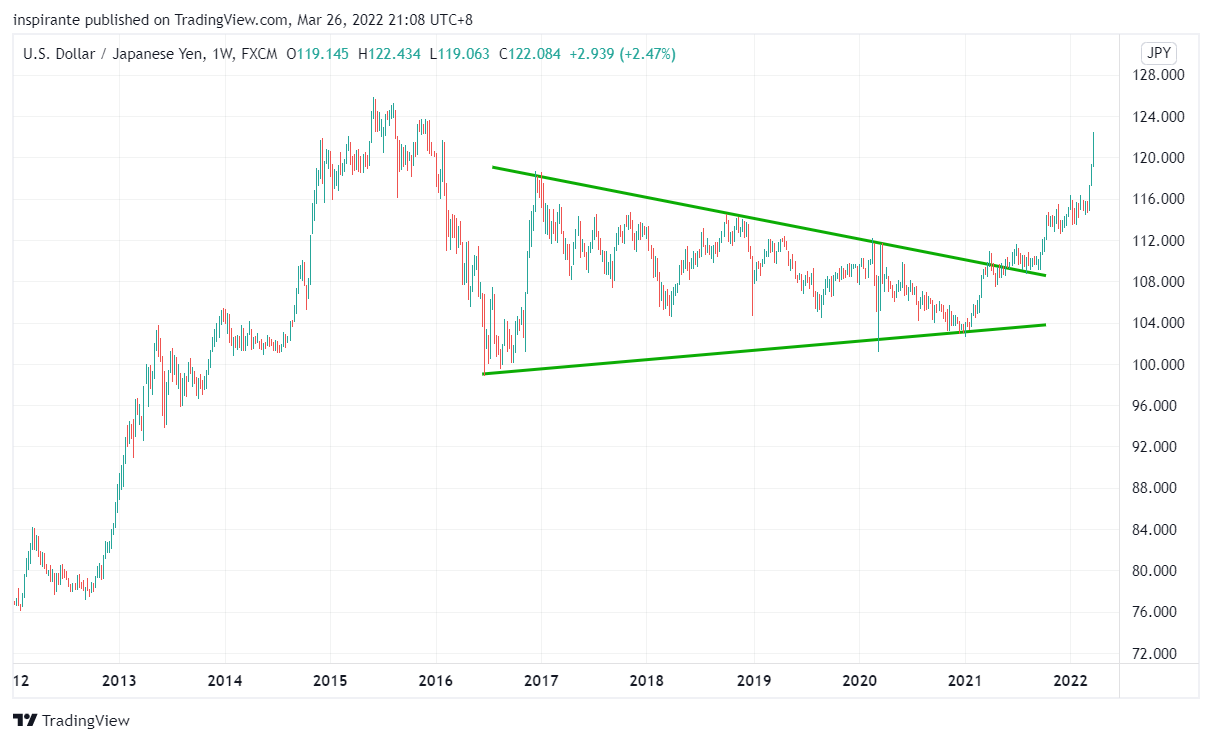
The Japanese Yen accelerated its weakening against the US Dollar and reached as high as 122 Yen / Dollar. It mainly resulted from policy differentials between the BoJ and the Fed, and a weaker Yen is a tailwind for Japanese equities.
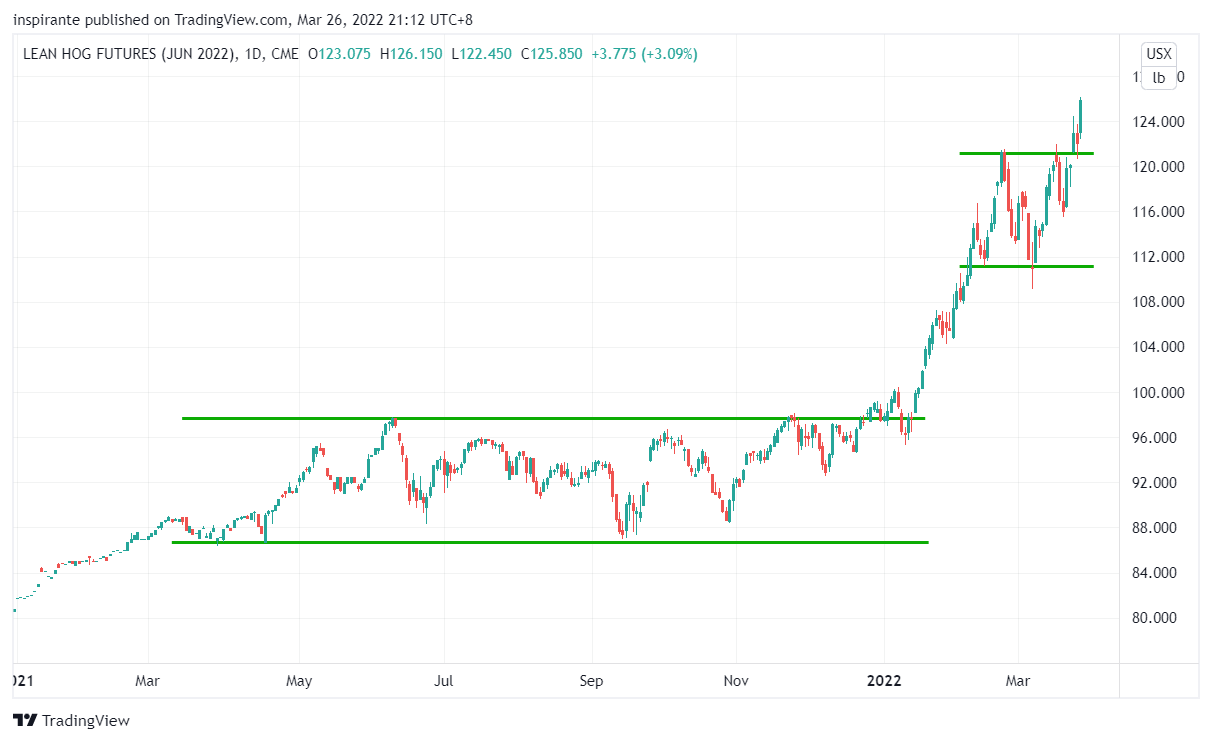
Lean Hog broke out from its one-month consolidation and resumed its trend higher. As we are approaching the summer season and global agriculture prices continue to soar due to shortages, hog prices could still go a lot higher as the feed mix mainly consists of corn and soybean meals.
Market Views
“There are decades where nothing happens; and there are weeks where decades happen.” – Vladimir Ilyich Lenin
In the past month, EVERYTHING changed. The ramification of the geopolitical tension is both long-lasting and wide-reaching. Once again, we look beyond the news headlines and focus on the fundamentals that will affect the market and our lives for months, if not years, ahead. Here are some questions that we invite our readers to ponder with us together.
What if this is the end of the 40-year secular deflationary trend? As we have witnessed the gigantic moves in many countries’ government bond yields in the past week, we must entertain the possibility that the 40-year secular deflationary trend, in which long-term bond yields dropped lower in every cycle than the previous, is finally broken. Is the new trend going to be a V-shape rebound into secular inflation circa the 1970s, or is it going to be like Japan for the past half a decade where bond yields stuck in a sideway range? Regardless, it will challenge a great number of assumptions in the models, backtests, and valuations in the financial market nowadays. Note that most market participants today have never lived through, not to mention investing in, an inflationary macro regime before.
What if this is the end of globalization? We already saw the first signs of de-globalization when the pandemic hit, and countries scrambled for medical supplies and afterward determined to move back home all the critical manufacturings. With the sanctions imposed on Russia, many countries once again realized just how reliant they are on Russian exports of food, energy, and metals.
What if the food and energy shortage intensifies? This is the most pressing question for many European, African, and Middle Eastern importers. Russia is the biggest energy exporter to Europe; combined with Ukraine, these two countries produced nearly 30% of the world’s traded wheat, which many African and Middle Eastern countries rely on heavily. The Spring planting season in Ukraine is already severely affected. Fertilizer prices are skyrocketing. The food shortage problem may still get worse in the next twelve months. What could ensue in some less developed countries? Social instability and humanitarian crises.
What if countries divest from the US Dollar and Treasuries? Few things are as assuring as the physical gold bars stored in a country’s own treasury as reserves. Observing the economic sanctions on Russia, other countries might start thinking about their potential risks in holding only US Dollar and Treasuries as reserves. After all, Russia got rid of almost all its US Treasury securities before March 2020. It has also been aggressively accumulating Gold since 2014. When foreign demands for the US Dollar and Treasuries wane, what would happen to US assets?
The list could go on, but we genuinely believe these are the things every investor needs to think about carefully. Examine the assumptions and re-think the paths forward because decades have happened in the past weeks.
How to play the theme out
A hypothetical investor can consider the following trades1:
Case Study 1: Short Micro E-mini Russell 2000 Index Future
If the investor were to short the Micro E-mini Russell 2000 Index future (M2KM2) at 2075 and set the stop above 2170, his maximum loss per contract would be (2170 – 2075) x 5 = 475 USD. An initial target points to 1900 and subsequently 1600, resulting in (2075 – 1900) x 5 = 875 USD and (2075 – 1600) x 5 = 2375 USD.
Case Study 2: Long Lean Hog Future
If the investor were to long the Lean Hog future (HEM2) at around 125 and set the stop below 115, his maximum loss per contract would be (125 – 115) x 400 = 4000 USD. An initial target points to 135 and subsequently 145, resulting in (135 – 125) x 400 = 4000 USD and (145 – 125) x 400= 8000 USD.
The Rearview Mirror
A look into history could help us position ourselves better for the future. This section provides a rundown of market moves across major asset classes between January and March.
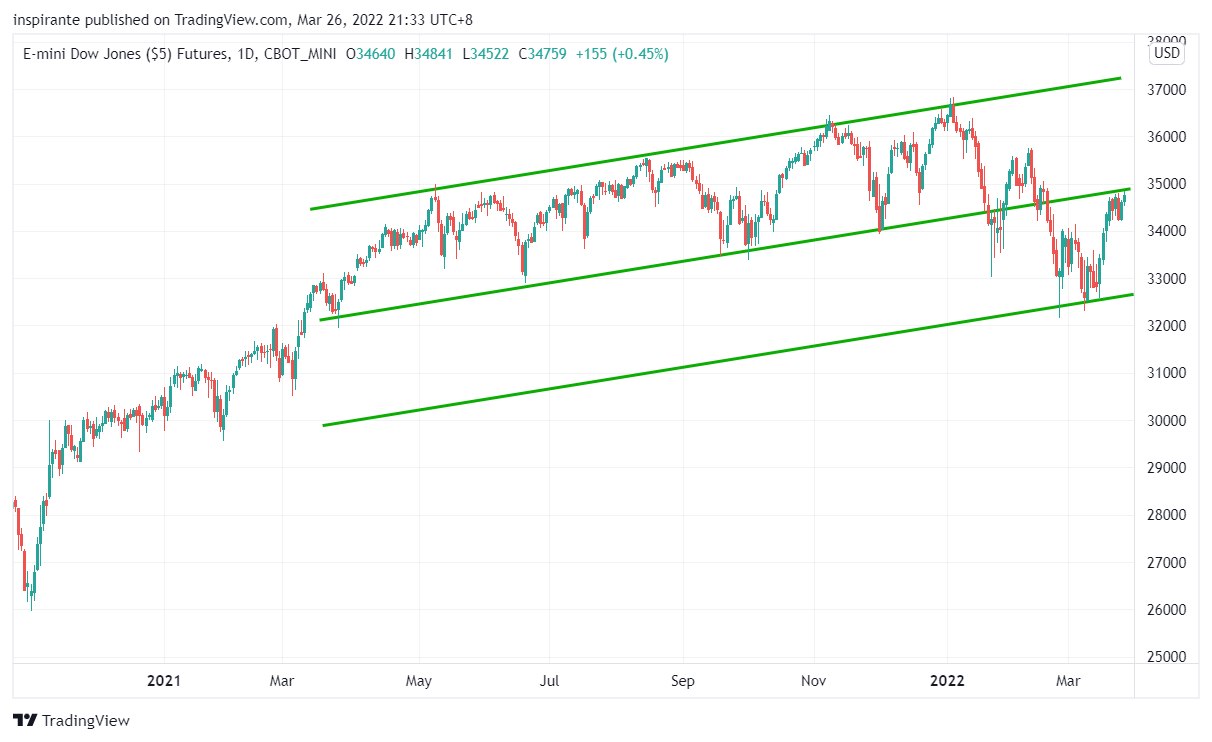
After breaking its twelve-month uptrend channel, the Dow dropped further to 32000 level and then sharply rebounded. 35000 has turned into resistance now. Although the selloff missed our downside target of 31000 discussed in the January 28th Edition, we still hold a bearish view of the US equities.
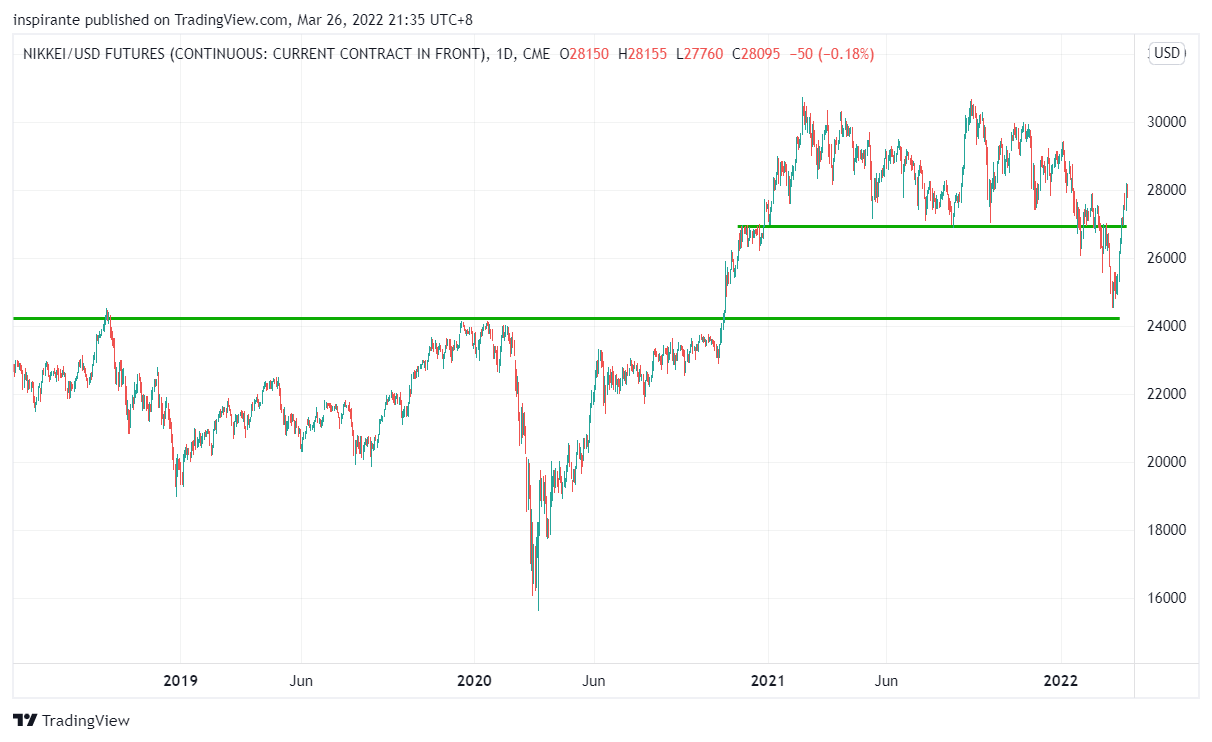
Nikkei’s selloff was sharply reversed near the 24000 level, which has been a multi-year resistance and has now turned into support. The accelerated weakening of the Japanese Yen, as shown in Figure 4, meaningfully helped the recovery of the Nikkei index.

In the March 16th Edition, we discussed shorting the S&P 500 vs. Nikkei 225 ratio by selling E-mini S&P 500 index future at 4200 and buying Nikkei 225 USD future at 25000, at an implied ratio of 0.168. The ratio has dropped to 0.16 now as the Nikkei outperformed the S&P 500. We expect the relative outperformance of Nikkei 225 to continue.

When we zoom out to see the big picture of the US Dollar Index on a longer timeframe, we find it trading in a relatively tight range (between 90 to 105) for the past seven years. We monitor it closely to see if it will continue to oscillate within the range or break out to a new regime like it did in 2015.
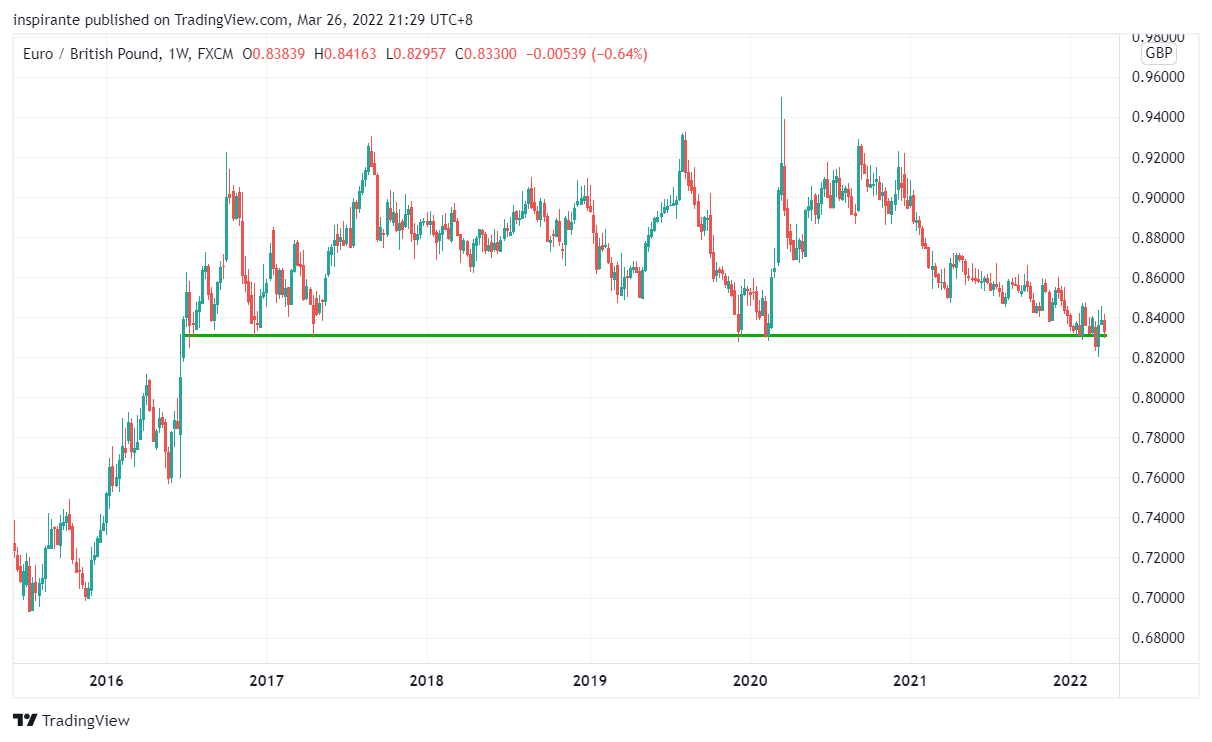
The Euro/Pound pair is still trading near its six-year support at 0.83. There is no clear direction yet as it is heavily affected by the outcome of the Russian-Ukraine War, especially so for the Euro currency.

We first discussed the idea of long Brazillian Real against the US Dollar in the January 14th Edition, when the pair was still trading at 0.18. It is now at 0.21. It does not show any sign of slowing down yet after breaking out from the two-year triangle bottom. That is a solid 16% move in just three months.
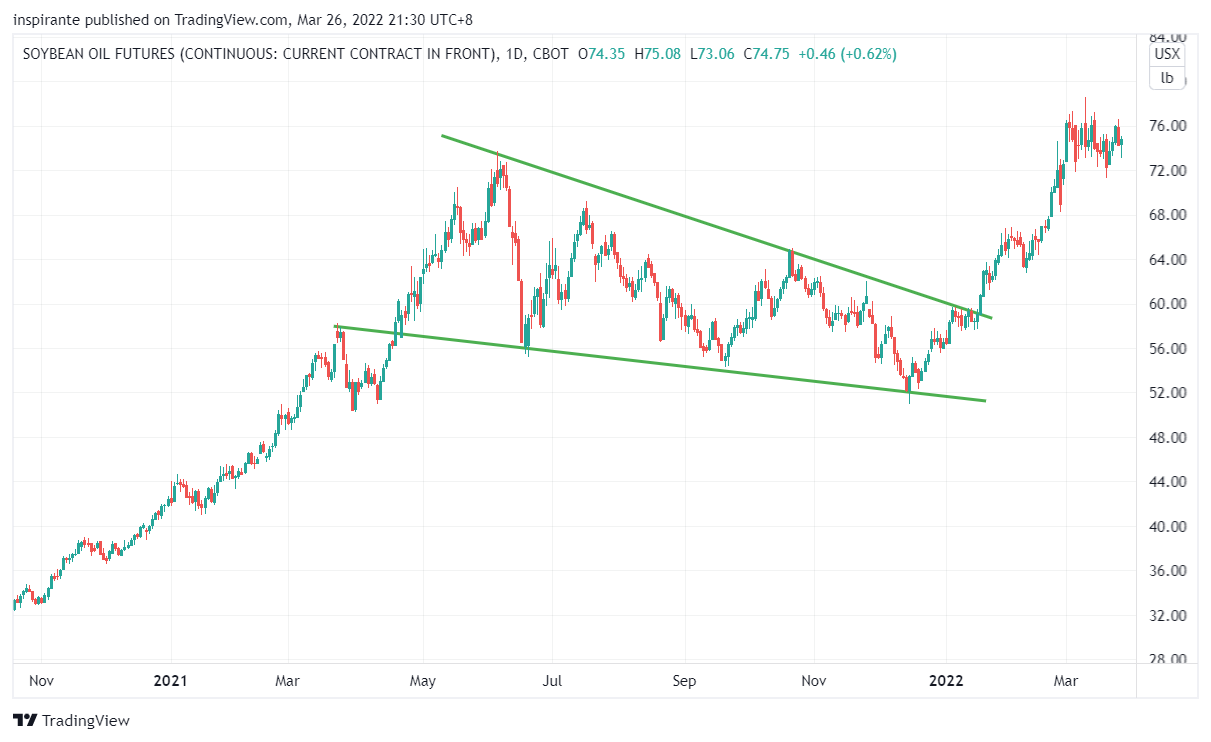
Similarly, in the January 14th Edition, we turned very bullish on Soybean Oil at 59 after seeing how much the Palm Oil had already rallied back then. Soybean Oil is currently trading near 76. The 28% move has undoubtedly put this among the top case study ideas of the past quarter.
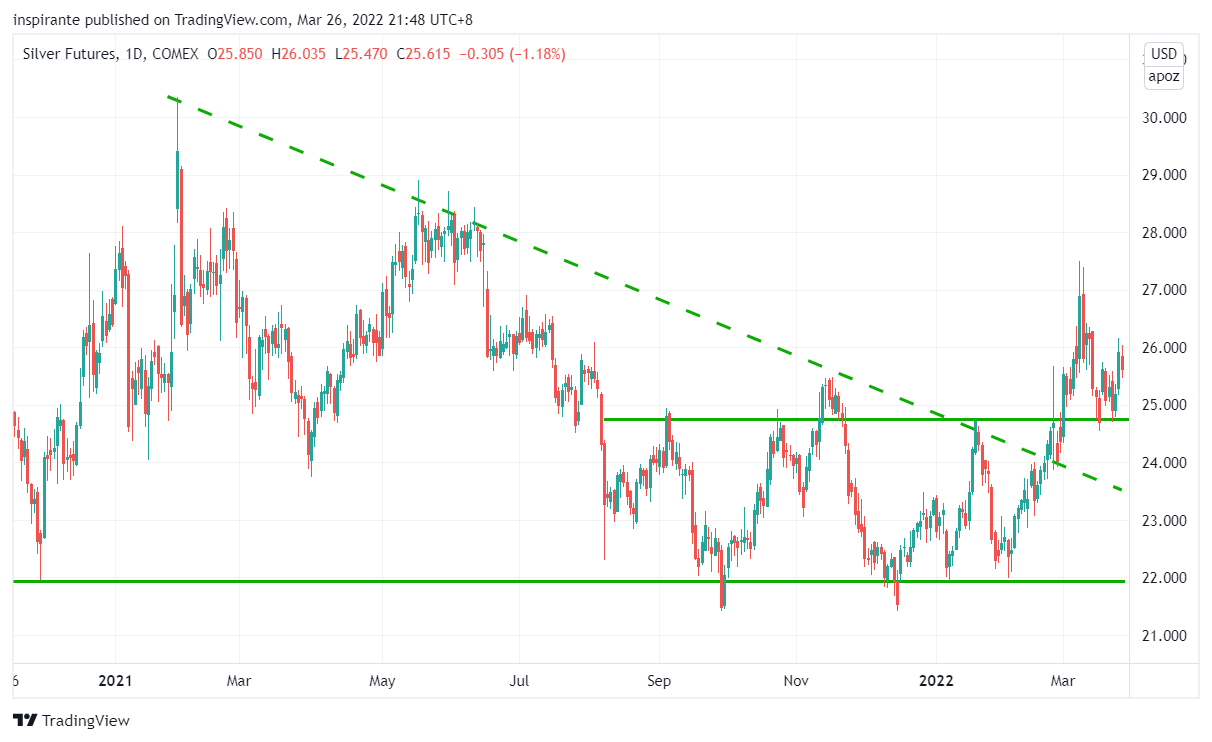
Silver is still trying to find its feet above 25 after being stuck in a descending triangle for nearly two years. Like many other “real-stuff” commodities, we still believe Silver is in a bull phase as the potential rotation happens from tech stocks into energy, food, and metals.
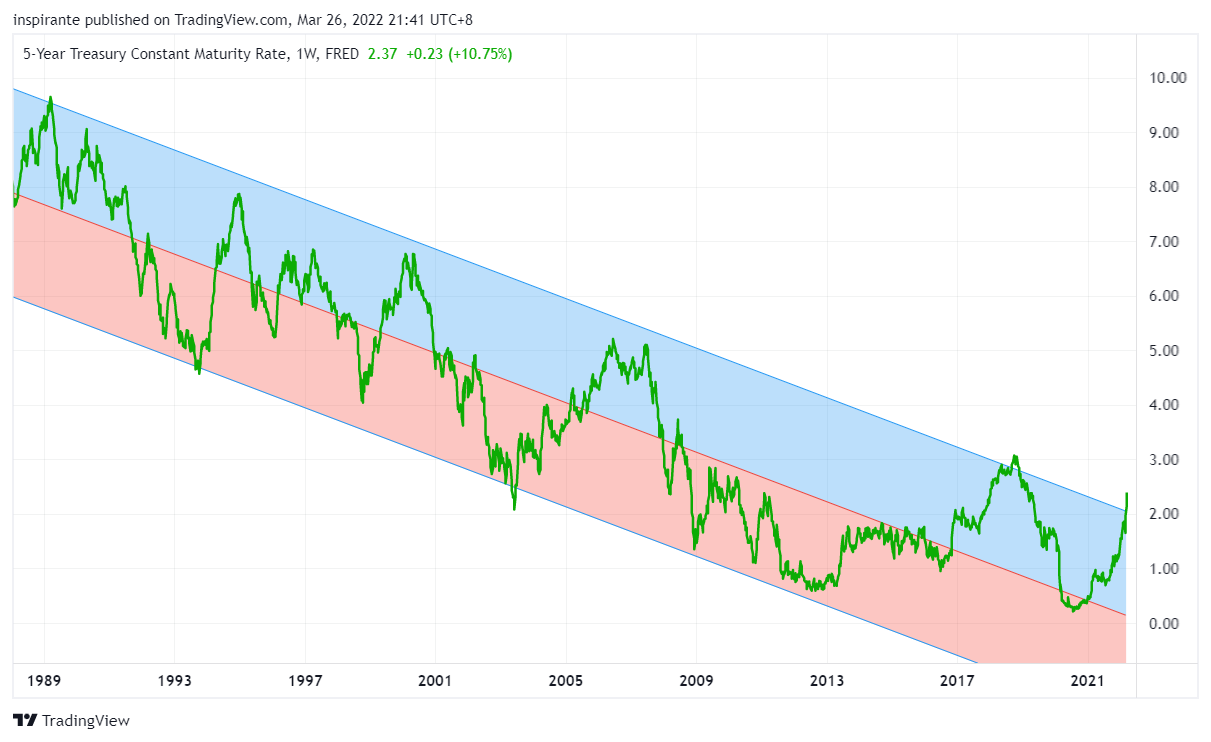
The US 5-year yield continued to climb higher and did not stop at the 2% level at the top of the channel. We do not know how far this can go, but we believe a correction is more likely than not, similar to the 10-year yield shown in Figure 1.
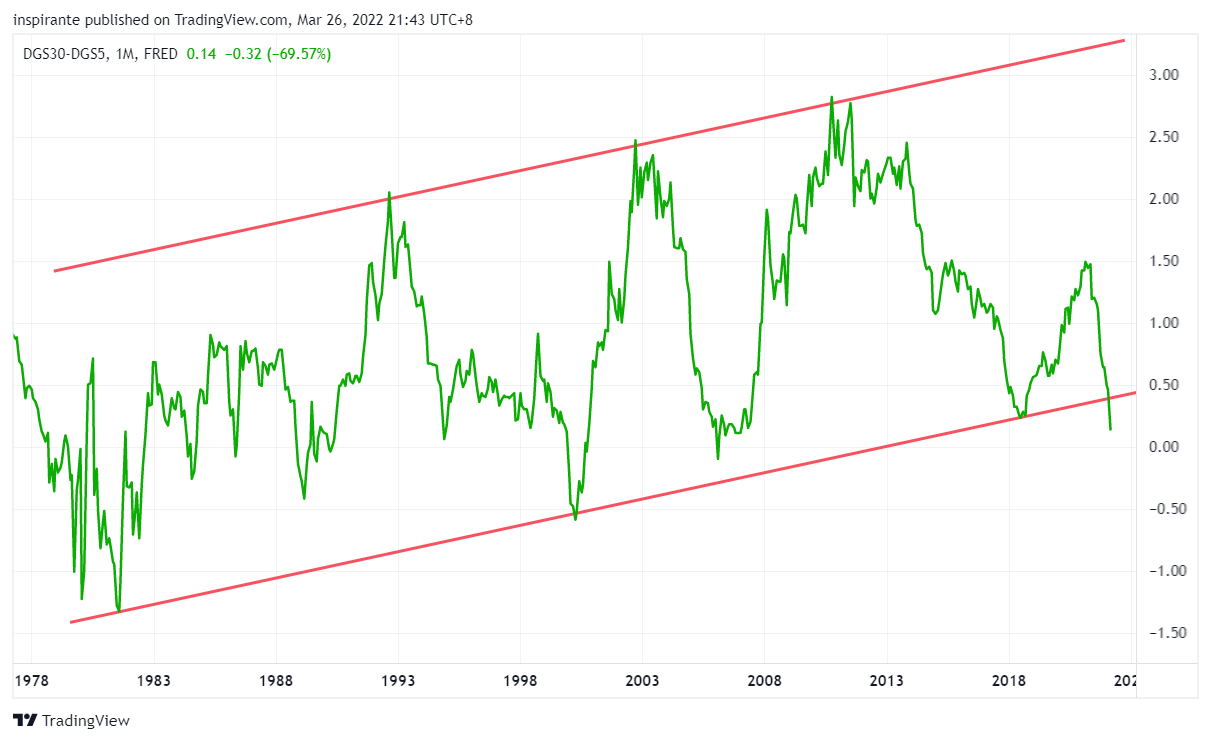
The rapid increase in the US 5-year yield has caused the yield curve to flatten further. The 5s30s spread has broken its 40-year channel and is eerily close to inversion. The bond market is certainly not printing a rosy picture of the economy ahead.
Original Link: https://www.cmegroup.com/newsletters/fresh-from-the-trading-room/files/fresh-from-the-trading-room-2022-03-30.pdf
Examples cited above are for illustration only and shall not be construed as investment recommendations or advice. They serve as an integral part of a case study to demonstrate fundamental concepts in risk management under given market scenarios.
 | A guest post by
|