
A turn in the tide?


Flipping through the markets

Has the tide turned? This question will shape our perspective on inflation going forward. By comparing inflation trends in Asian economies (thin line) versus the West (line with markers), we can make several observations. None of the Asian economies experienced inflation as high as the West. All of the Asian economies have passed their peaks and are trending downward. Inflation in the rest of the Asia (except Singapore & India) is slightly lower than in the West. But where will inflation head next? Only time will tell.
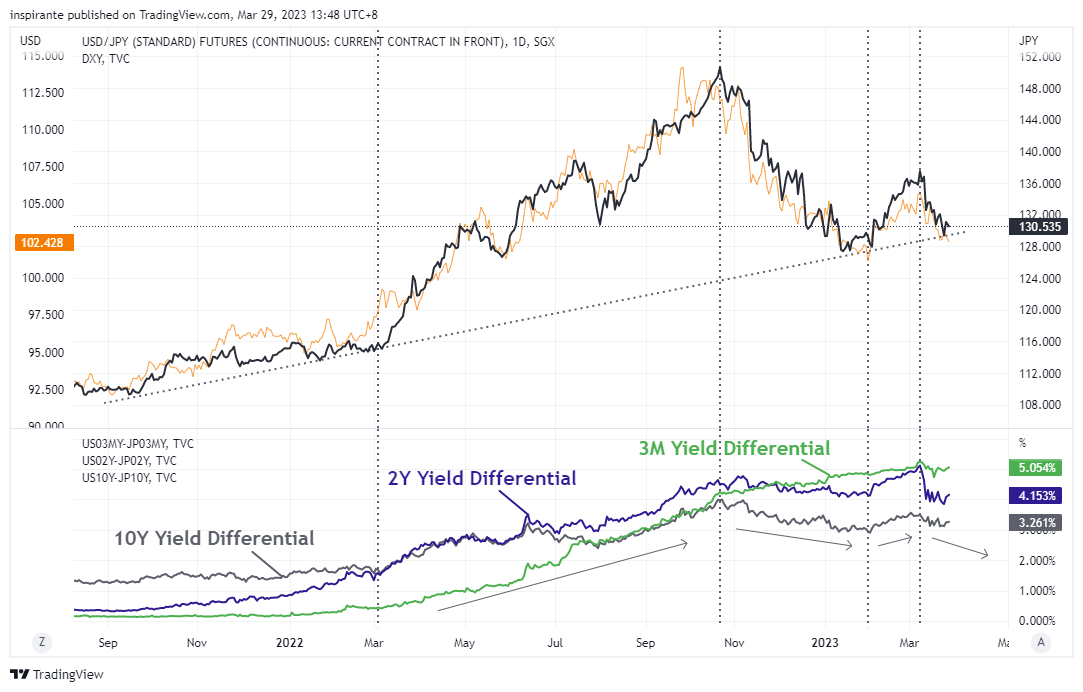
The USDJPY trade can be broken down into clear regimes by analyzing the yield differential between US and Japanese yields. A widening yield differential typically increases demand for the dollar, pushing USDJPY higher. Conversely, a narrowing yield differential tends to weaken demand for the dollar, causing USDJPY to trade lower. Are yield differentials heading lower?
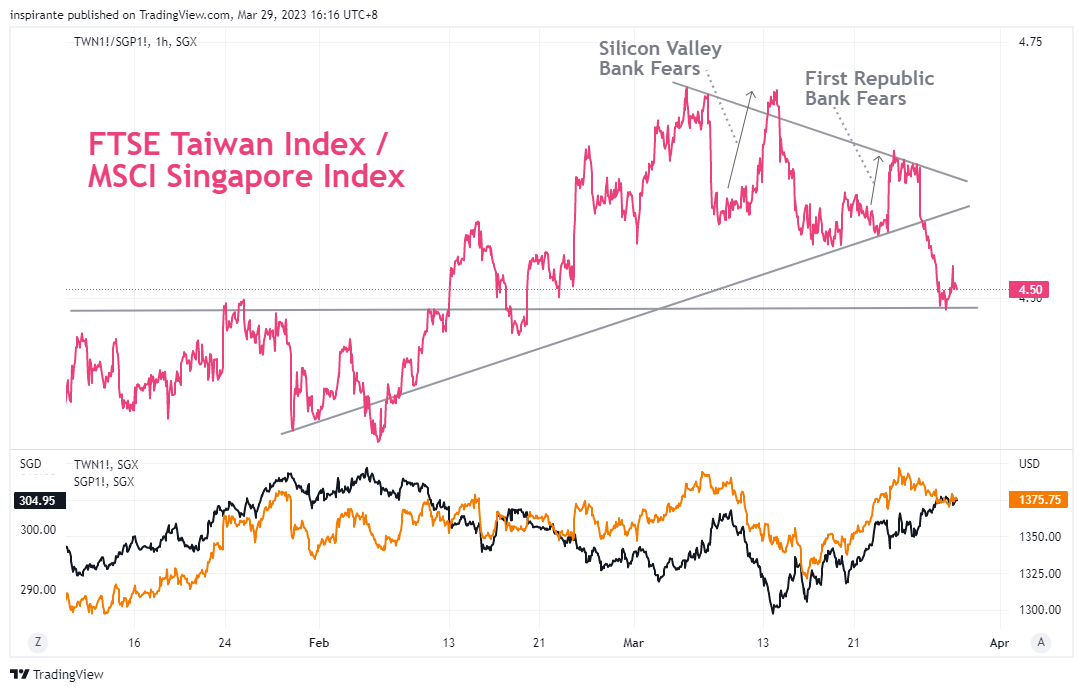
As traders switch themes between Financials and Tech/Chips, the FTSE Taiwan and MSCI Singapore Index Futures, have seen its fair share of volatatility over the past month. With bank contagion fears escalating, the heavily financials-weighted MSCI Singapore Index sold off, causing the FTSE Taiwan/MSCI Singapore ratio to soar. Twice.
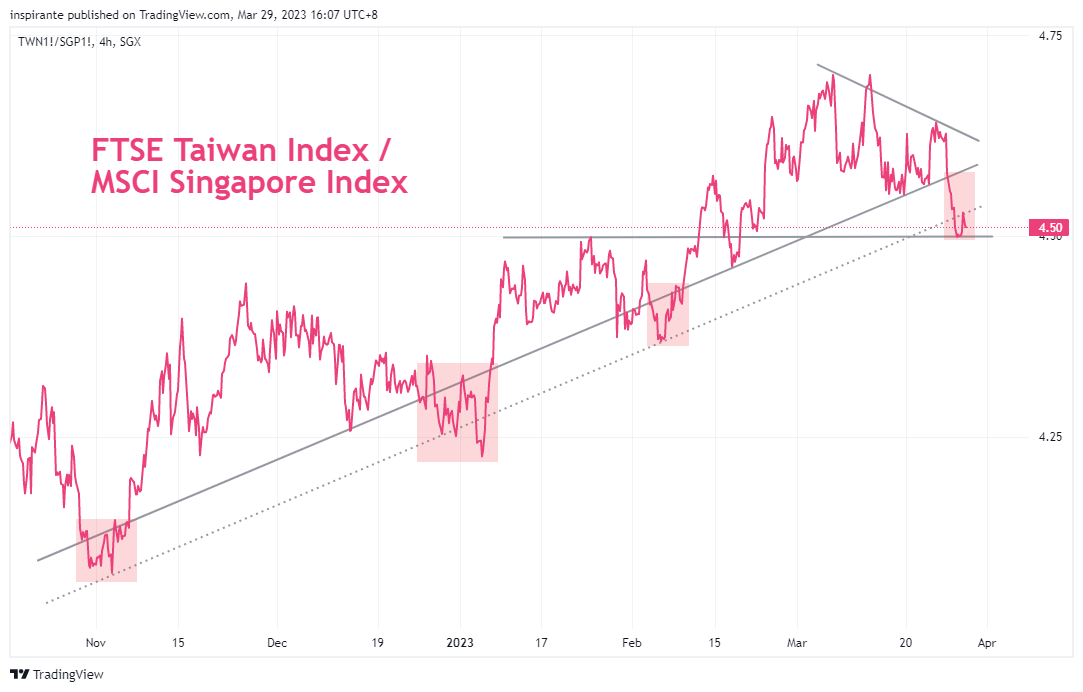
Taking a broader perspective, the FTSE Taiwan/MSCI Singapore ratio has been trending upwards. Although the ratio has retreated from its recent highs as contagion risk abates, it now hovers at a key level. Notably, the ratio has repeatedly rejected previous breaks lower, and we are thus skeptical whether the current move lower is any different.
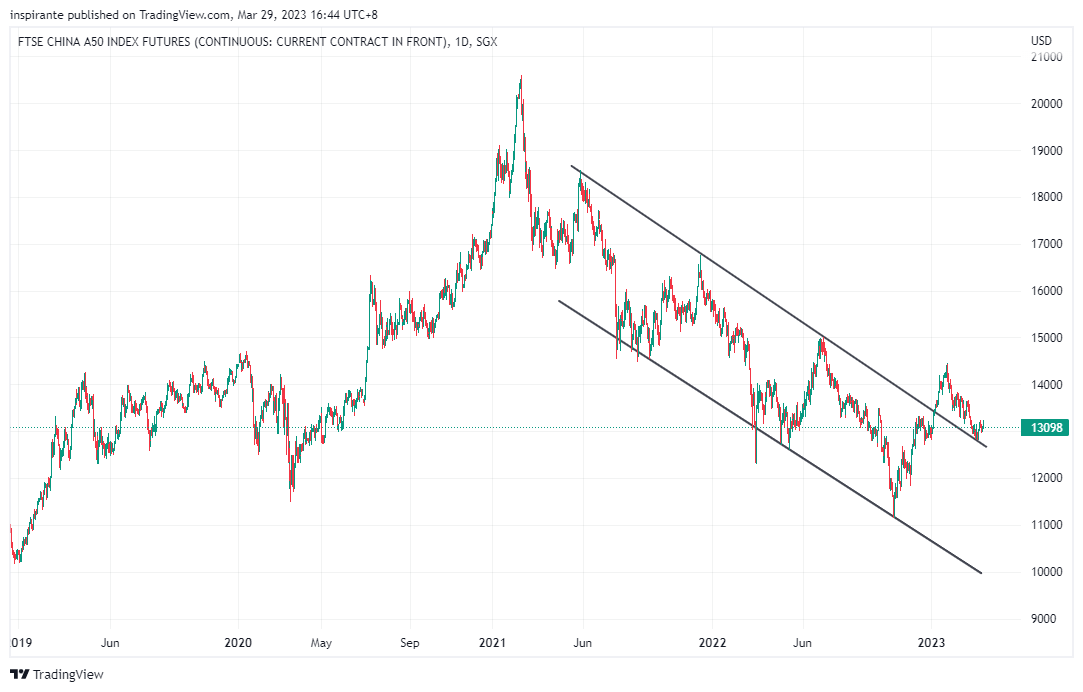
The break out in FTSE China A50 which we highlighted in January turned out to be a false break. After trading sideways for a while, the index is now testing the prior downtrend’s channel upper band. We will be closely monitoring this crucial level of support to determine whether it holds and the index can make a sustained upward move.
What’s inside our playbook?
What a whirlwind of a month! A very hawkish FOMC, a banking crisis and now a market expecting 50 to 100 basis point of cuts this year.
It’s easy to be clouded by the headlines, so we want to put things in context here. As we’ve pointed out in the Figure 1, while we see some signs that inflation may have peaked, recent events like the uptick in inflation in the UK serve as a timely reminder not to be overly optimistic. What’s interesting to us now is the massive rate cuts priced into the fed fund rates in the year ahead, which we will take with a pinch of salt for now. The inflation battle is still far from over as the current inflation levels across the western world is still way off the 2% target.
But that’s for the Western economy. Asian economies seem to deal better with inflation as evidenced from the general divergence in inflation. Which brings us to the USDJPY pair that we're closely monitoring. One way we're looking at this trade is through the lens of yield differential. Get the path of the yields in the US and Japan and the currency will follow. With Japan still dead set on it’s current yield cap, while cuts are expected from the Fed, the yield divergence might continue to close, leading the USDJPY potentially lower. As mentioned in last months note, a ‘shock’ factor that may still be on the cards is the action of the new central bank governor. If anything, his actions are likely to shock yield higher, instead of the artificial floor it is trading at now. This could very well play into the further closing of the yield differential, driving the USDJPY higher.
With the risk of a banking crisis inundating headlines over the past month, what has come to our attention is the ratio of the FTSE Taiwan Index to MSCI Singapore Index as traders switch themes between banking fear and no fear. As seen in Figure 3 the ratio spiked significantly on bank failure news twice, as two US regional banks struggles. Although panic seems to be under control for now, another bank struggle hitting the news could be the catalyst for the ratio to spike higher. Regardless, even if this scenario does not play out, we think the current low, testing the support, is only but a small blip down on its trend higher. Additionally, the financial-heavy MSCI Singapore might suffer on interest sensitivity, driving the index lower in the face of a potentially lower rate environment. Yet another factor to drive the ratio higher.
Executing the plays
A hypothetical investor can consider the following two trades1:
Case Study 1: Long FTSE Taiwan Index Futures (TWN), Short MSCI Singapore Index Futures (SGP)
We would setting up a spread trade by taking a long position on one FTSE Taiwan Index Futures (TWN) at the present level of 1383 and a short position on two MSCI Singapore Index Futures (SGP) at the present level of 306, which should give us a ratio entry level of 4.52. To match the notional value of both contract, a 1 (TWN) : 2 (SGP) ratio is used in sizing the trade. Setting the stop at 4.4 and the take profit at 4.75 could bring us a hypothetical maximum loss of 0.12 points and profit of 0.23. Each 0.25 point move in the TWN contract is 10 USD while a 1 point move in SGP is 100 SGD.
Case Study 2: Short USDJPY FX Futures (UY)
We would consider taking a short position on the SGX USDJPY FX Futures (UY) at the current level of 131.3. If the yield differential tightens, the pair has the potential to reach, 123, a previous level of resistance. Taking a 3:1 risk reward ratio, a reasonable stop can be set 134 points above at 2.7. Each 0.005 move in the UY contract is 500 JPY.
Original Link: https://www.sgx.com/research-education/market-updates/20230331-sgx-traders-playbook-turn-tide
Examples cited above are for illustration only and shall not be construed as investment recommendations or advice. They serve as an integral part of a case study to demonstrate fundamental concepts in risk management under given market scenarios.
 | A guest post by
|