
A turn of the tides
A turn of the tides
Written on 2023-06-17, first published on 2023-06-20


Markets in focus
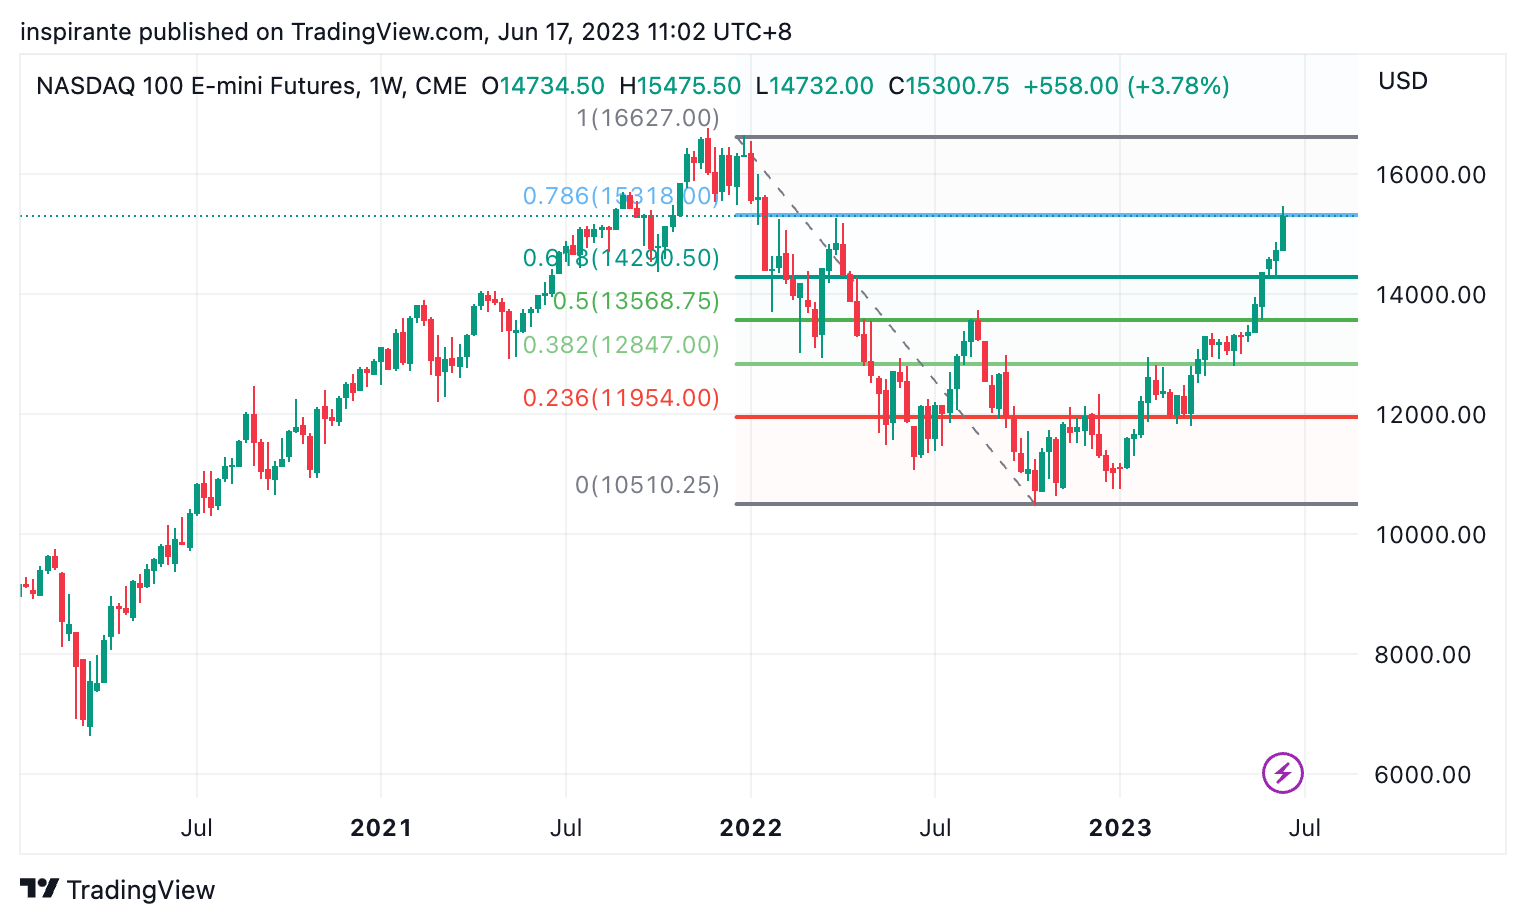
The Nasdaq has been on fire lately as the widely anticipated “Fed Pause” finally came. It has reached the 78.6% Fibonacci retracement level of the entire 2022 drop.
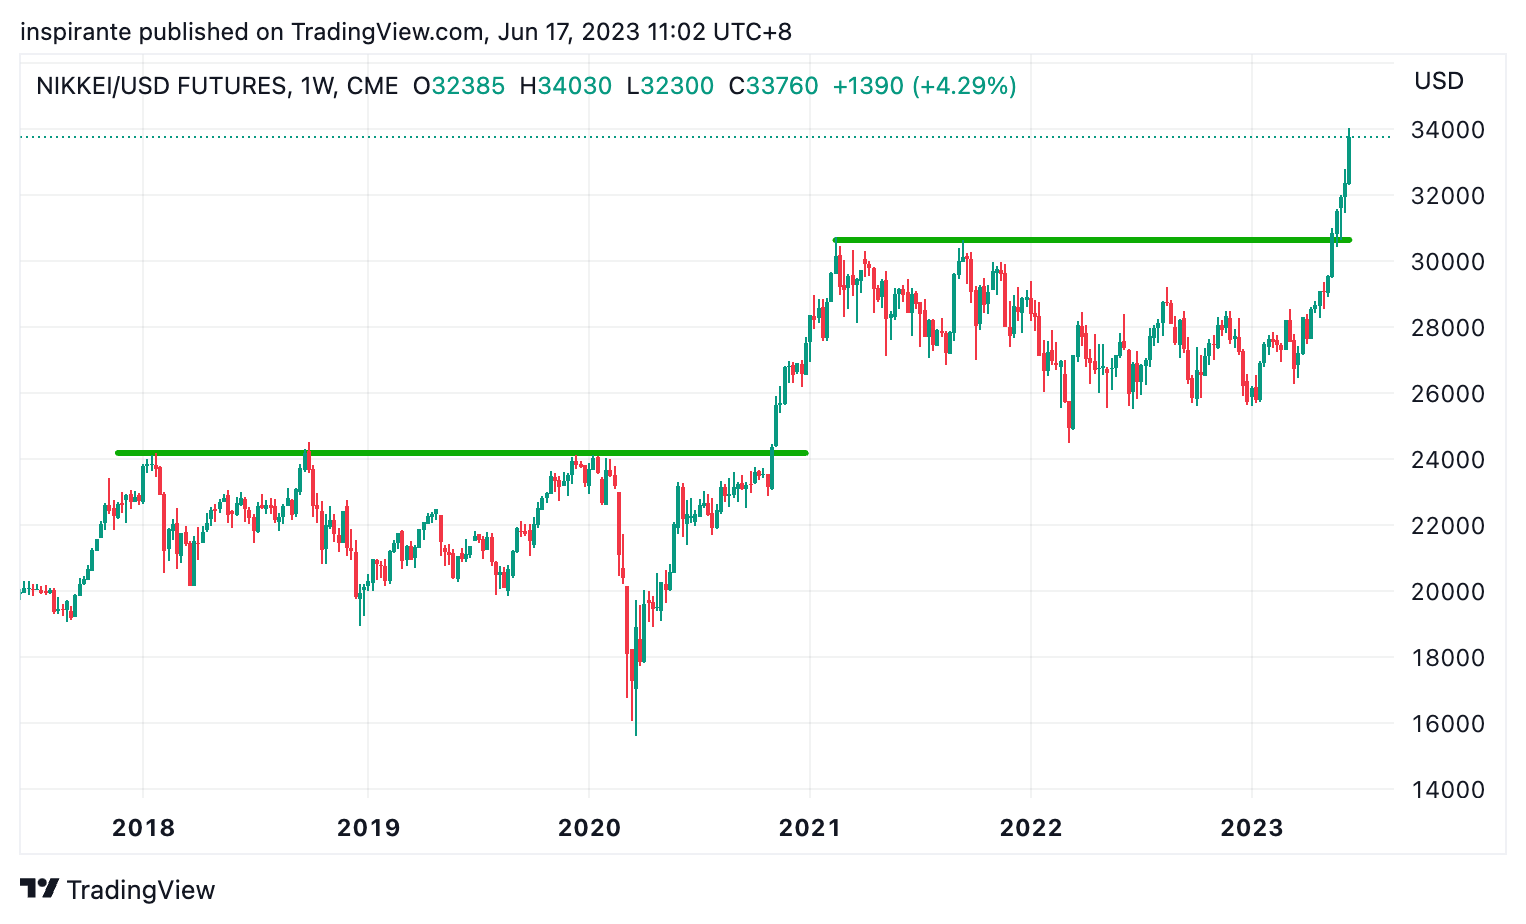
After breaking through 31000 resistance, Nikkei also went parabolic as foreign investors piled into Japanese equities. Japan remains one of the last nations yet to implement tightener monetary policies.
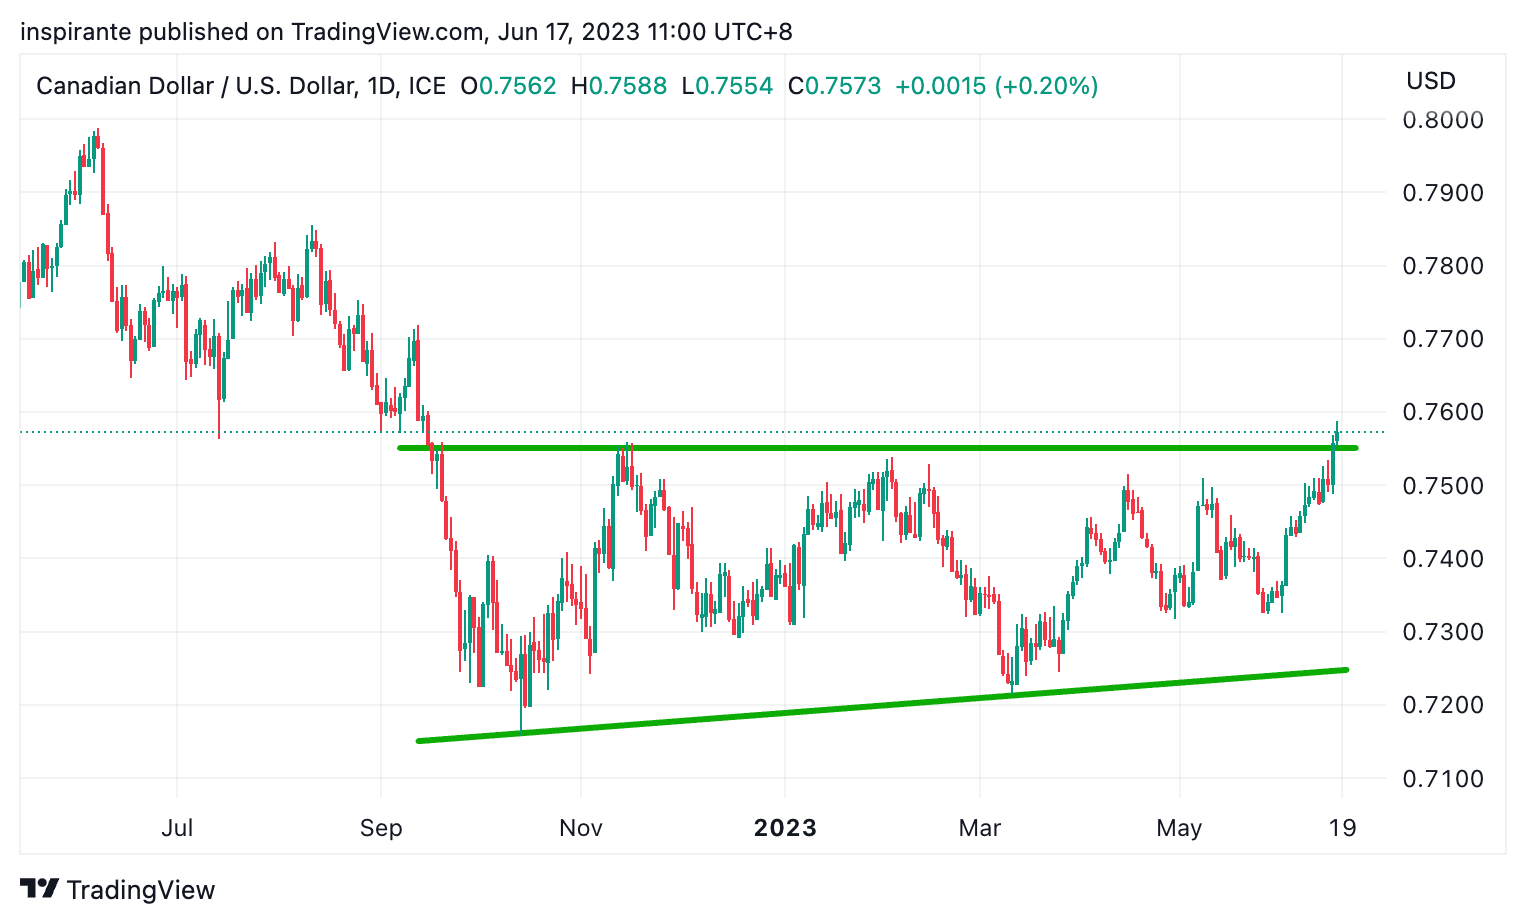
The Canadian dollar has broken out from a ten-month ascending triangle. The Bank of Canada’s unexpected rate hike, following a five-month pause, coupled with the Fed’s decision to pause, has contributed to the Loonie’s strength against the greenback.
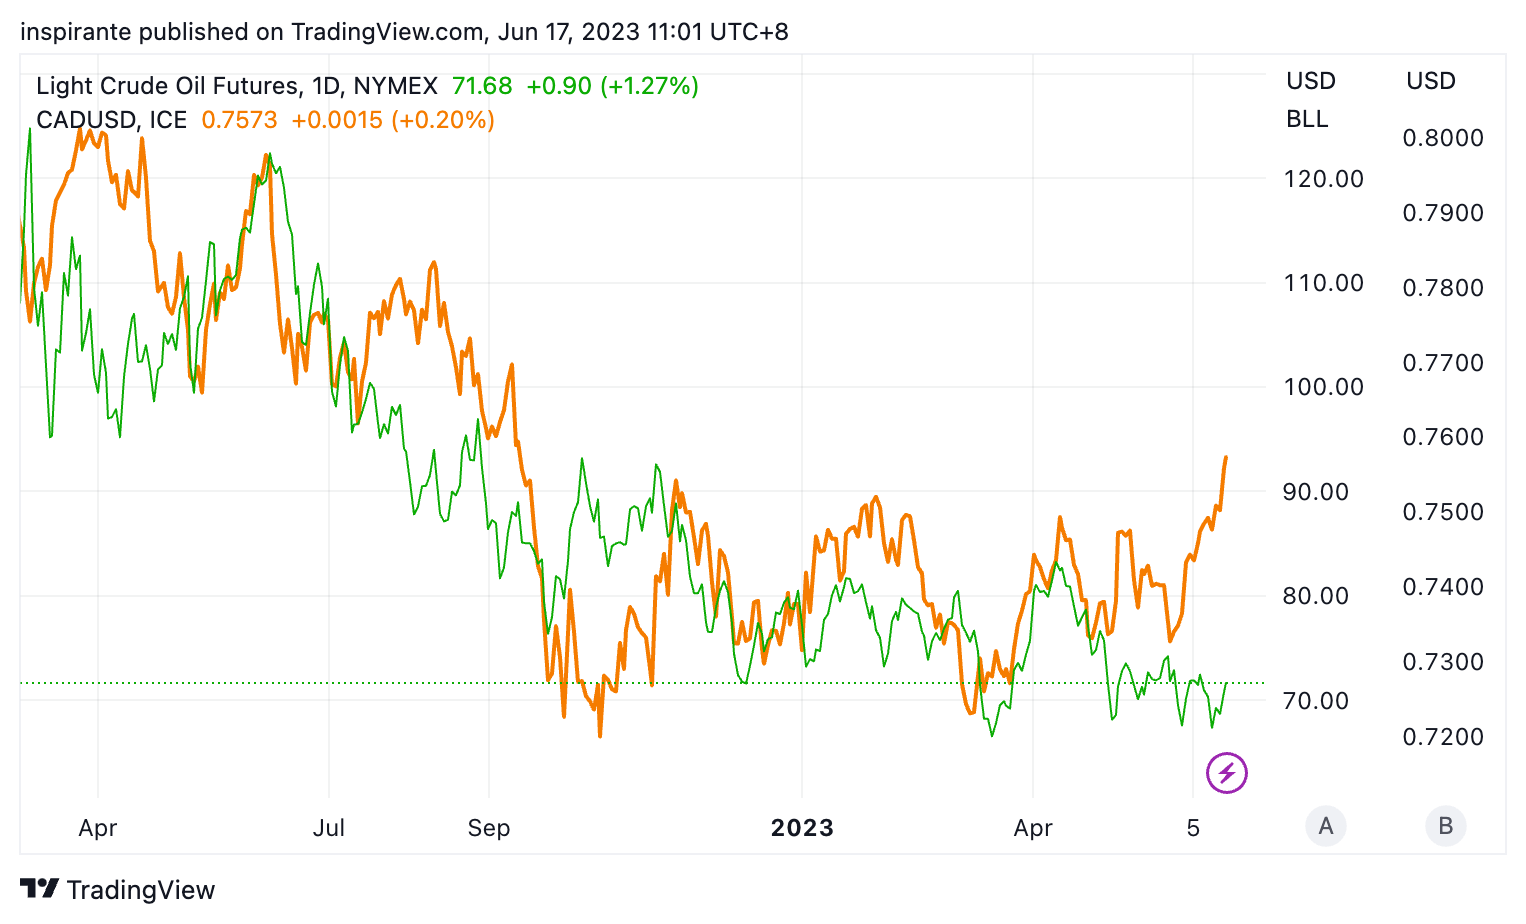
The Canadian dollar, typically well-correlated with crude oil given Canada’s significant oil exports, has been outperforming the commodity in recent months. This temporary divergence may foreshadow a potential rebound in crude oil prices.
Our market views
We’ve cast a wary eye on the prevailing market consensus in our previous commentary. We cautioned against the peril of allowing narratives, rather than genuine price actions, to drive our investing and trading decisions. We even ventured to position on the long side of US equities, running against the mainstream tide of recession-sparked bearish sentiment. Since our May 24 report, the S&P 500 cracked the tough resistance at around 4200 and launched a solid rally to above 4400. Even the Nikkei defied the odds, reaching its highest in over three decades. With the Fed hitting pause and the new BoJ governor staying on the sidelines, some investors are now entertaining the idea that a new bull market may be underway. So, where’s that recession again?
But let’s be clear – we’re not bringing this up to pat ourselves on the back. On the contrary, we want to again alert our readers about the recent narrative shift and the evolving consensus. In our view, the strong performance of US equities doesn’t necessarily flash a green light. Many gears in motion fueled the rally, and many of these components are set to change in the coming days and weeks. Take the US Treasury’s announcement to refill the Treasury General Account, which drained during the recent debt ceiling standoff. The scale is about $400 billion by end-June, potentially leading to a significant market liquidity pull, depending on the replenishment mechanics and cash sources. From a technical viewpoint, we also can’t dismiss the potential for a bull trap right now. Remember the Dotcom bubble? Post the initial drop in 2000, the Nasdaq rallied 42%, only to crash another 75% in 2001 when the bubble burst.
Meanwhile, the commodity market appears much less upbeat than equities. Look at crude oil – it’s been pricing in a global recession and weak demand (especially from China) for a good while. WTI has been oscillating between $64 and $84 since late last year. But, notably, the lower band of this range remains a strong support even amid peak bearish sentiment in the energy market. With the Fed in pause mode, we’re seeing early signs of commodity-centric currencies (such as the Canadian dollar and the Mexican Peso) taking the lead in strengthening against the US dollar. With crude oil now back near the lower range support, it indeed presents an asymmetrical opportunity – the kind we always strive to find in the market.
How do we express our views?
We consider expressing our views via the following hypothetical trades1:
Case study 1: short Micro E-mini Nasdaq 100 Index future
We would consider taking a short position on the micro E-mini Nasdaq 100 index future (MNQU3) at the present level of 15300, with a stop-loss above 16100, which could bring us a hypothetical maximum loss of 800 points. Looking at Figure 1, if the recent rally halts and reversal happens, the index has the potential to drop to 11000, a hypothetical gain of 4300 points. Each point move in the micro E-mini Nasdaq 100 index future contract is USD 2.
Case study 2: long Micro WTI Crude Oil future
We would consider taking a long position on the micro WTI Crude Oil future (MCLQ3) at the present level of 71.7, with a stop-loss below 66, which could bring us a hypothetical maximum loss of 5.7 points. Looking at Figure 4, if the rebound continues, the oil price has the potential to reach 85, a hypothetical gain of 13.3 points. A micro WTI Crude Oil future contract represents 100 barrels of oil. Each point move is USD 100.
Original Link: https://www.cmegroup.com/newsletters/fresh-from-the-trading-room/2023-06-21.html
EXAMPLES CITED ABOVE ARE FOR ILLUSTRATION ONLY AND SHALL NOT BE CONSTRUED AS INVESTMENT RECOMMENDATIONS OR ADVICE. THEY SERVE AS AN INTEGRAL PART OF A CASE STUDY TO DEMONSTRATE FUNDAMENTAL CONCEPTS IN RISK MANAGEMENT UNDER GIVEN MARKET SCENARIOS. PLEASE REFER TO FULL DISCLAIMERS AT THE END OF THE COMMENTARY.
 | A guest post by
|