
Between consensus and canaries
Between consensus and canaries
Written on 2023-05-19, first published on 2023-05-24


Markets in focus
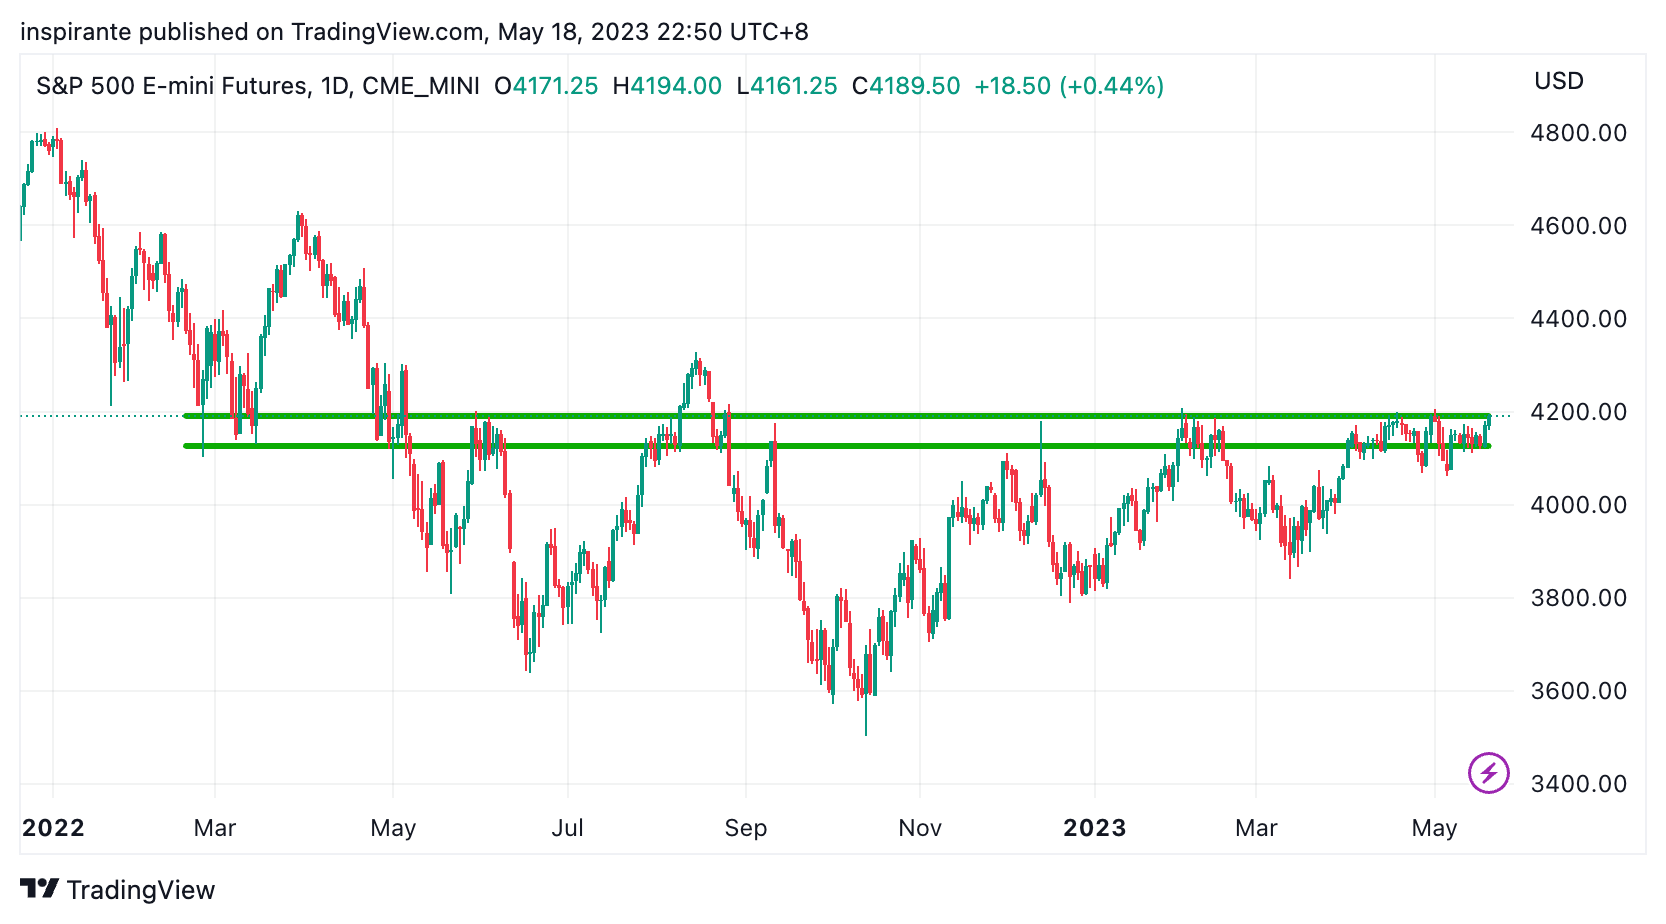
The S&P 500 has been in an unusually narrow trading range for around two months, and arguably forming a rounding bottom. From a technical perspective, the longer it lingers, the greater the potential for a potent breakout.

Nikkei 225 also went sideways in a tight range for a year but recently broke through the upper resistance, with the move characterized by both speed and scale. It's now hitting a three-decade high.
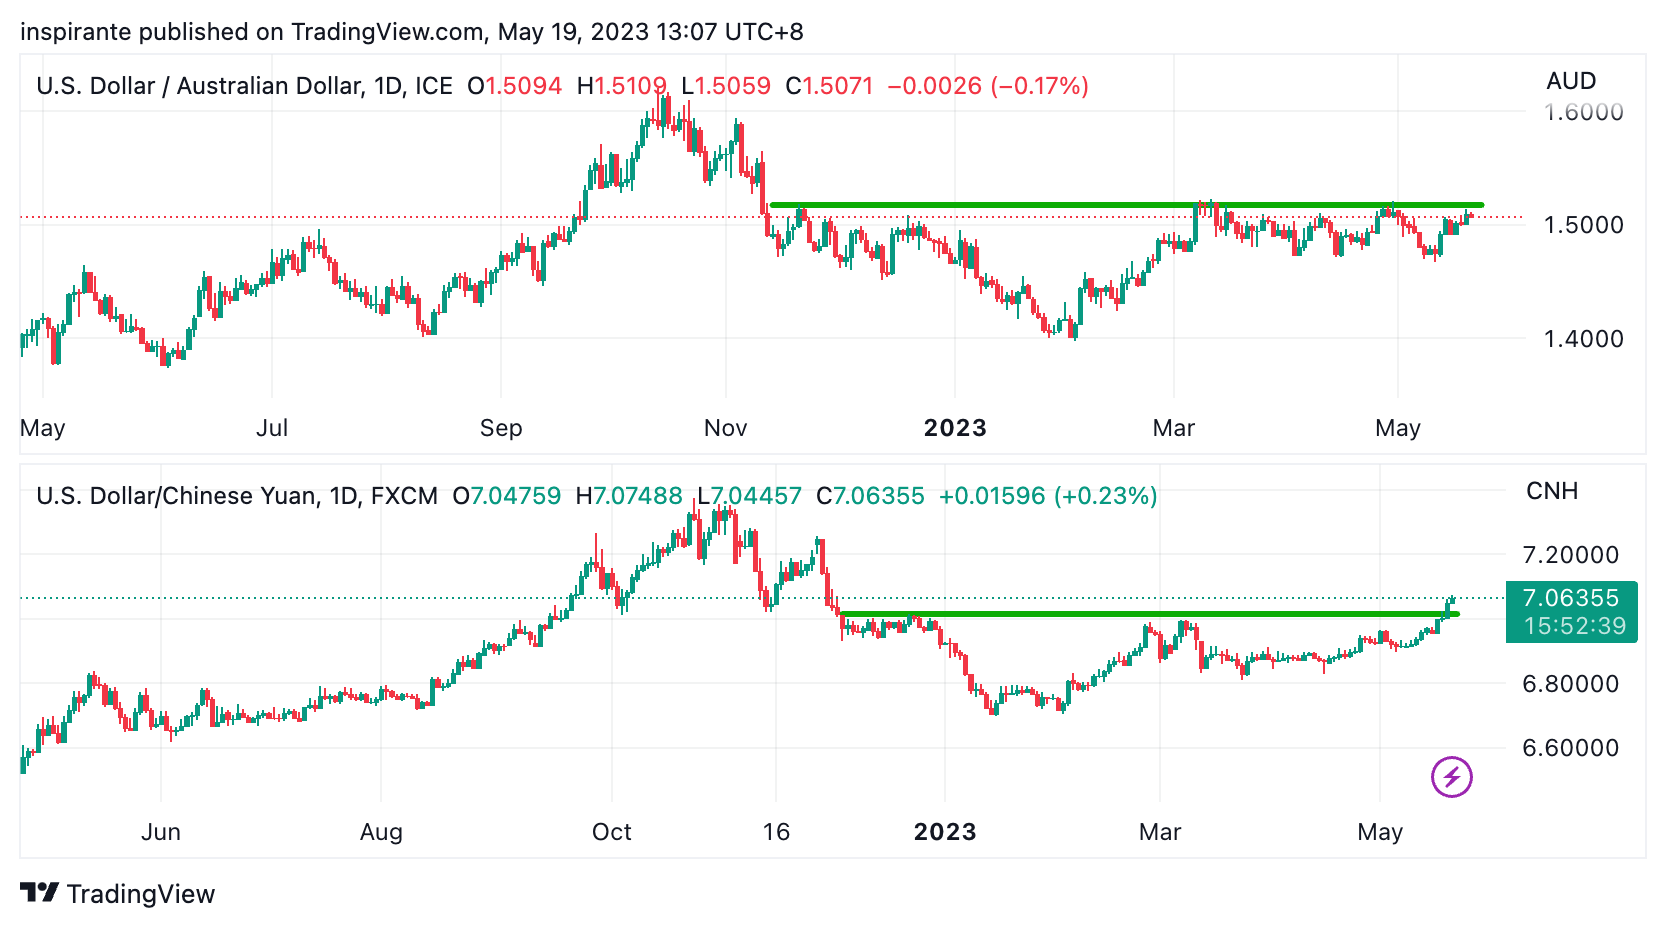
The moves of AUD and CNH are highly correlated. Lately as the US dollar strengthens, CNH/USD was among the first to break an important support (in USD/CNH terms, the psychologically important resistance at 7). Could the Aussie dollar be next?
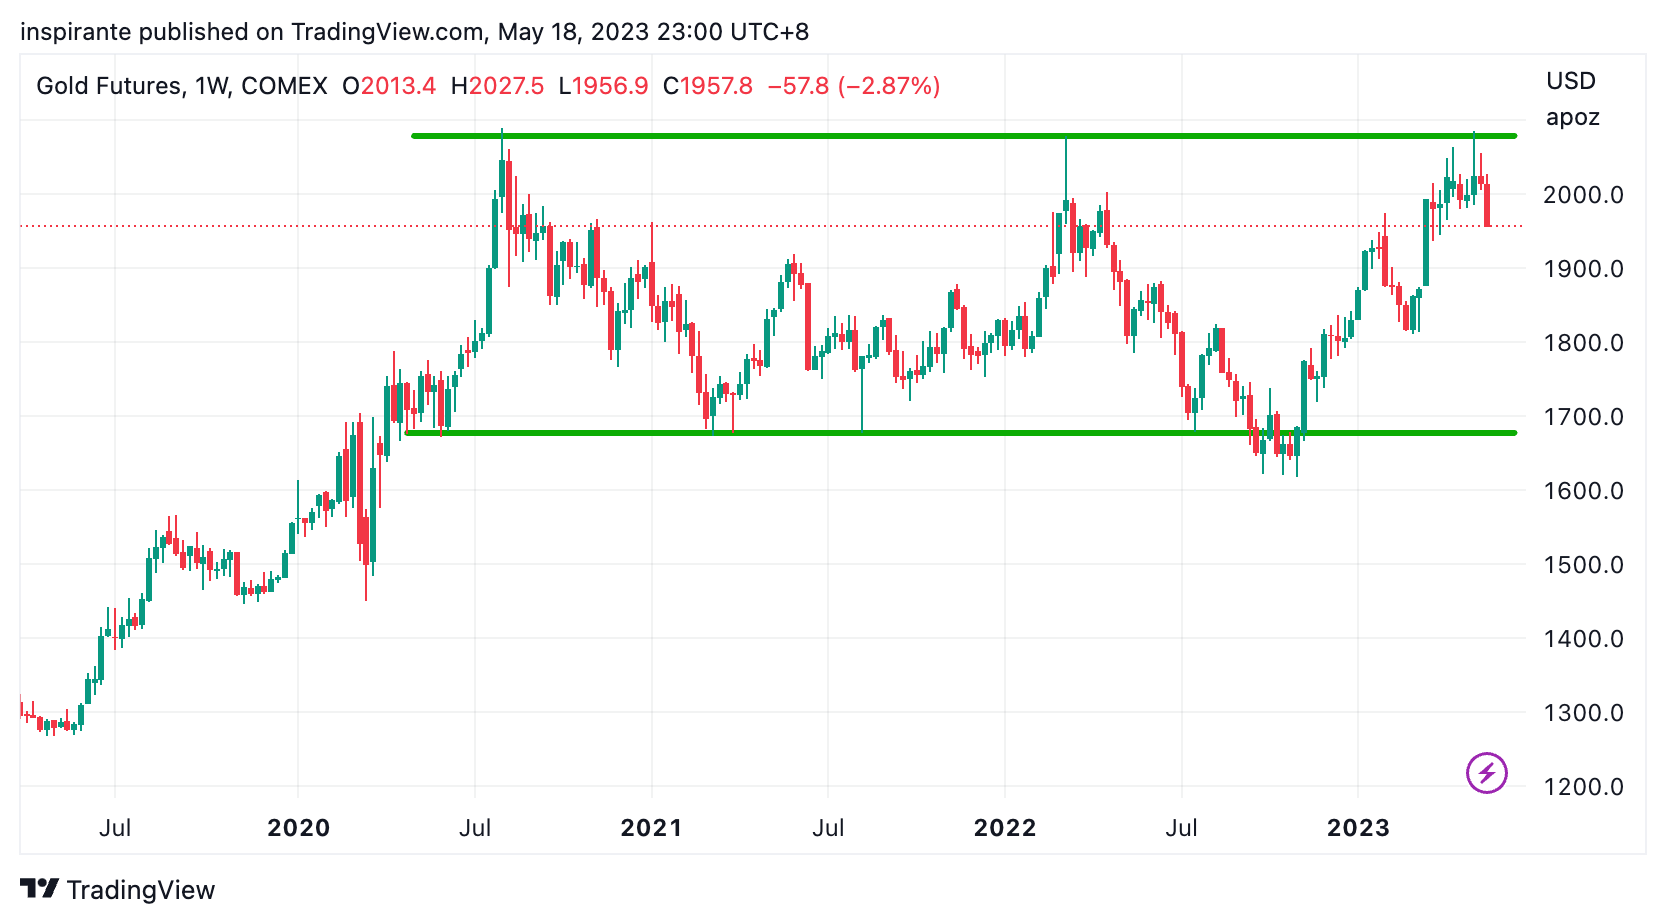
With the strengthening of the US dollar, gold was rejected hard near 2100 once again. A triple top is a very rare pattern in technical analysis. However, it’s still too early to call for a major reversal.
Our market views
In the current market landscape, we find ourselves in a precarious position. On the one hand, we have an array of macroeconomic indicators implying a rapid cooling of the economy. Moreover, trading luminary, Stan Druckenmiller, has publically stated his belief that the US economy is teetering on the edge of recession, with a “hard landing” as his base-case scenario in the near future. On the other hand, the recession has become such a widely held consensus that we are increasingly concerned about the possibility of significant reversals in the event of unexpected outcomes due to skewed market positioning and perspectives.
Last week we observed a notable rebound of the US dollar at the year-long support level near 101. This was accompanied by the rejection of gold prices below 2100 for the third time since 2020. The strengthening dollar and prevailing recession fears led to the downfall of several commodities, such as grains and edible oils, breaching their respective support lines. In light of these events, it seems remarkable that US equities have maintained an incredibly compressed range for over a month.
In such times, we seek “canaries in the coal mine,” indicators that could hint at the potential future direction of the market, even if it appears to run counter to popular consensus. Consider the upbeat performance of Japanese and European equities, both trading at multi-decade highs amidst widespread recession fears around the global economy. This divergence suggests that despite the prevailing bearish narrative, investors should remain alert to the danger of groupthink and one-sided market positioning. After all, if US equities finally break out upwards from the current tight range, the market’s reaction – driven by short-covering and FOMO (fear of missing out) – could be quite striking.
Another potential indicator is the USD/CNH pair, which has rallied significantly above 7 as Chinese economic data suggests that the re-opening may not meet the expectations of investors in terms of generating renewed demand. Consider also market consensus and Stan Druckenmillier's biggest conviction trade right now: shorting the US dollar. The behavior of the USD/CNH and the underperformance of key industrial commodities such as copper and iron ore could signal a potential trajectory for closely correlated currencies like the Australian dollar.
In such a bifurcated market environment, we as traders need to remember to trade based on the price charts in front of us, seek out asymmetrical opportunities, manage risk appropriately, and not let ourselves be overly swayed by prevailing narratives. The key is to maintain an objective viewpoint while navigating these uncertain waters.
How do we express our views?
We consider expressing our views via the following hypothetical trades1:
Case study 1: long micro E-mini S&P 500 index future
We would consider taking a long position on the micro E-mini S&P 500 index future (MESM3) at the present level of 4214, with a stop-loss below 4020, which could bring us a hypothetical maximum loss of 194 points. Looking at Figure 1, if the rounding bottom breakout confirms, the index has the potential to reach 4600, a hypothetical gain of 386 points. Each point move in the micro E-mini S&P 500 index future contract is USD 5.
Case study 2: short micro AUD/USD future
We would consider taking a short position on the micro AUD/USD future (M6AM3) at the present level of 0.6655, with a stop-loss above 0.673, which could bring us a hypothetical maximum loss of 0.0075 points. Looking at Figure 3, if the downside breakout happens, AUD/USD has the potential to reach 0.63, a hypothetical gain of 0.0355 points. A micro AUD/USD future contract represents 10,000 AUD. Each point move is USD 10,000.
EXAMPLES CITED ABOVE ARE FOR ILLUSTRATION ONLY AND SHALL NOT BE CONSTRUED AS INVESTMENT RECOMMENDATIONS OR ADVICE. THEY SERVE AS AN INTEGRAL PART OF A CASE STUDY TO DEMONSTRATE FUNDAMENTAL CONCEPTS IN RISK MANAGEMENT UNDER GIVEN MARKET SCENARIOS. PLEASE REFER TO FULL DISCLAIMERS AT THE END OF THE COMMENTARY.
 | A guest post by
|