
Beyond Inversion
Beyond Inversion
Written on 2023-07-01, first published on 2023-07-05


Markets in focus
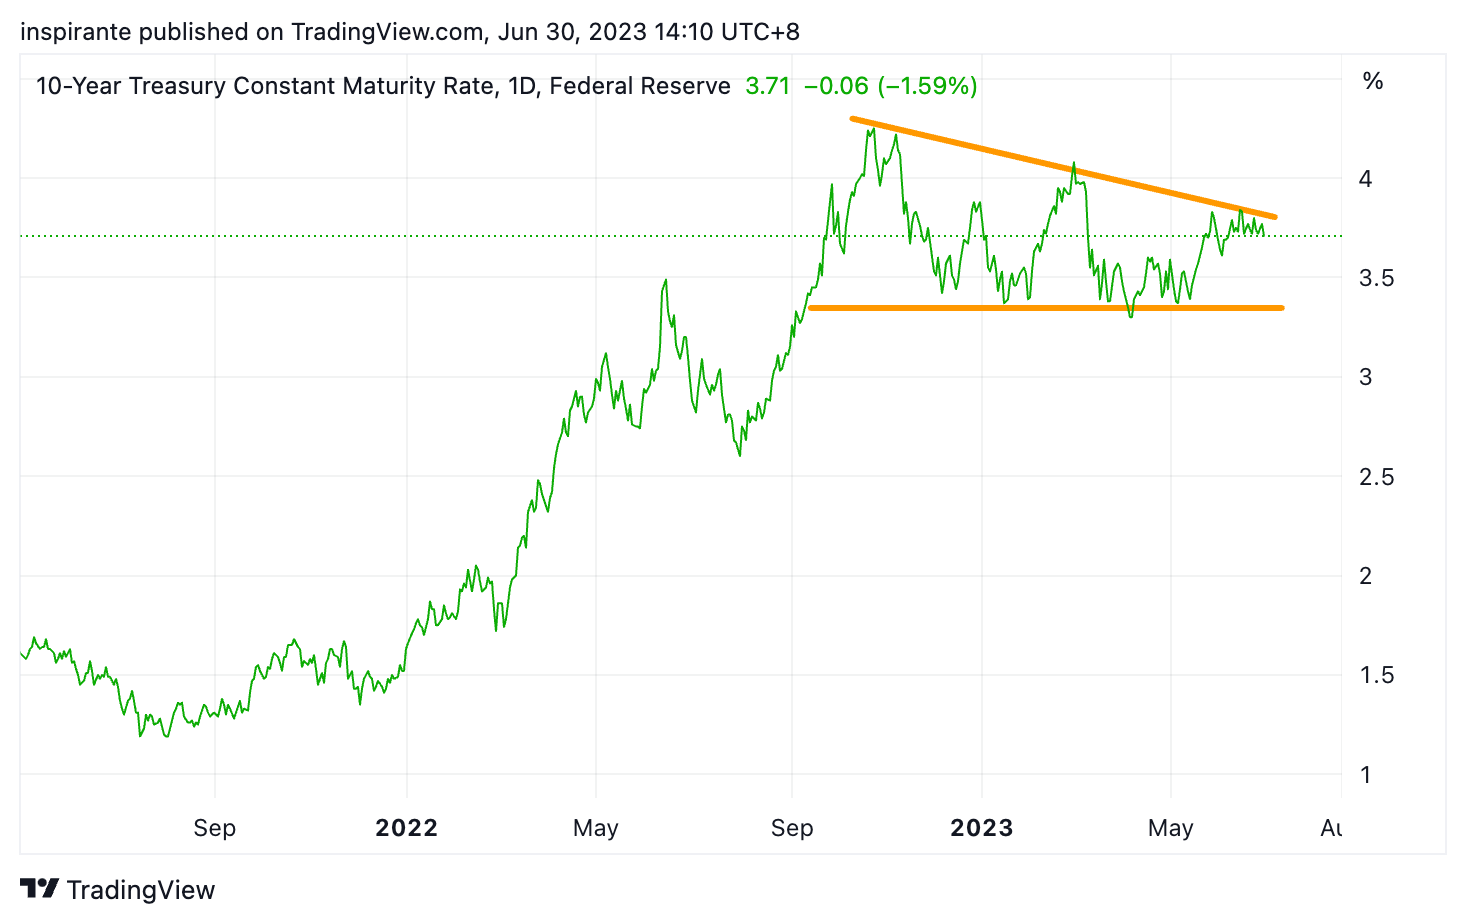
US 10y yield climbed above 3.8% again lately. For the past year, it has been trading in a descending triangle with a well-respected support at around 3.3%.
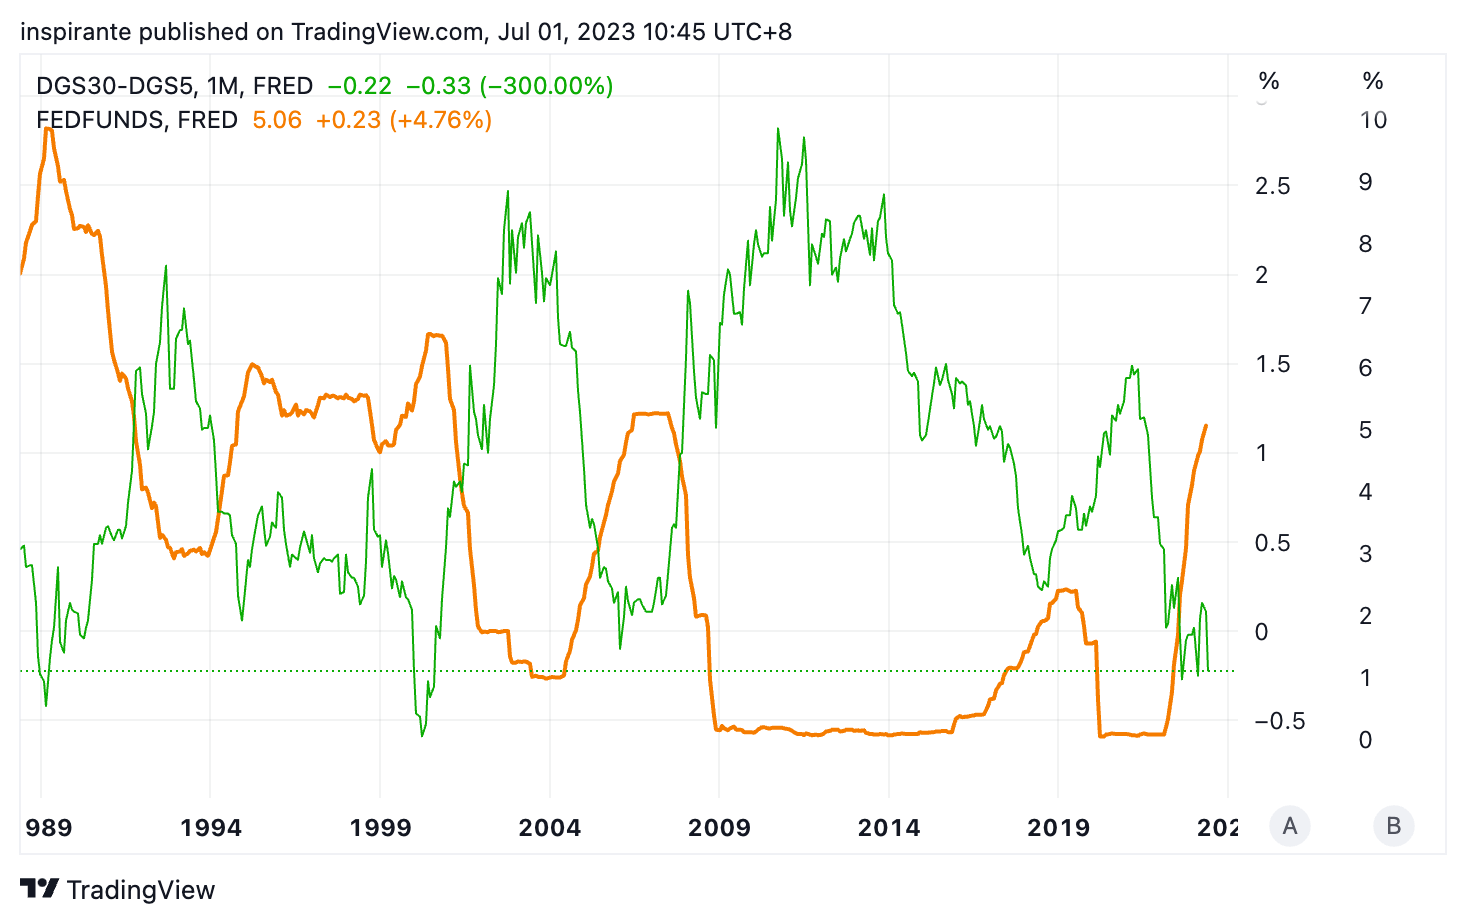
Currently, the US 5y30y yield curve is the most inverted since 2000. Historically, the curve typically begins to steepen before the first rate cut following a Fed pause in rate hikes.
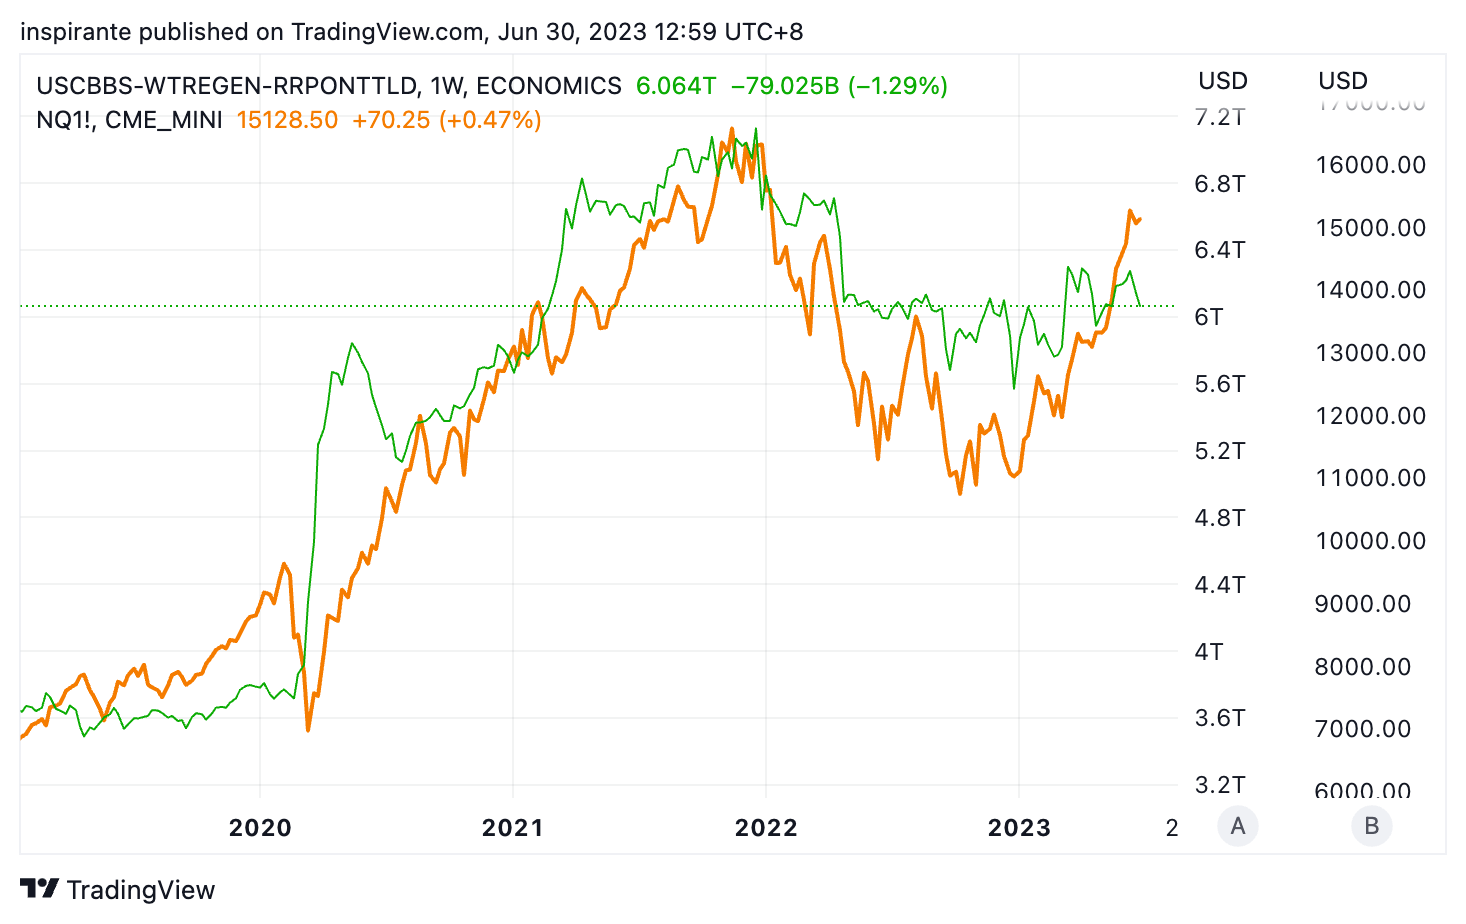
Since the pandemic low, the US equity market is evidently driven by the broad liquidity in the financial system, which can be proxied by the central bank balance sheet, offset by the Treasury General Account and overnight reverse repo. The recent liquidity shift suggests that the equity market’s movement may be overstretched.
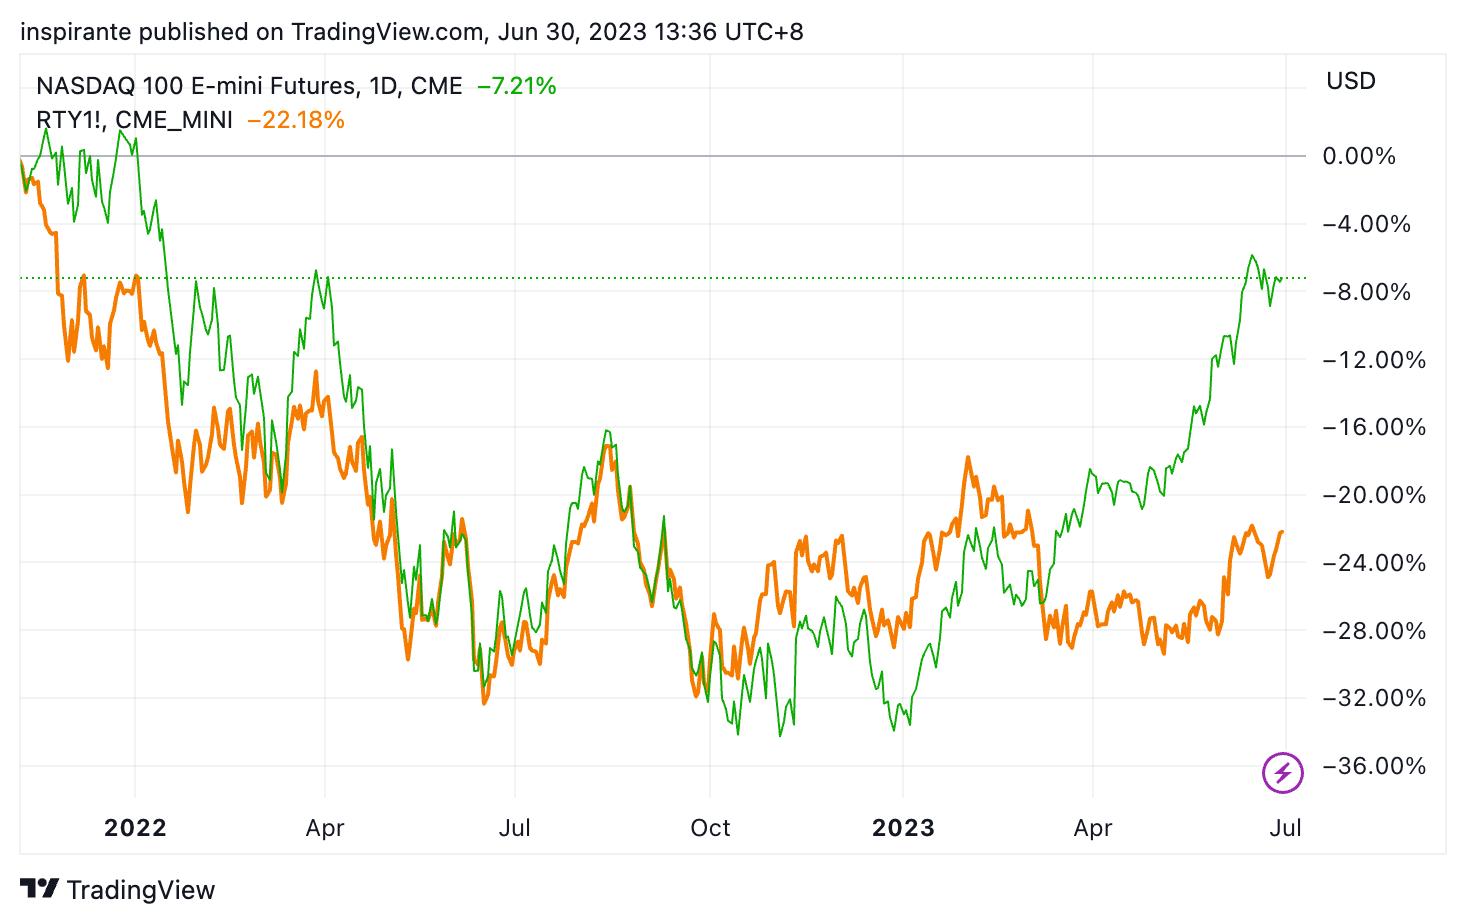
Tech stocks have significantly outpaced small caps since March of this year. Given the AI frenzy and the substantial cash reserves of large tech firms, this is not surprising, especially when compared to small companies grappling with high borrowing costs in the current interest rate environment.
Our market views
For many investors, the Treasury market might seem a world away, filled with jargon and lacking the glitz of the AI stocks. Let’s face it, even the name “fixed income” does sound pretty dull. Yet, the US Treasury market is the backbone of finance and the economy. Take the 10-year yield, it’s not only a gauge of investor sentiment, and a signal of economic growth and inflation expectations, but it also underpins most types of credit, from mortgages and car loans to corporate bond yields. It’s a key factor in the borrowing costs for consumers and businesses.
US economic conditions present a mixed bag. Loan demand has collapsed, impacting capital expenditure and borrowing. This was the case even before the regional bank crisis – the US was already facing a recessionary credit crunch. But then, the labor market remains robust. The Fed’s repeated messages highlight a labor market that’s still too tight, suggesting its battle against inflation is far from over. Chairman Powell recently stated at a monetary policy forum that “the current policy might be restrictive, but not restrictive enough, or being restrictive for long enough,” given the strong labor market. Reflecting this, the 2y10y yield spread has fallen to its most inverted since the 1970s.
Historically, an inverted Treasury yield curve signals potential recessions. Some investors interpret this as a sign of an imminent “Fed Pivot”. However, it’s essential to understand the finesse here. It is when the curve begins bull steepening, a sign that the economy is in trouble likely because of overtightening, that the Fed may shift to a more dovish policy (i.e., rate cuts). A bull steepening means the entire yield curve goes lower but the front end drops more than the back end, due to expectations of lowering policy rates.
As of now, as long as the labor market stays heated, the 2y10y yield curve might remain inverted for the next few months. The economy is still bracing for the full impact of some of the fastest rate increases in history, and the more the Fed needs to keep policy tight, the more economic pain will be felt. That paints a gloomy picture of future growth and inflation expectations. However, the yield curve eventually should revert to its normal shape, likely via bull steepening. Thus, if we were to position for a steepener, the 5y30y might be a better choice than the 2y10y, as the belly (5y) of the curve should be more sensitive and less sticky to signals of potential policy changes than the front end (2y).
How do we express our views?
We consider expressing our views via the following hypothetical trades1:
Case study 1: short micro 10y treasury yield
We would consider taking a short position on the micro 10y treasury yield future (10YN3) at the present level of 3.825, with a stop-loss above 4.00, which could bring us a hypothetical maximum loss of 0.175 points. Looking at Figure 1, if the triangle’s upper resistance holds and 10y yield reserves, it has the potential to fall to 3.30, a hypothetical gain of 0.525 points. Each point move in the micro 10y treasury yield future contract is USD 1000.
Case study 2: long 5y30y treasury yield steepener
We would consider taking a long position on the 5y30y steepener by simultaneously longing the micro 30y treasury yield future (30YN3) at 3.875 and shorting the micro 5y treasury yield future (5YYN3) at 4.186 at a spread of -0.311. The stop-loss would be -0.50, which could bring us a hypothetical maximum loss of 0.189 points. Looking at Figure 2, if the 5y30y yield curve starts to steepen, it has the potential to reach 1.00, a hypothetical gain of 1.311 points. Each point move in the individual future contract and the 5y30y yield spread is USD 1000.
The Rearview Mirror
A look into history could help us position ourselves better for the future. This section provides a rundown of market moves across major asset classes between April and June.
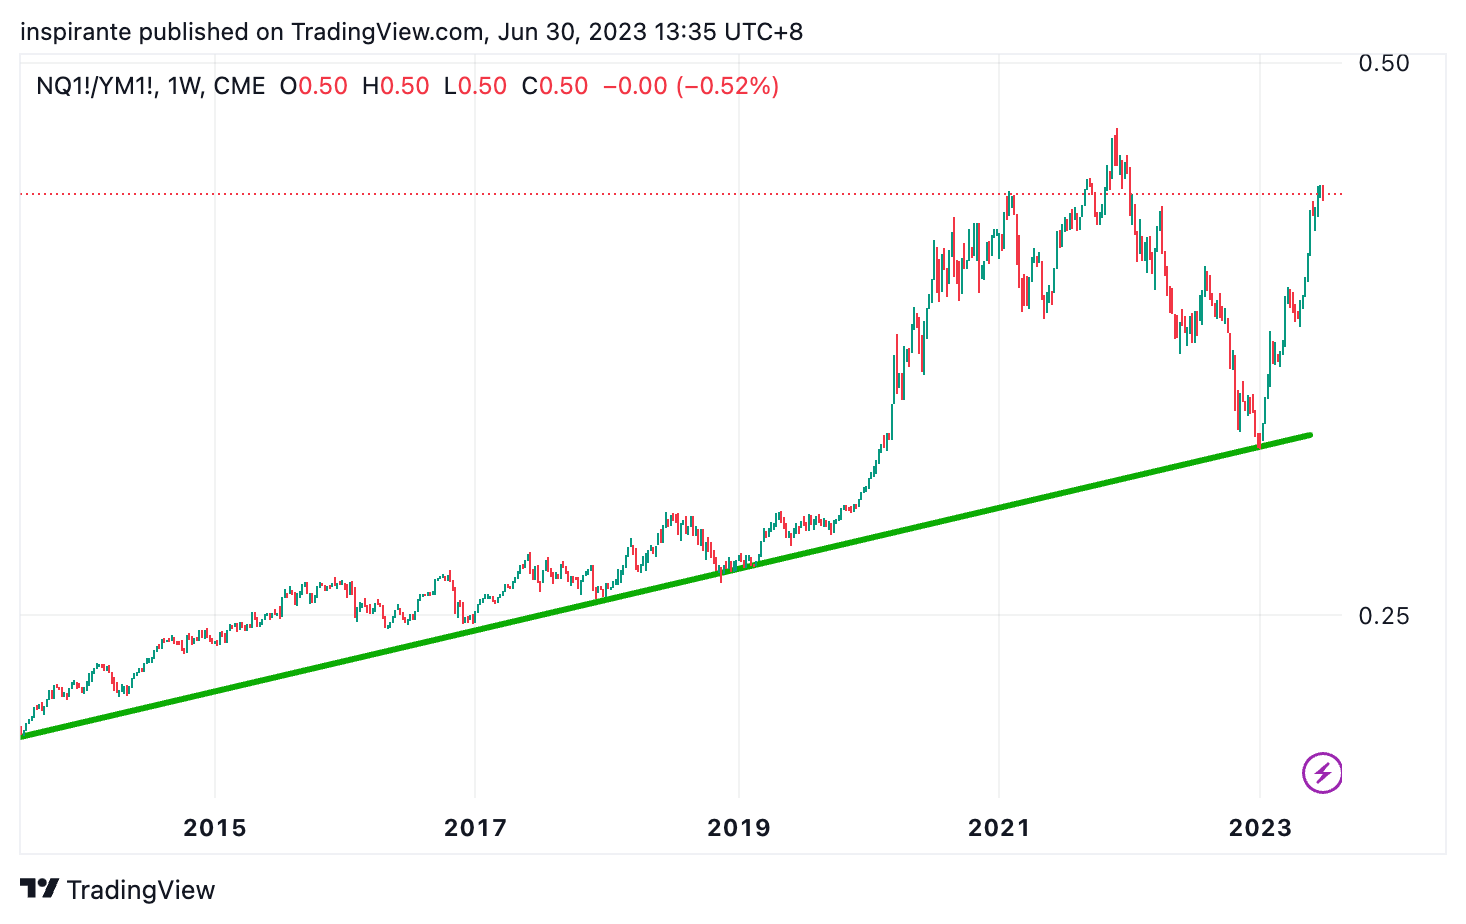
The Nasdaq to Dow ratio has seen another remarkable increase, reminiscent of its 2020 surge, suggesting that growth stocks are once again trumping value. However, this ratio has reached a juncture where a potential reversal seems increasingly probable.
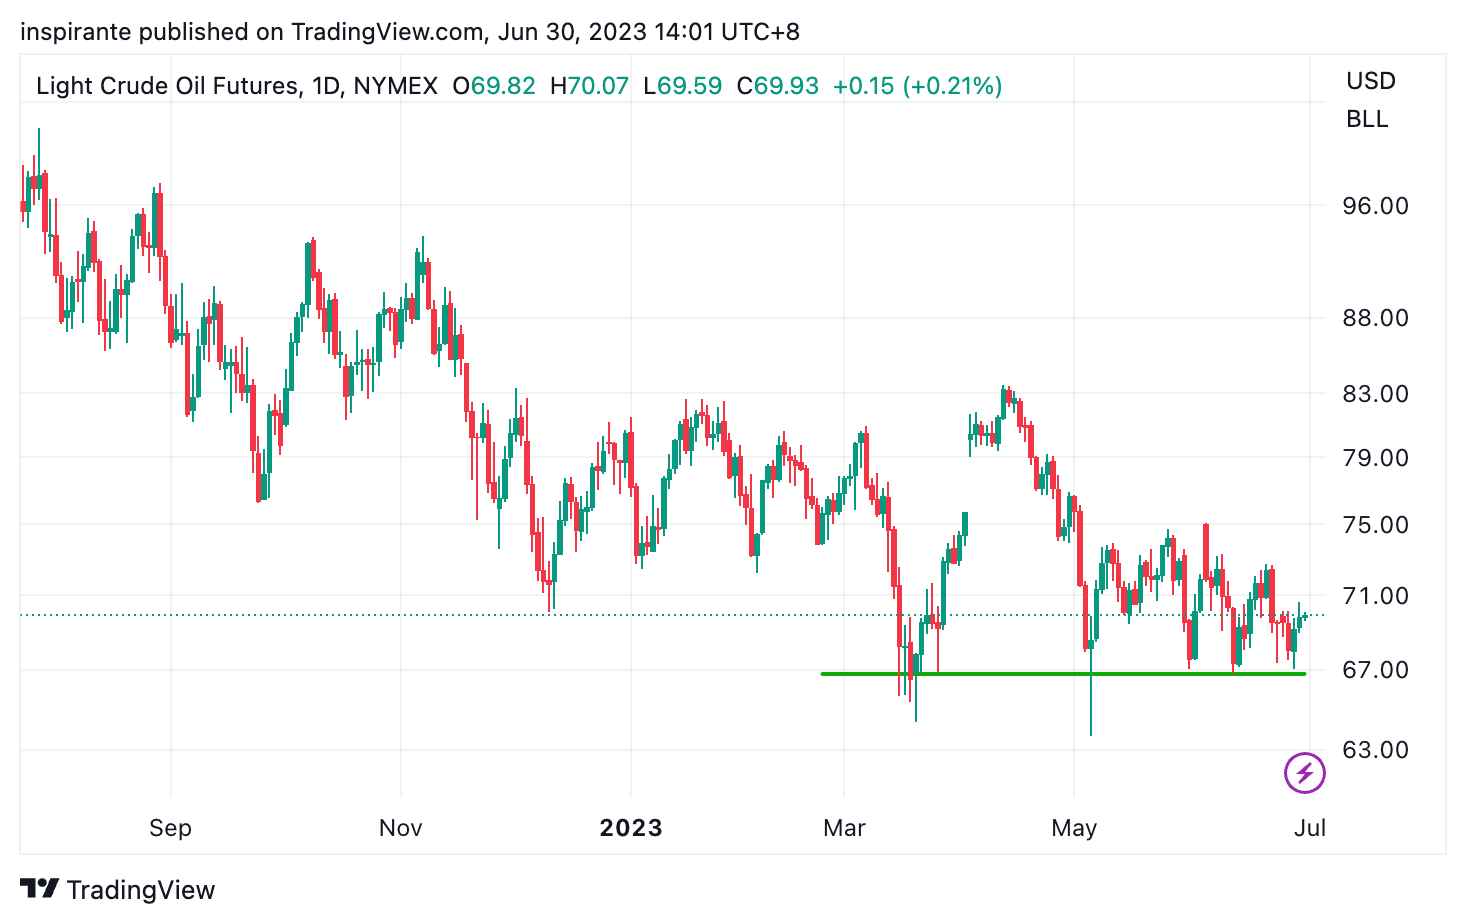
Crude oil continues to trade within an increasingly tight range, with significant support established at the $65-$67 level. This prolonged consolidation often precedes a significant breakout move.
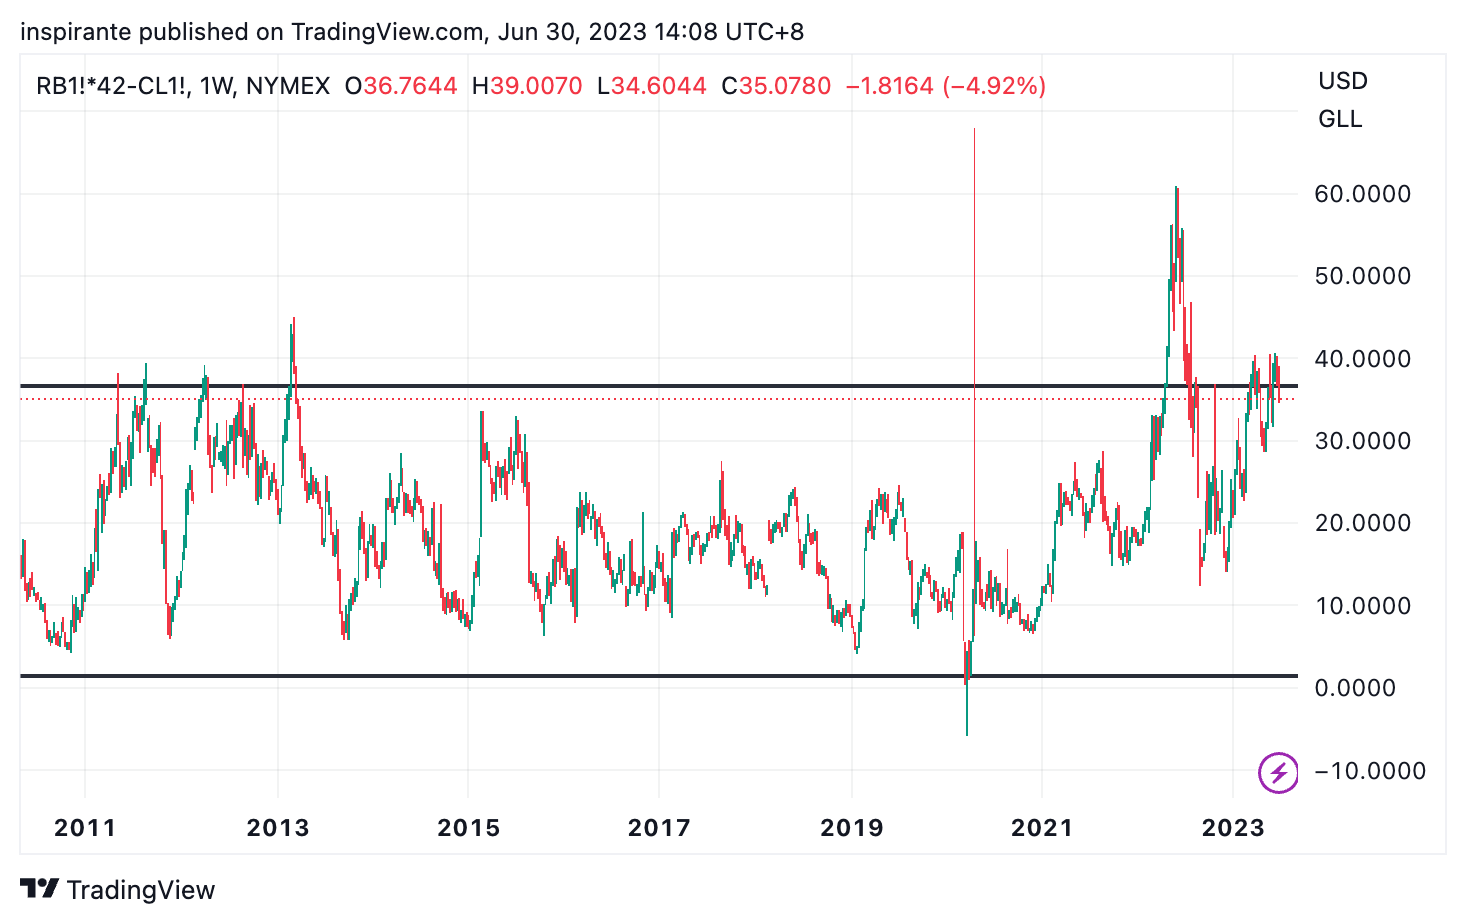
The crack spread, reflecting the refinery profit margin between gasoline and crude oil, continues hovering near its historical range’s upper end.
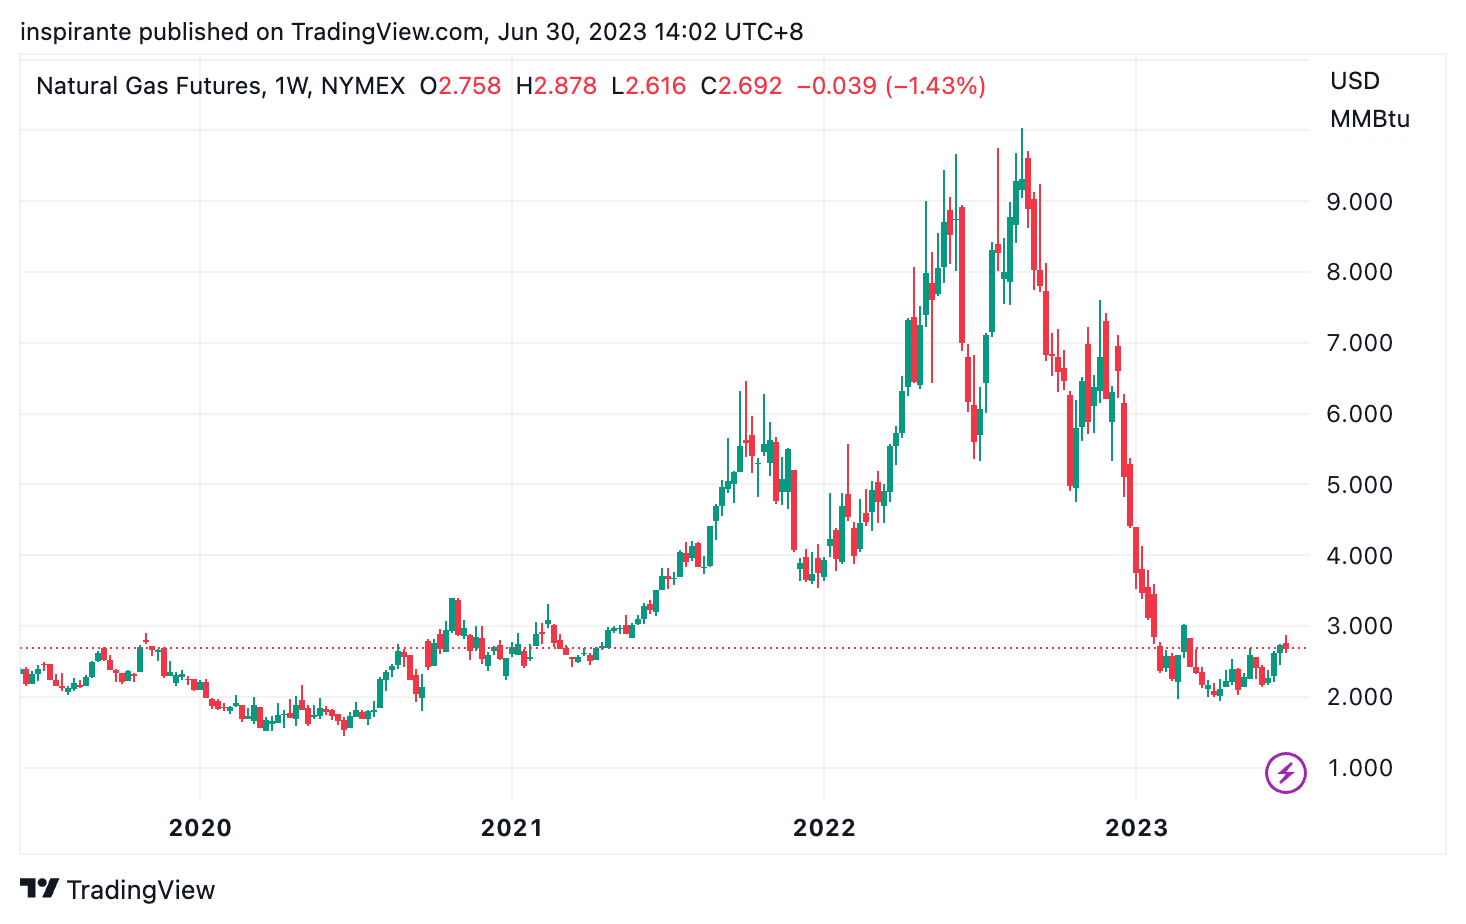
US natural gas experienced a meteoric price rise in 2021, quadrupling its value, only to give back all these gains within a few short months in 2022. Current price action suggests it may have found a base, potentially priming it for another bull run.
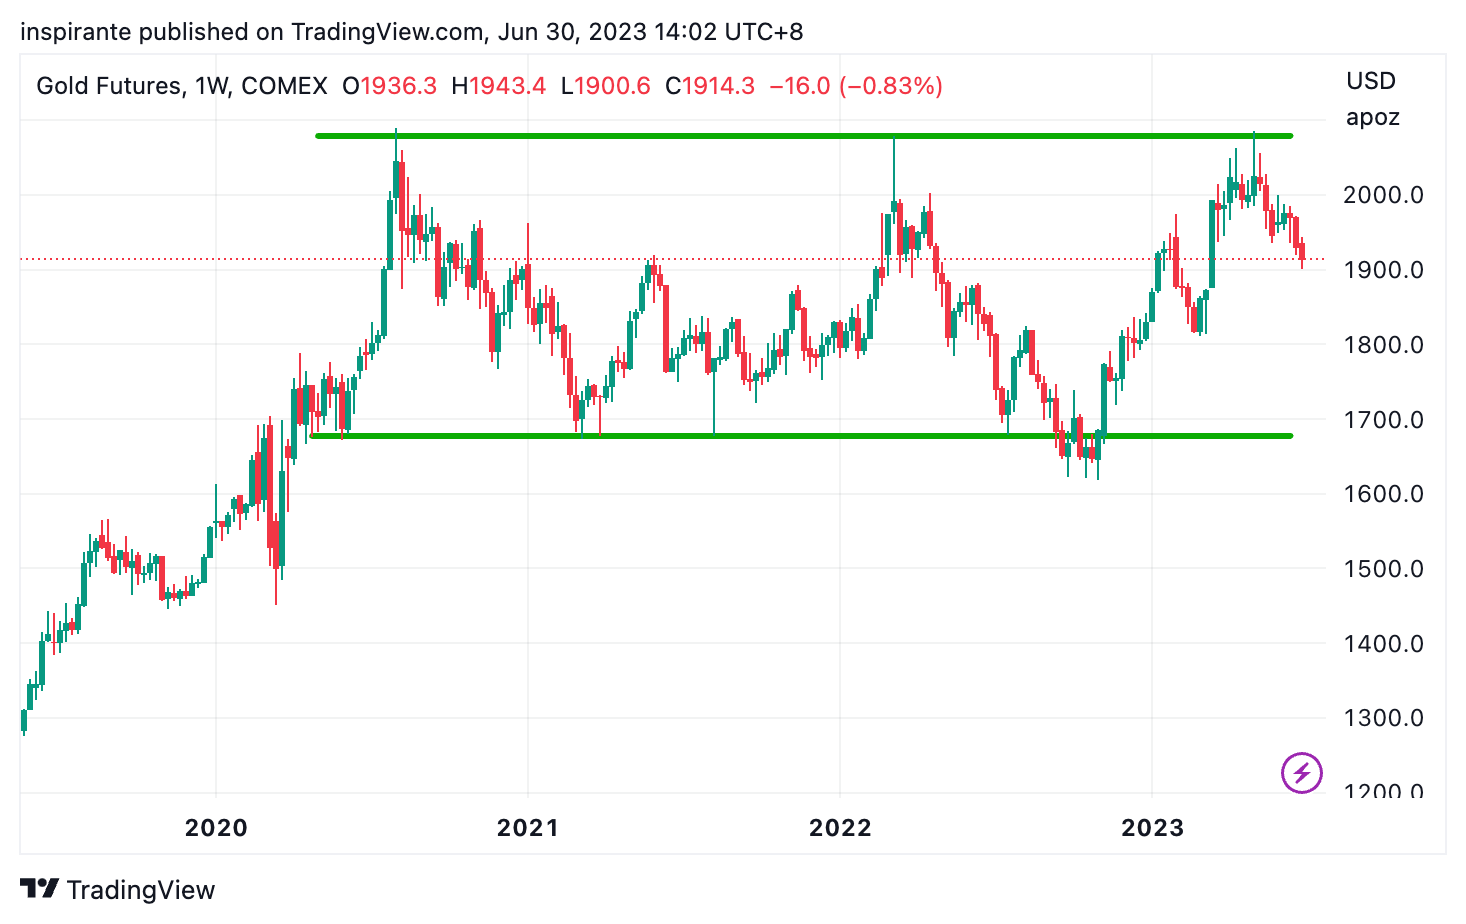
To the dismay of many, gold failed its third attempt to break through $2100. It fell back to the $1900 region, which means it has gone nowhere since mid-2020. When would it shine again?
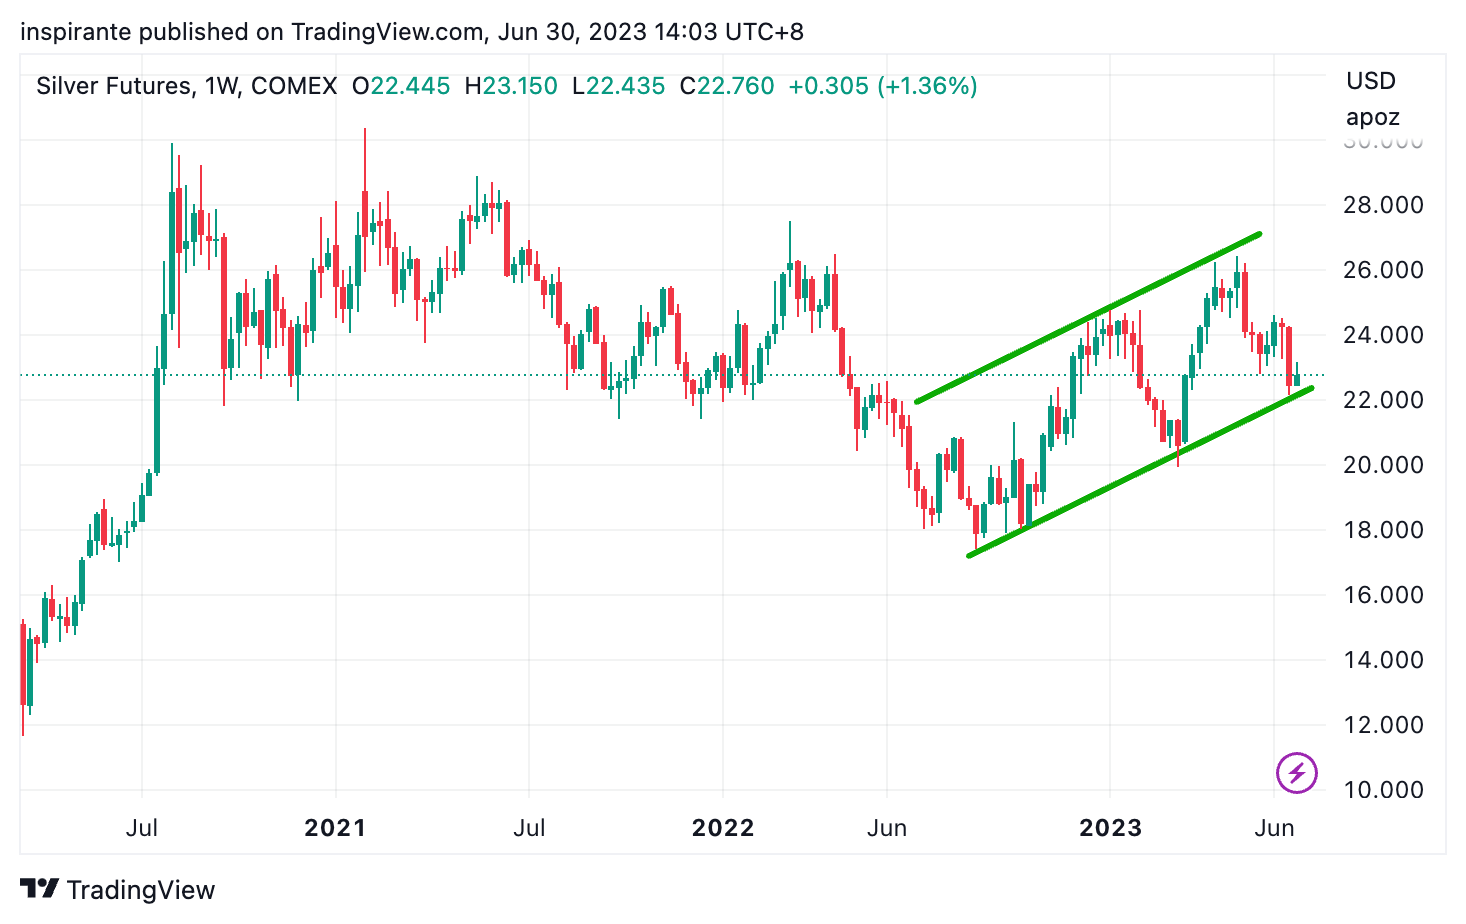
Following suit, Silver has lost momentum and didn’t manage to push beyond $26. Now, it’s fallen back to $22, a crucial multi-year support level.
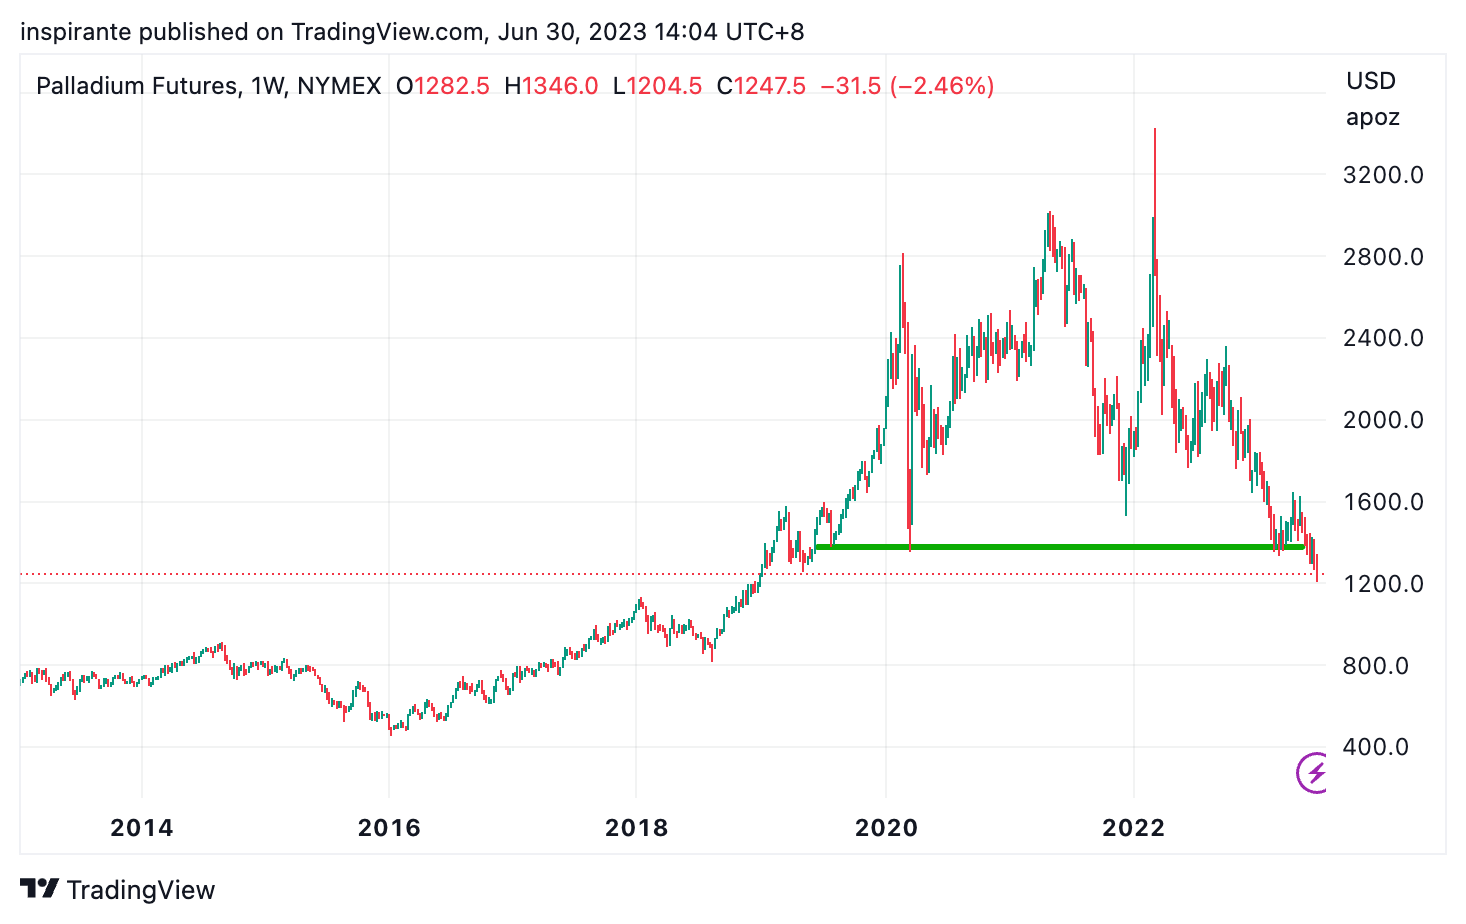
Palladium has broken the neckline of a gigantic Head-and-Shoulder (H&S) top. Its next support can only be found near $800.
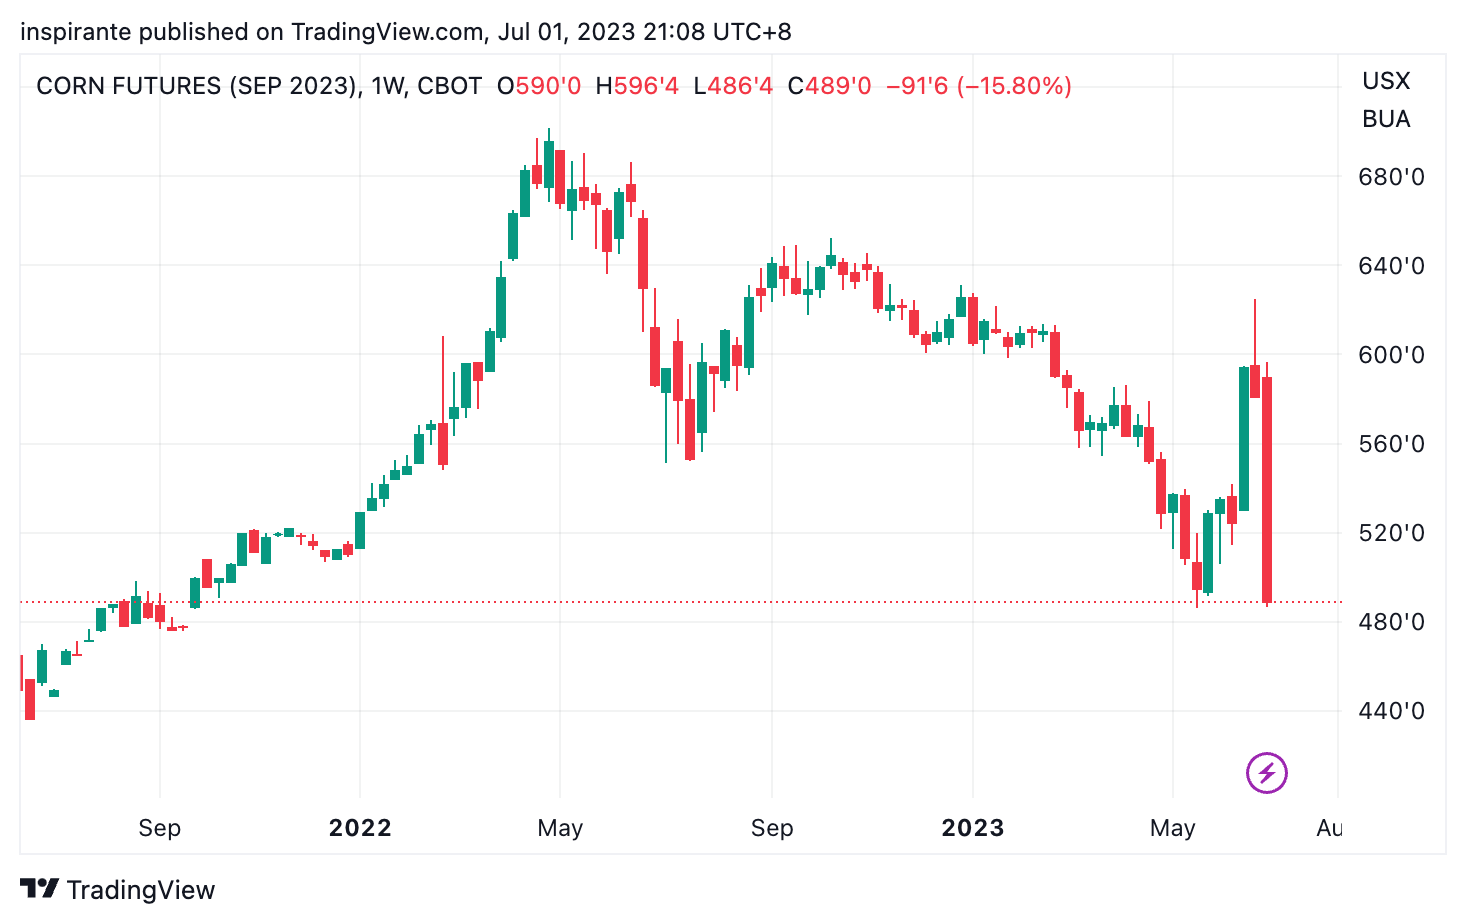
Corn had an incredibly sharp roundtrip, wiping out all gains since May within a week. This price action reaffirms the prevailing downtrend, underlining the bearish sentiment due to overwhelming selling pressure.
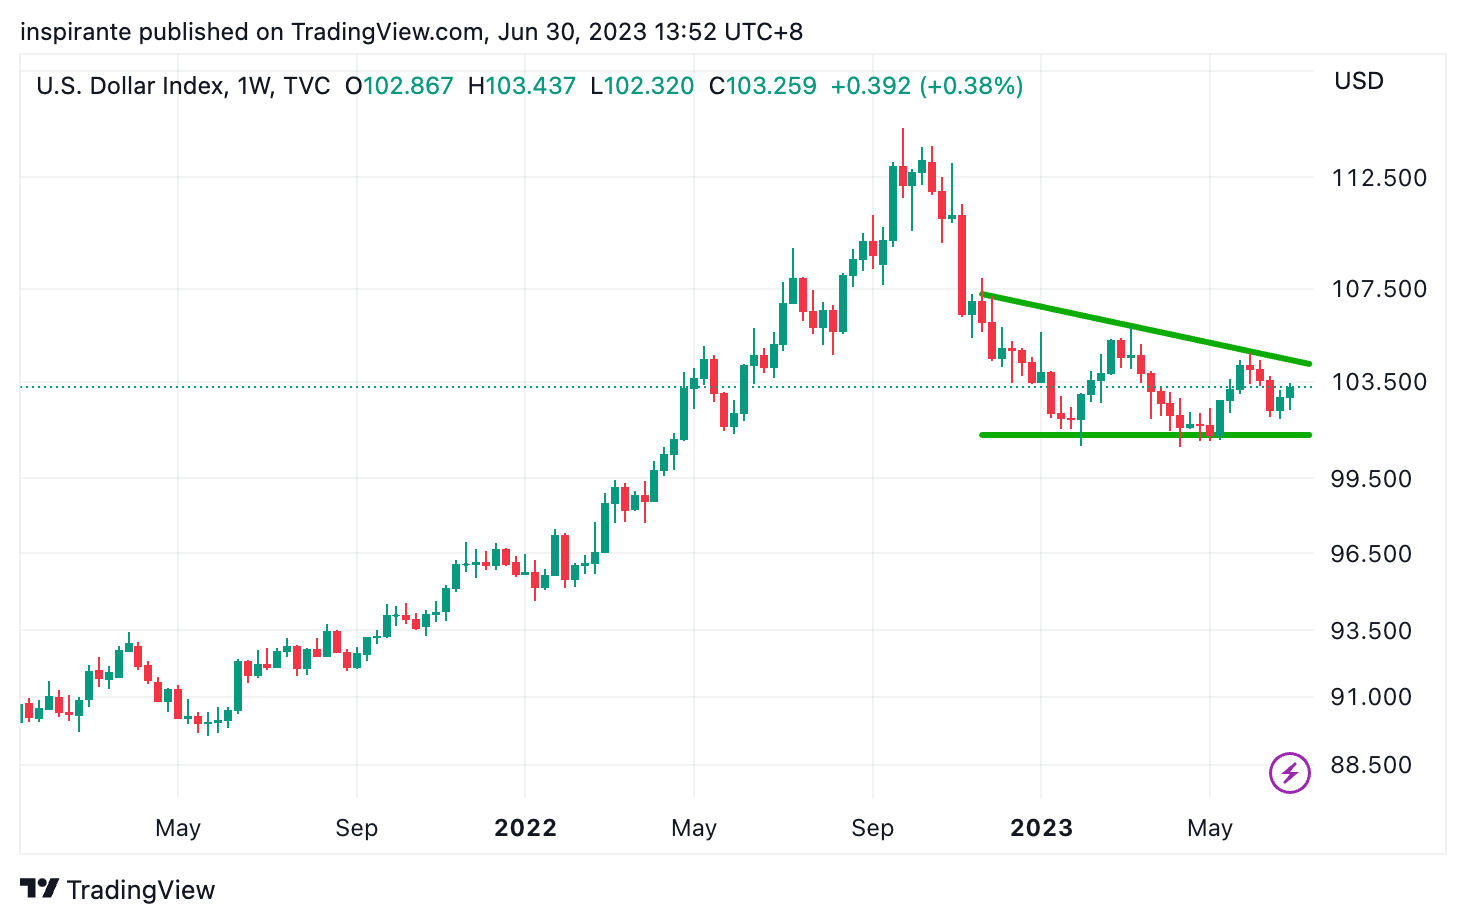
The US dollar has traded in a descending triangle for the past ten months. While a clear direction is not yet evident, investors should keep a close watch. A breakout in either direction could significantly impact all other asset classes.

The Canadian dollar has broken out from an ascending triangle and now re-testing the breakout level. If the previous resistance successfully becomes the new support, we can anticipate a continued strengthening of the Loonie against the US dollar.
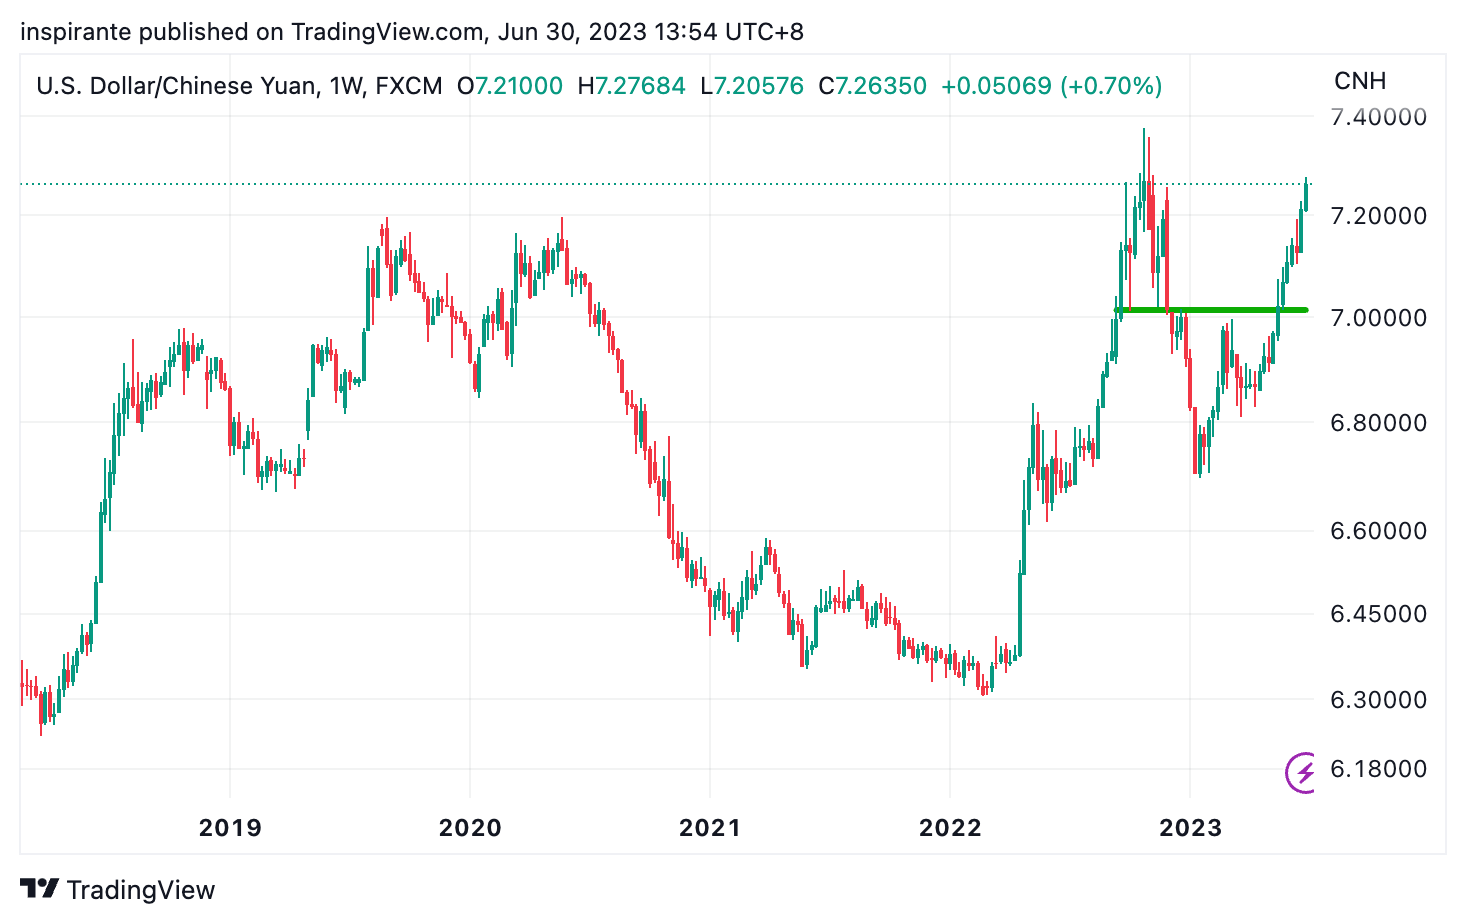
The CNH has been one of the worst-performing Emergy Market currencies. It has depreciated more than 7% against the US dollar since the start of the year.
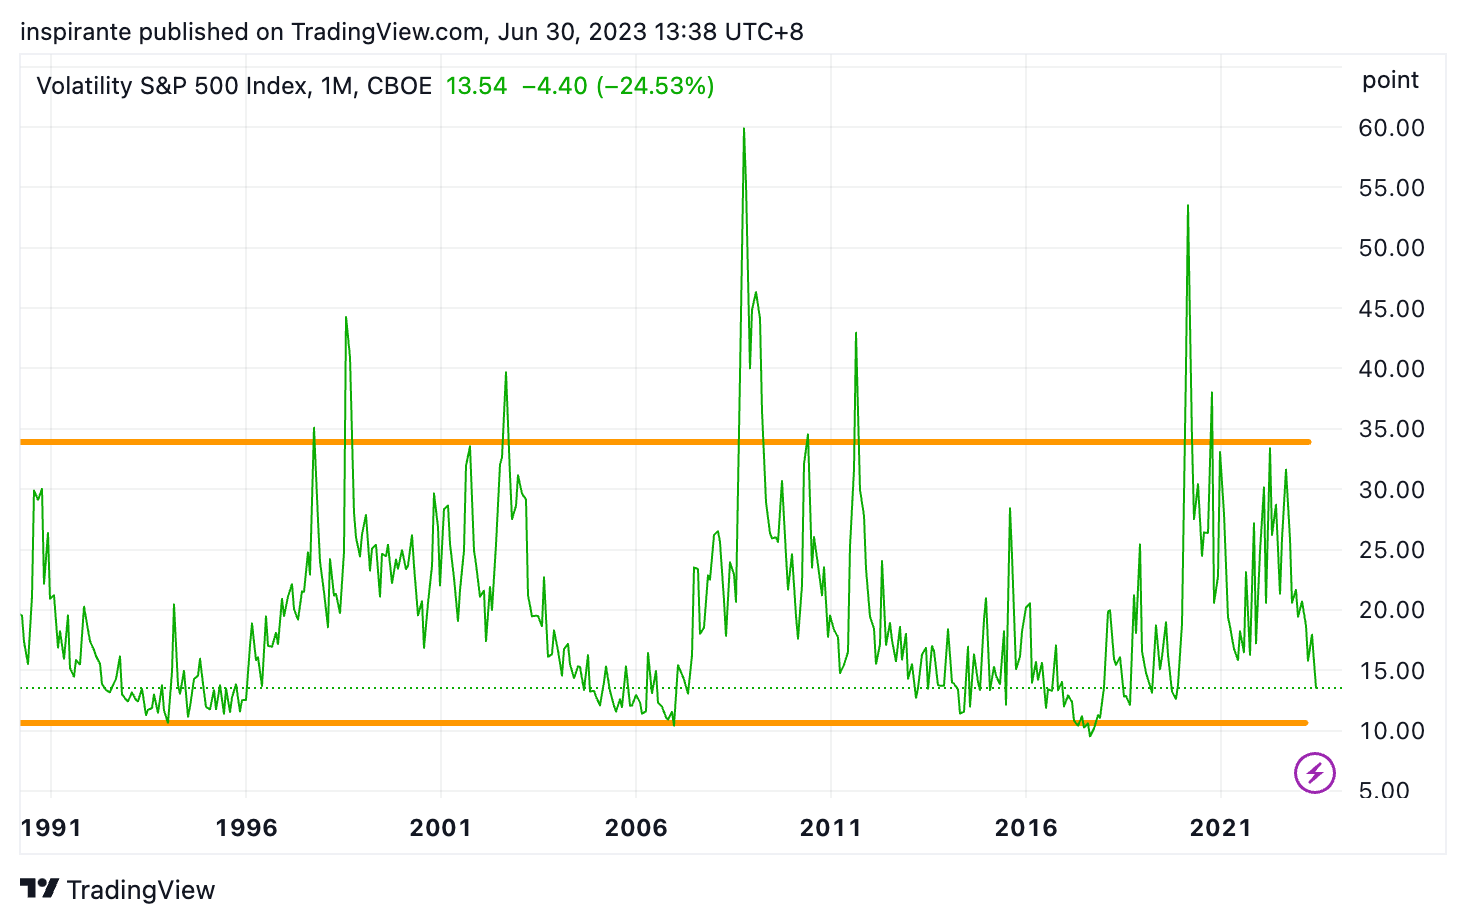
The equity market has been on a good run, leading to a drop in volatility, and the VIX is now below 14. However, it’s nearing a level that often signifies market complacency, as investors start to abandon downside protections.
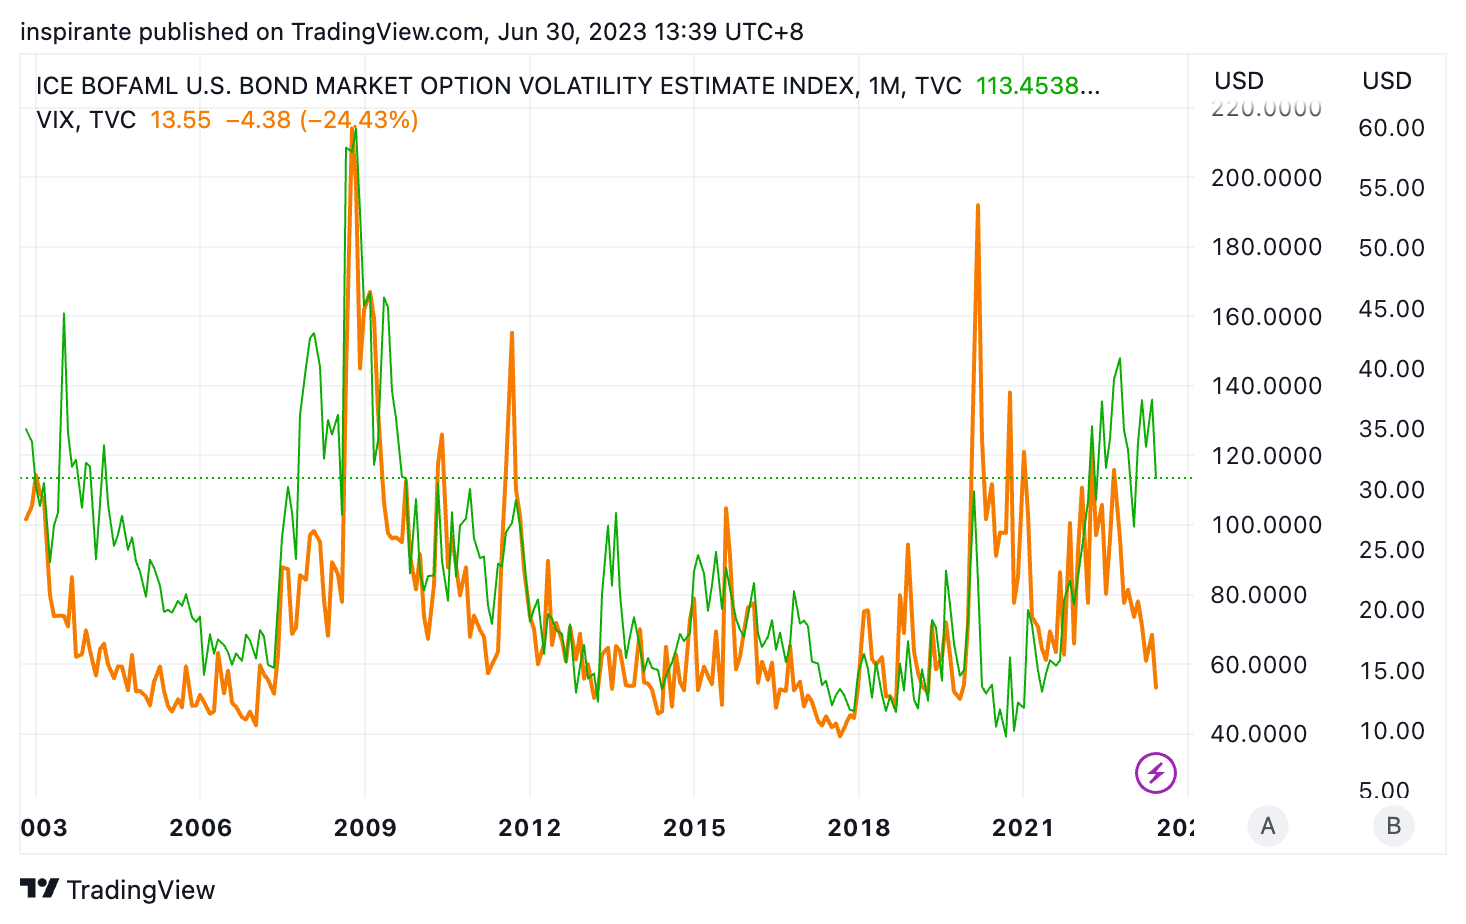
Compared to the VIX, which has dropped to the lower end of its historical range, the MOVE index (bond volatility index) remains elevated. This indicates continued uncertainty in the bond market concerning monetary policy and inflation expectations, raising the question of whether the equity market is prematurely complacent.
EXAMPLES CITED ABOVE ARE FOR ILLUSTRATION ONLY AND SHALL NOT BE CONSTRUED AS INVESTMENT RECOMMENDATIONS OR ADVICE. THEY SERVE AS AN INTEGRAL PART OF A CASE STUDY TO DEMONSTRATE FUNDAMENTAL CONCEPTS IN RISK MANAGEMENT UNDER GIVEN MARKET SCENARIOS. PLEASE REFER TO FULL DISCLAIMERS AT THE END OF THE COMMENTARY.
 | A guest post by
|