

Beyond soft landing
Written on 2023-12-16, first published on 2023-12-19


Markets in focus

In the latter half of 2023, the US Treasury bond yield curve, exemplified by the 2y10y spread, has notably steepened. This is evidenced by the formation and reversal of a double-bottom pattern, indicating a significant shift in the prevailing trend.

The US dollar index demonstrates a recurring cycle of approximately 3.5 years. Historically, the dollar often reaches a local low at the end of each cycle. Currently, the index is on a trajectory suggesting further weakening into 2024, aligning with the anticipated end of the current cycle.

Historically, since the 1950s, the US unemployment rate has displayed predictable behavior. Except for a few instances, an uptick in unemployment typically signals a sustained increase, often preceding a recession. This trend seems to be manifesting again in the current economic climate.

Mid-2023 saw a false breakout from a Head-and-Shoulders (H&S) top in soybean oil prices, followed by a rebound and subsequent downturn. Prices are forming a rounding top and retesting the neckline right now, potentially indicating a further decline.
Our market views
2023, a year consistently marked with twists and turns in the market, is drawing to a close. Just over two weeks ago, Fed Chairman Powell issued a cautionary note, stating, “It would be premature to conclude with confidence that we have achieved a sufficiently restrictive stance, or to speculate on when policy might ease.” This perspective has been consistent with the Fed’s approach during the current rate-hike cycle. However, in the year’s final FOMC meeting, when questioned about potential rate cuts, Chairman Powell’s response was notably pointed: “… the next question, which is when it will become appropriate to begin dialing back the amount of policy restraint that’s in place.” He confirmed that this was a topic of discussion during the meeting.
One might wonder what transpired in such a brief period to cause a significant shift in the Fed’s tone. We are certainly aware that the financial market’s price action bespokes the prevalent expectation of a “soft landing”, seemingly endorsed by the Fed. Chairman Powell said, “Inflation has eased from its highs, and this has occurred without a significant increase in unemployment.” It appears the mission has been accomplished. Granted, monetary policy has an inherent delayed impact. Hence this preemptive easing of the restrictive monetary policy before inflation returns to the 2% target.
Let’s also re-examine the notion of a “soft landing” and the much-desired “Goldilocks” scenario. In the journey to ease inflation by tightening financial conditions thus far, bond yields have performed most of the heavy lifting. Meanwhile, the US dollar has played a modest role but has weakened significantly. The equity market is near all-time highs, and credit spreads remain narrow. Ideally, tighter financial conditions would entail higher bond yields, a stronger dollar, wider credit spreads, and lower equity levels. Now, even bond yields are trending lower, influenced by the market’s aggressive anticipation of rate cuts. It resulted in financial conditions loosening again substantially. Without a significant boost in economic productivity (potentially fueled by Artificial Intelligence) that outpaces wage growth, the risk of inflation resurging remains non-negligible, especially given the historically low levels of unemployment.
Regarding unemployment, its predictability stands out due to its relatively low volatility, especially compared to other time series data like prices. As depicted in Figure 2, a rise in unemployment typically heralds a continuing upward trend. The current trajectory appears no different.
The US economy currently resembles a ball delicately balanced atop a hill – a classic “unstable equilibrium” – where a slight nudge would send it rolling downhill. Looking towards 2024, how do we position ourselves? Being open-minded and prepared for the full spectrum of possibilities is paramount. First, there’s the potential resurgence of inflation. Long-duration bonds remain vulnerable, especially if the labor market remains resilient and wage growth persists, exerting upward inflation pressure. Second, we should also brace for the possibility of a significant economic downturn – the “hard landing” scenario – characterized by a notable slowdown and potential recession. In this case, commodities will likely face pressures until economic stimuli trigger a recovery. This makes the steepener trade aptly strategic at this juncture, offering adaptability to both inflationary and recessionary outcomes. Should inflation spike, the long end of the yield curve is poised to rise more than the short end, considering we are already at the end of one of the most aggressive hiking cycles in history. The room for upward movement in front-end interest rates is now quite limited. Alternatively, if recessionary forces prevail and the Fed rapidly reverses its restrictive monetary policy, the short end of the curve should decline more than the long end, leading to a steeper yield curve.
As we bid farewell to an eventful and dynamic 2023, we extend our heartfelt thanks to all Fresh from the Trading Room readers. We wish everyone a joyous holiday season and a splendid time with family, friends, and loved ones. Until next year!
How do we express our views?
We consider expressing our views via the following hypothetical trades1:
Case study 1: long 2y10y micro treasury yield steepener
We would consider taking a long position on the 2y10y steepener by simultaneously longing the micro 10y treasury yield future (10YF4) at 3.927 and shorting the micro 2y treasury yield future (2YYF4) at 4.250 at a spread of -0.323. The stop-loss would be -0.66, which could bring us a hypothetical maximum loss of 0.337 points. Looking at Figure 1, if the 2y10y yield curve continues to steepen, it has the potential to reach 0.5, a hypothetical gain of 0.823 points. Each point move in the individual future contract and the 2y10y micro treasury yield spread is USD 1000.
Case study 2: short soybean oil future
We would consider taking a short position on the soybean oil future (ZLH4) at the current level of 50.15, with a stop-loss above 54, which could bring us a hypothetical maximum loss of 3.85 points. Looking at Figure 4, if the breakout from the rounding top is confirmed, the soybean oil price has the potential to drop to 35, a hypothetical gain of 15.15 points. Each futures contract represents 60,000 pounds of soybean oil, and one point move is USD 600.
The Rearview Mirror
A look into history could help us position ourselves better for the future. This section provides a rundown of market moves across major asset classes between July and December.

The Nasdaq index reacted positively to Chairman Powell’s recent comments about potential rate cuts. It became the first to surpass its late 2021 high, reflecting renewed investor optimism.

The Nikkei 225 index recently broke out from a bull flag pattern, retested the breakout level, and resumed its upward trajectory. This movement confirms that the dominant uptrend remains firmly in place.
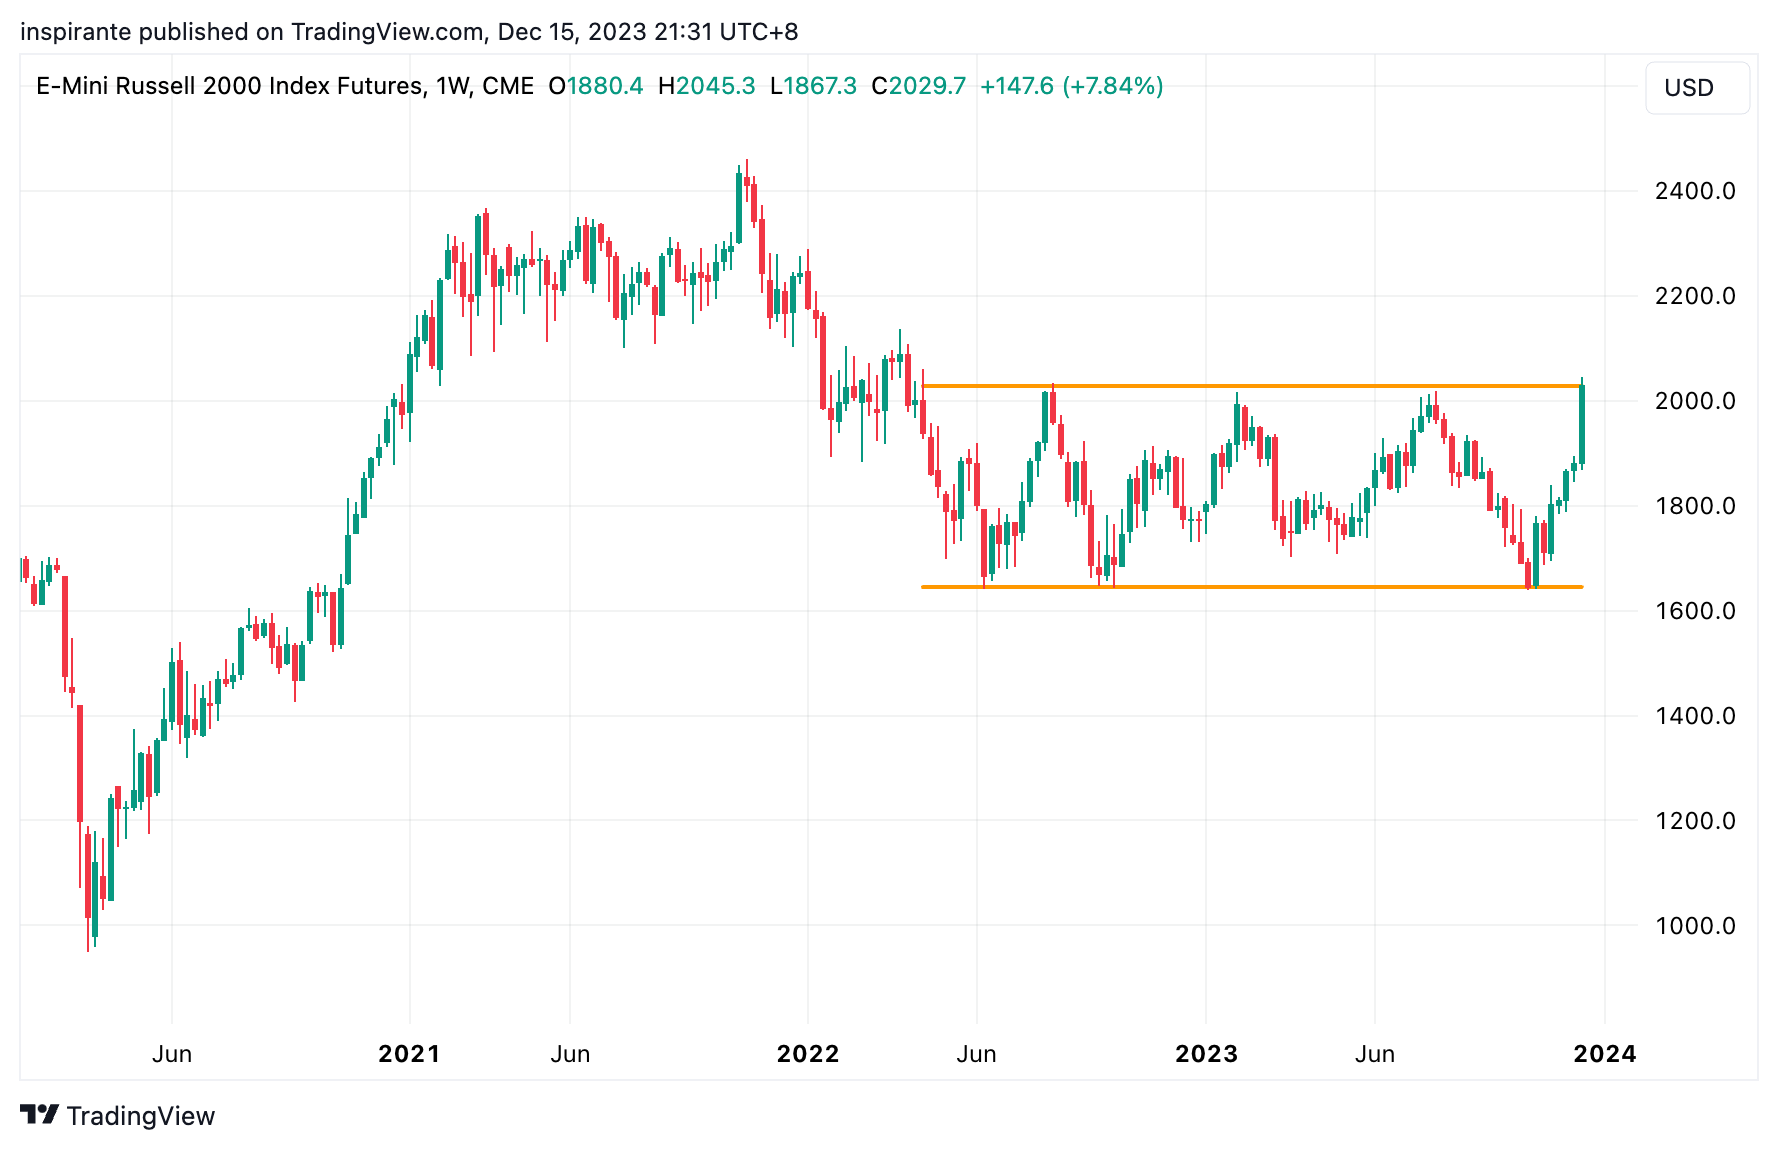
The Russell 2000 index, while still below its 2021 peak, has recorded the fastest recovery in its history from a 52-week low to a 52-week high.

As the US dollar weakens in the latter half of 2023, the NZD/USD pair is approaching a critical breakout point, challenging a three-year resistance level.

The CNH is gaining strength against the US dollar. As previously discussed in the 5th Dec piece, the USD/CNH pair is poised for a significant decline in 2024.

Amid a weakening US dollar and declining bond yields, gold has made another attempt to breach its overhead resistance. Despite not securing a decisive breakout yet, the price is consolidating below 2100, signaling potential for further advances.

Silver has yet to overcome its downtrend resistance successfully. Until a decisive breakout occurs, it’s premature to declare the start of a bull market in precious metals.

Echoing our 24th Oct analysis, should a recession occur instead of a Goldilocks scenario, gold is likely to outperform silver in relative terms.

Feeder cattle prices have rallied impressively, mirroring patterns observed in 2015. The current market behavior resembles the failed attempt then, which led to a significant price collapse, erasing gains from 2013-2014.
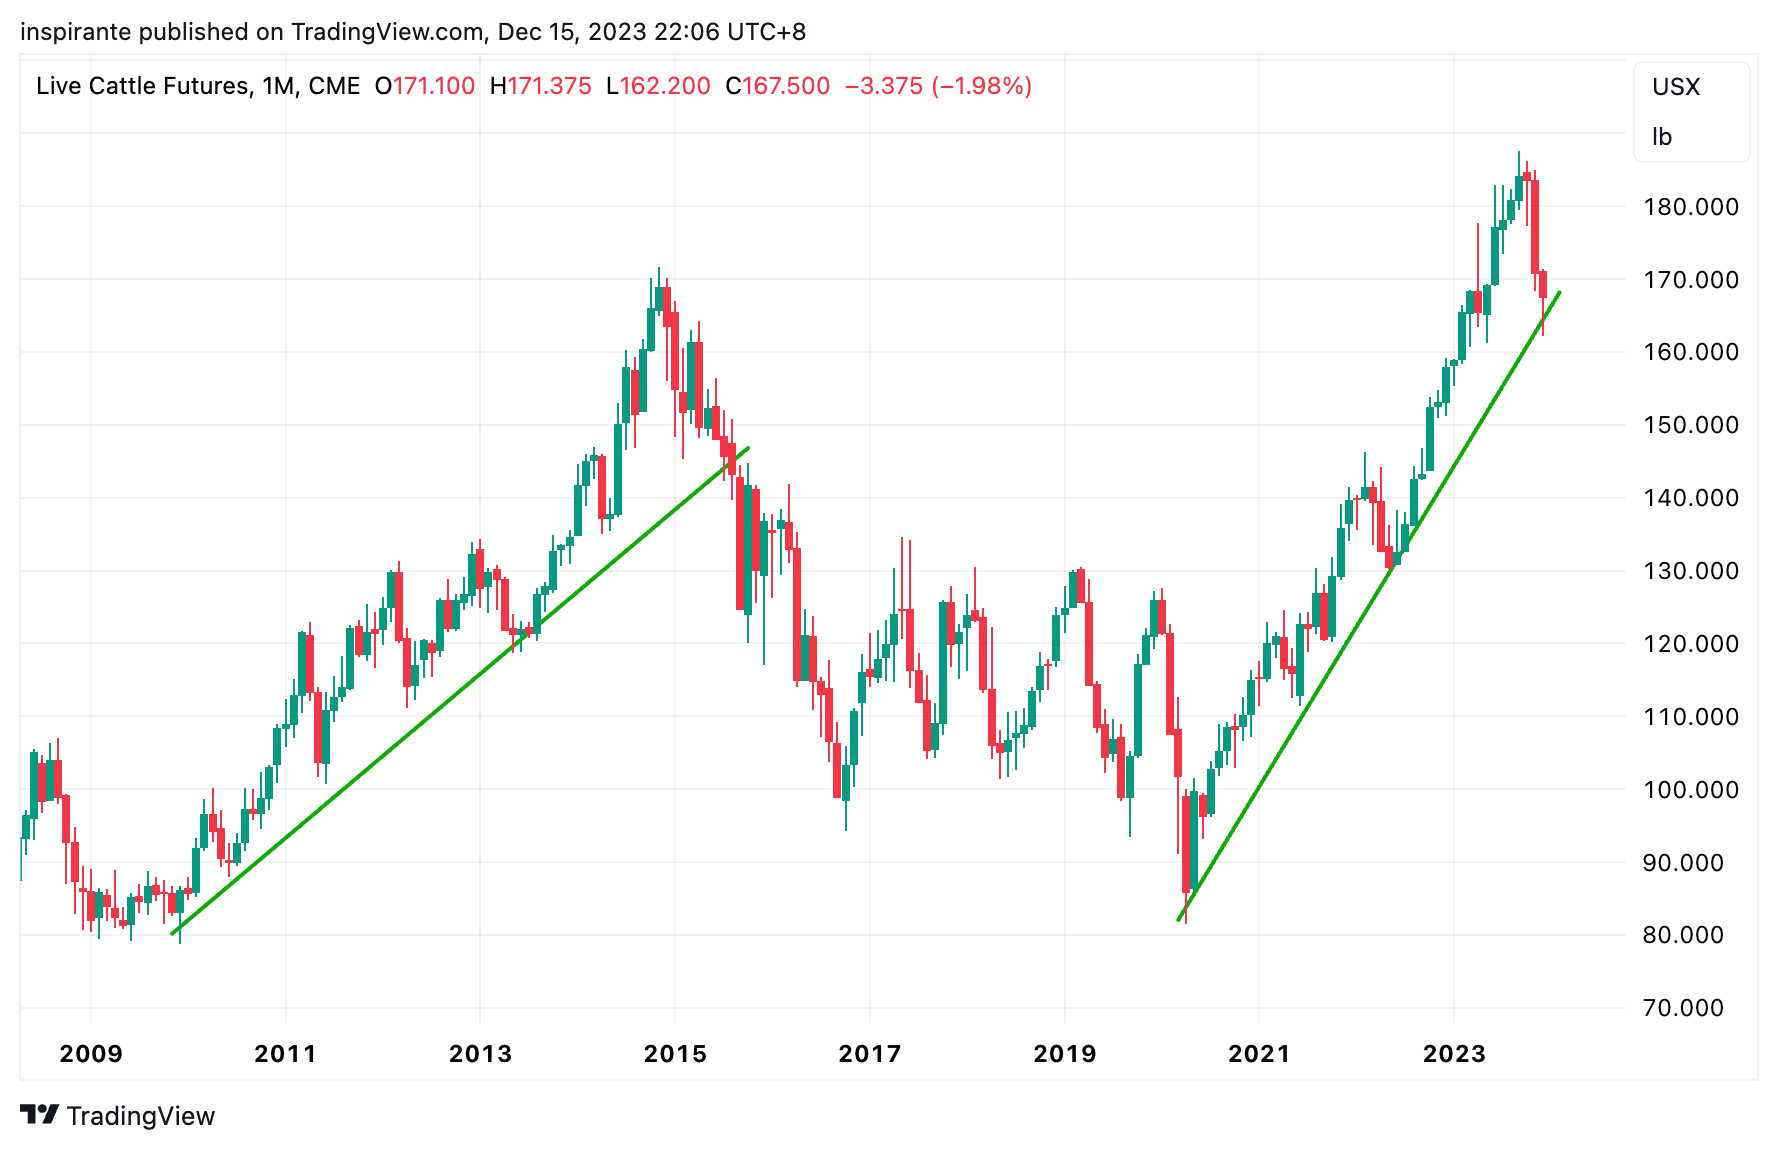
Like feeder cattle, live cattle prices have more than doubled since 2021. The recent sharp pullback tests the ongoing uptrend, exemplifying the adage that financial markets never move in a straight line.

WTI crude oil has maintained levels above 60. A significant rebound at this neckline could reintroduce inflationary pressures into the market.

Ditto for gasoline prices. It is currently at a multi-year support level, showing signs of a potential upward bounce.

Natural gas prices have sharply declined recently, driven by factors like high production levels and a relatively warmer winter. The next major support is around 2.0.
The original link is here.
EXAMPLES CITED ABOVE ARE FOR ILLUSTRATION ONLY AND SHALL NOT BE CONSTRUED AS INVESTMENT RECOMMENDATIONS OR ADVICE. THEY SERVE AS AN INTEGRAL PART OF A CASE STUDY TO DEMONSTRATE FUNDAMENTAL CONCEPTS IN RISK MANAGEMENT UNDER GIVEN MARKET SCENARIOS. PLEASE REFER TO FULL DISCLAIMERS AT THE END OF THE COMMENTARY.
 | A guest post by
|