
Bumpy road
Bumpy road
Written on 2024-03-22, first published on 2024-03-26


Markets in Focus

Inflation in the U.S. has significantly retreated from its mid-2022 peak, but similarities to inflation trends from the 1960s and 1980s suggest vigilance against potential resurgence.

The U.S. Treasury yield curve, indicated by the 2-year and 10-year spread, remains inverted at -32 bps—the longest in recent memory. While still bottoming out, it's on a trajectory toward normalization.
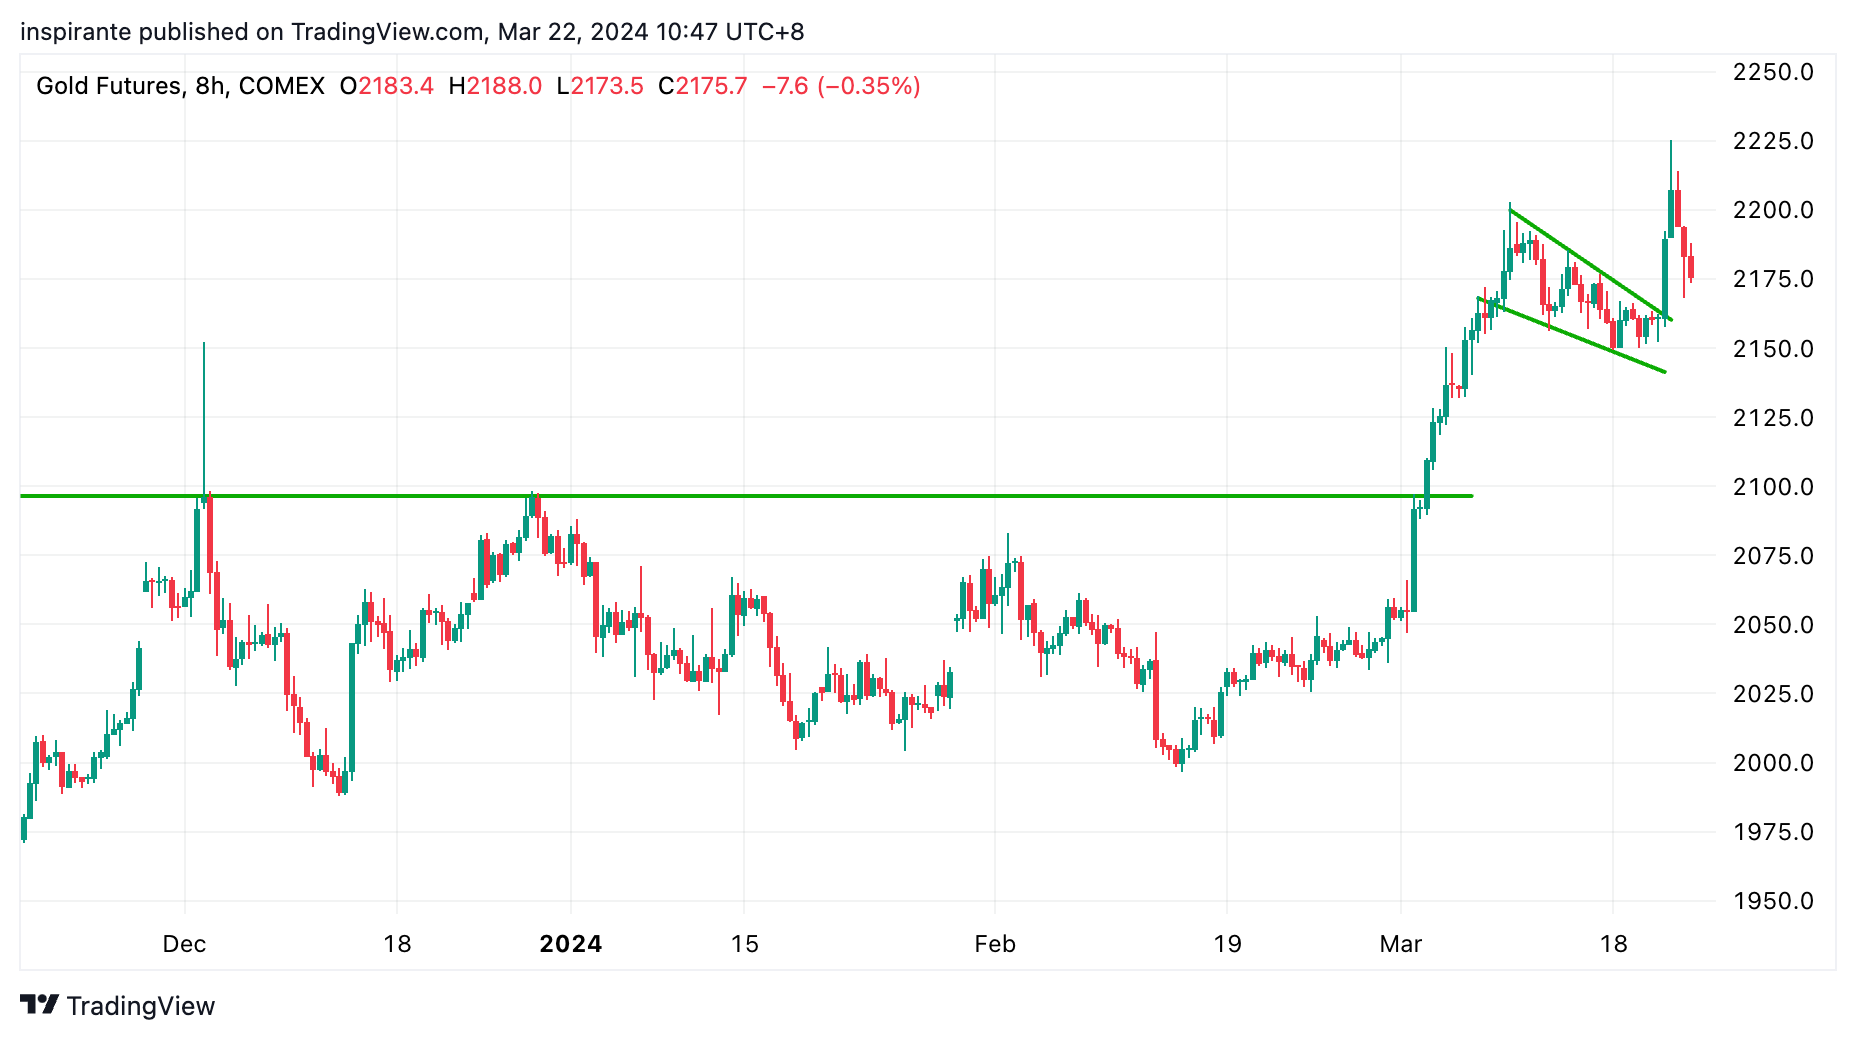
Gold's breakout from multi-year resistance suggests the end of consolidation, presenting either as a bull flag or a Hikkake pattern depending on the analysis timeframe, indicating the potential for further upward movement.

Silver's approach to a critical multi-year resistance point suggests that a breakout could confirm the commencement of a broader bull market in precious metals.
Our Market Views
"[I]nflation moving down gradually on a sometimes-bumpy road toward two percent. I don't think that story has changed… [W]e didn't excessively celebrate the good inflation readings we got in the last seven months of last year,"said Fed Chairman Jerome Powell at the latest FOMC post-meeting press conference. Such prudence is commendable, given that it might be premature for any form of celebration despite the recent favorable inflation readings.
The Great Inflation could be a flash from the past. Some readers might not have experienced the inflationary periods from the 1960s through the 1980s, characterized by three major waves. Each wave surpassed its predecessor in severity, was driven by varying causes, and met with different policy responses.
The late 1960s saw inflation driven by substantial increases in government spending, fueled by the Vietnam War and President Johnson's Great Society programs, amid strong economic growth and low unemployment that led to rising costs for labor and materials. Initially reluctant, the Fed eventually raised rates to tighten financial conditions, cooling inflation by the end of the decade and subsequently lowering rates.
The 1973 oil crisis, triggered by OPEC's embargo, caused a sharp rise in oil prices, significantly impacting global production costs and consumer prices. With the U.S. economy experiencing stagflation, the Fed, under Arthur Burns, cautiously raised interest rates, which some criticized as too timid, allowing inflation expectations to become entrenched.
The third inflation wave, starting in the late 1970s, resulted from high government spending, a loosened monetary policy earlier in the decade, and a second oil price shock, with inflation reaching as high as 19% in 1981. Under Paul Volcker's leadership, the Fed aggressively hiked rates, pushing U.S. interest rates to nearly 15% to combat inflation. Despite triggering a severe recession, these measures successfully broke the inflation cycle and lowered inflation expectations.
History may not repeat itself exactly, but it often rhymes. For investors and traders, understanding history is crucial, as market dynamics are fundamentally driven by human psychology—specifically, fear and greed—which remain constant over time. The inflation episodes of the 60s to 80s reveal notable parallels. Each wave was either precipitated or exacerbated by supply-side shocks, leading to increased production costs and prices. High government spending pushed up aggregate demand. The Fed's response played a crucial role – doing too little, too late allowed inflation to become entrenched. Finally, inflation expectations are often a self-fulling prophecy; as businesses and consumers expect inflation to rise, they adjust their behavior accordingly, often contributing to a wage-price spiral.
Viewing the current post-pandemic macro environment through this historical lens, the Fed's caution is understandable. The recent inflation mirrors the past, and while the peak of the initial wave seems to be behind us, the Fed is keen to avoid a premature easing that could trigger a "second wave." Moreover, the recent uptick in commodity prices across energy, agriculture, metals, and broader sectors suggests an increasing risk of a resurgence in inflation.
Given these considerations, we remain cautious about treasury bonds, especially those at the long end, which are more sensitive to inflation expectations. Signs of inflation resurgence could prompt a sell-off in bonds and a rise in yields. The prevailing uncertainty in financial markets and global geopolitics (2024 is a historic year of elections) strongly reinforces our preference for precious metals, especially gold. It's noteworthy to mention that during the inflationary period from the 1960s to the 1980s, gold experienced a meteoric rise from $35 to nearly $900—an almost 25-fold increase. As renowned financial writer Jim Grant eloquently stated, "Gold ought not to trade as an inflation hedge, but as an investment in monetary disorder, of which the world has plenty."
How We Express Our Views
We consider expressing our views via the following hypothetical trades1:
Case Study 1: Long U.S. 2y10y Treasury Yield Steepener
Based on our cautious view on the potential resurgence of inflation and higher yields on the long end of the curve, we would consider taking a steepener position in the U.S. 2y10y treasury yield spread. An added advantage of a steepener is that it also benefits if the front-end yield drops in the event the Fed cuts rates. We would sell one 2-year yield future (2YYH4) at the present level of 4.547 and buy one 10-year yield future (10YH4) at the present level of 4.198. The effective spread price is 4.198 – 4.547 = -0.349. We would set a stop-loss below -0.6, bringing a hypothetical maximum loss of -0.349 – (-0.6) = 0.251 points. Looking at Figure 2, if the symmetrical triangle is completed and the U.S. yield curve un-inverts and normalizes, the 2y10y spread has the potential to reach 1.3, leading to a hypothetical gain of 1.649 points. Despite the tenure, each point move in the yield futures is USD 1,000. CME has a CurveWatch tool under Treasury Analytics that tracks the key spread pairs over time, including the 2y10y.
Case Study 2: Long Gold Futures
We would consider taking a long position on gold future (GCM4) at the present level of 2180, with a stop-loss below 2140, which could bring us a hypothetical maximum loss of 40 points. Looking at Figure 3, if the short-term bull flag pattern is completed, gold has the potential to continue to climb to 2300, a hypothetical gain of 120 points. Each point move in the gold futures contract is USD 100. Micro gold futures are also available at 1/10 the size of the standard contract.
The Rearview Mirror
A look into history could help us position ourselves better for the future. This section provides a rundown of market moves across major asset classes between January and March.

A key USD liquidity indicator—central bank balance sheet minus Treasury General Account (TGA) and Overnight Reverse Repo—shows a divergence from U.S. equity performance starting late 2023, with equities rallying despite stable liquidity levels.

The Russell 2000 index has broken out from a two-year rectangular consolidation, signaling a potential catch-up phase for small-cap stocks.

The Nikkei 225 index had a parabolic rise, achieving a three-decade high, despite the Bank of Japan's recent move towards policy normalization.

USDCNH has managed to rebound from its two-year trendline support. It remains to be seen if the strength of the USD can continue.

The yield differential between the U.S. and Japan has been among the main drivers of the currency pair. With the latest Bank of Japan exiting negative interest rate policy (NIRP) and Yield Curve Control (YCC), the yield differential remained stable, but Yen continued to weaken against the Dollar.

Copper's breakout from a twenty-month symmetrical triangle exemplifies a classic bullish move after a prolonged consolidation phase.

Crude oil's potential breakout from a year-long trading range signals significant implications for broader commodity markets and inflation.

Agricultural commodities are showing signs of stabilization, with Corn's recent rebound posing questions about the sustainability of this counter-trend rally.

Soybeans are near completing a bottoming process, potentially forming an inverse Head-and-Shoulders pattern.

Soybean meal is at the cusp of breaking out from an ascending triangle bottom, suggesting a reversal after a prolonged downtrend since last November.
Original Link Here.
EXAMPLES CITED ABOVE ARE FOR ILLUSTRATION ONLY AND SHALL NOT BE CONSTRUED AS INVESTMENT RECOMMENDATIONS OR ADVICE. THEY SERVE AS AN INTEGRAL PART OF A CASE STUDY TO DEMONSTRATE FUNDAMENTAL CONCEPTS IN RISK MANAGEMENT UNDER GIVEN MARKET SCENARIOS. PLEASE REFER TO FULL DISCLAIMERS AT THE END OF THE COMMENTARY.
 | A guest post by
|