Calm Before the Storm
Written on 2024-08-23, first published on 2024-08-27
Markets in focus
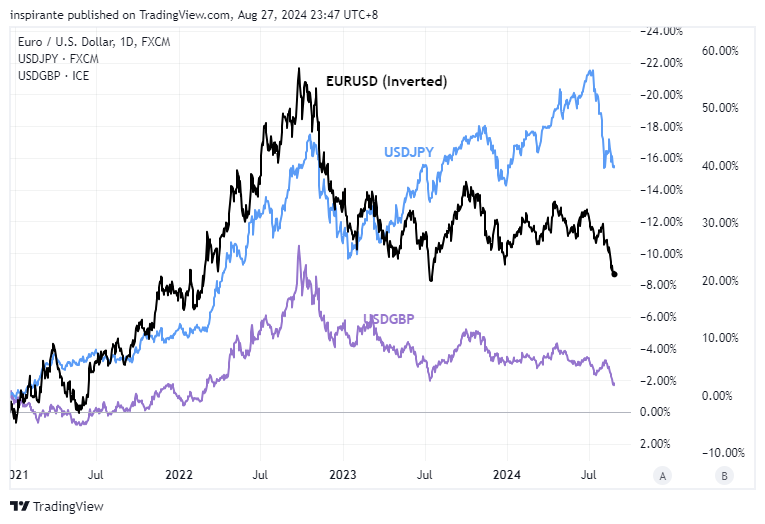
When compared against major currencies like the EUR, JPY, and GBP, the U.S. Dollar has experienced significant depreciation. This decline is evident as these foreign exchange rates against the USD approach key levels last seen before the Federal Reserve's rate hike cycle began in March 2022.
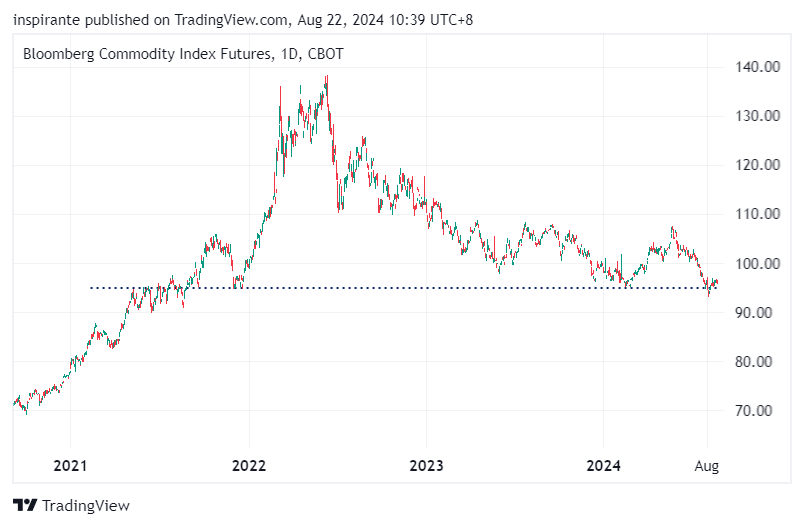
With most of the pandemic-era gains erased, the Bloomberg Commodity Index remains subdued, even as the U.S. dollar weakens.
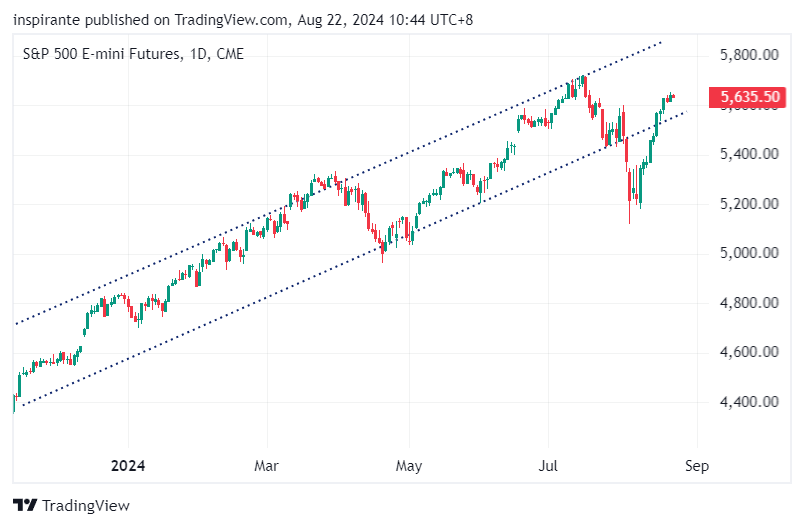
Following the early August selloff, the S&P500 rebounded with eight consecutive days of gains, returning to its upward-trending channel.
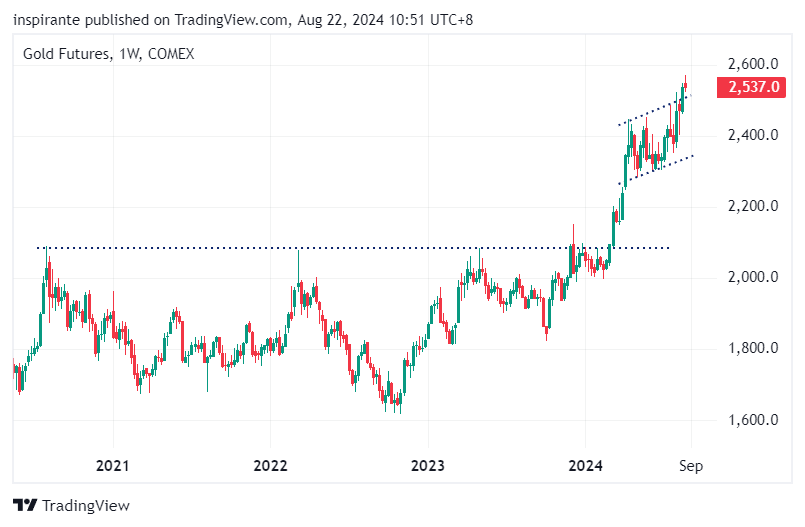
After breaking above its ascending channel, the price of a bar of gold (400 troy ounces) has officially surpassed the $1 million mark. If this breakout mirrors the strength of the one observed in March, there could be significant upside potential.
Our market views
Last week’s CPI prints add to the evidence that inflation is cooling and that the initial knee-jerk reaction to the rise in unemployment rates was an overreaction. While the panic in the market has since subsided, the U.S. Dollar, as reflected in the depreciation against various major currencies, has been weakening significantly. Historically, the dollar is inversely correlated to various asset classes across the board.
However, the market is currently at crossroads. Although many market participants anticipate that the Federal Reserve (Fed) will begin lowering interest rates in September, as seen in CME FedWatch, the underlying rationale behind this belief varies widely. Proponents of a soft-landing narrative argue that the timing for initiating a rate cut cycle is ideal, asserting that the labor market and economy remain robust. As such, a weakening dollar would have positive spillover effect on various asset classes. Conversely, those who foresee an impending recession contend that the rate cuts should have commenced earlier. They argue that the Fed’s prolonged period of restrictive monetary policy, coupled with its data-driven approach, has rendered the central bank more reactive than proactive. By waiting for clear signs of slowdown in the data, they believe the Fed has already delayed action for too long. Therefore, the subsequent economic downturn may be too severe, overshadowing any potential benefits of a weaker dollar on other asset classes. The recent downward revision of nonfarm payroll growth by over 800,000 further fuels the concerns that the Fed is falling behind the curve. This divergence in market sentiment presents an intriguing dynamic.
Commodity markets seem to be in the recession camp, with most of the pandemic-era gains erased, despite the weakness of the dollar. Given that most commodities are priced in US dollars globally, a weakening dollar could potentially drive global demand and prices higher. However, concerns over a weakening US economy, coupled with its struggling Chinese counterpart, imply broader global market weakness, limiting the potential for any meaningful increase in global demand. Despite the weakness in dollar, prices in key commodity sectors such as energy and agriculture have not responded as expected. This suggests that the historical inverse relationship between the dollar and commodity markets has been disrupted by these conflicting economic outlooks.
This uncertainty extends to U.S. equity markets as well. Following the massive unwind of carry trades due to the unemployment figures and the Bank of Japan's recent decision, the S&P 500 Index achieved an eight-day winning streak—the longest of the year. However, while the E-mini S&P 500 continues to rally toward its yearly high, the NAAIM Exposure Index, which measures in percentage the average U.S. equity exposure of active investment managers, tells a different story. As of August 14th, the index stood at 56.57, down from a last quarter average of 81.70, indicating a significant reduction in long exposure from active managers. This divergence further underscores the split sentiment in the market.
Moreover, just over a month ago, we noted a rotation of funds from large-cap to small-cap stocks. The rationale behind this rotation remains intact—lower interest rates benefit small caps more than large caps due to their smaller cash reserves. While there have been spillover effects from the broader rally, technology stocks have led the gains by a substantial margin. The Nasdaq to Russell 2000 ratio has since bounced back from the initial rotation and once again presents an increasingly lopsided market positioning.
As the market continues to grapple with competing outlooks and central banks navigate their next moves, the landscape remains uncertain. Compared to the selloff in early August, the market has shown signs of relative calm, as reflected in the relatively low values in both the VIX index and Gold CVOL index. The VIX index and Gold CVOL index, which measure the market’s expectation of volatility in equities and gold respectively, suggest that current market sentiment is less fearful. With the U.S. election predictions as divided as ever and volatility likely to re-escalate, the current lower implied volatility presents a 'calm before the storm' scenario, aka a timely opportunity to take a long position in volatility. In a market prone to overreacting to central bank decisions, data prints that bolster the soft-landing narrative could drive further rallies, while those hinting at an impending recession could trigger a sharp decline. With equal potential for upside and downside surprises, a straddle option strategy is particularly well-suited to capitalize on the opportunities presented by heightened volatility. Moreover, gold stands out as a compelling asset. In the event of a recession, gold serves as an effective hedge. If the dollar continues to weaken, the reduced opportunity cost of holding non-yielding assets like gold enhances its relative value to fiat currency. This dual role is underscored by the historical milestone that, for the first time, a single bar of gold is now worth more than one million U.S. Dollars; yet it still has strong momentum and shown no sign of reversing.
How do we express our views?
We consider expressing our views via the following hypothetical trades1:
Case study 1: Long Straddle Strategy on E-mini S&P500 Index
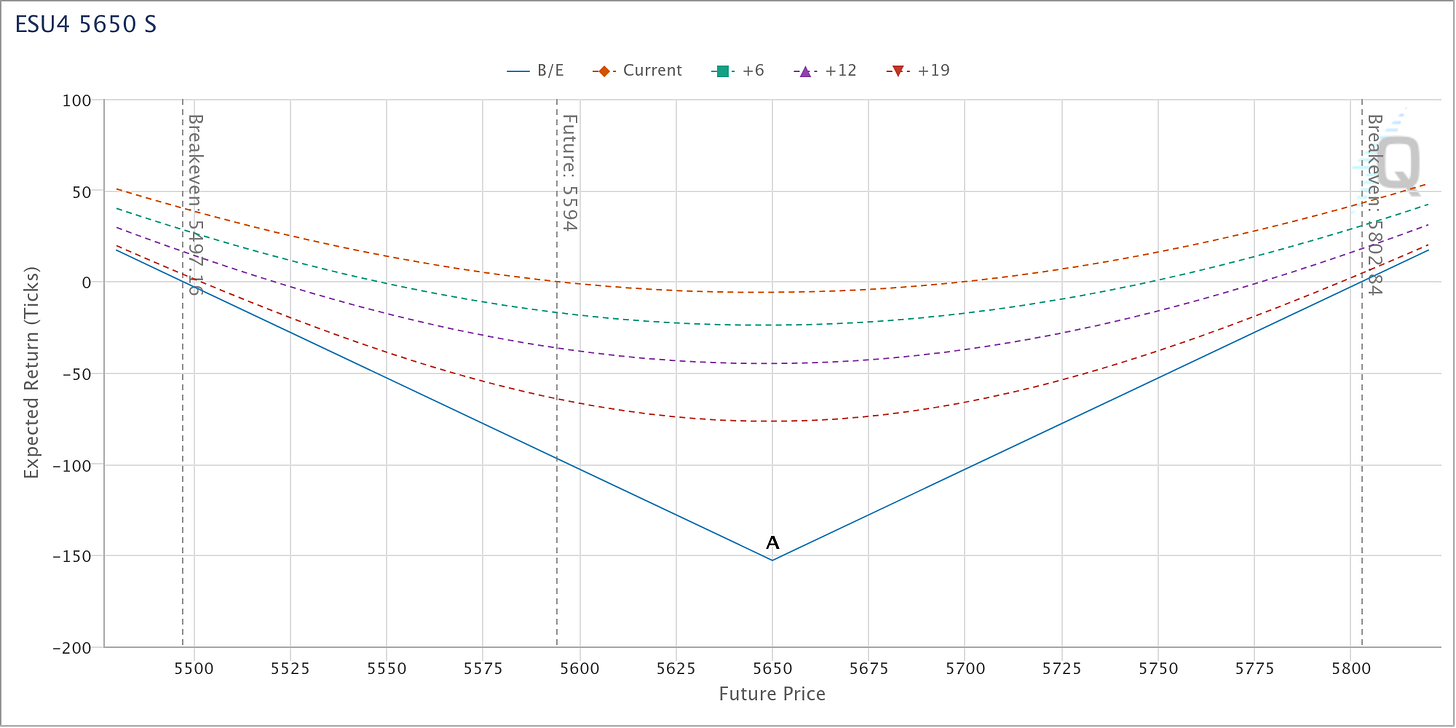
We would consider taking a long straddle position on E-mini S&P500 index futures by buying 1 E-mini S&P500 index at-the-money call option that expire in late September (ESU4 5650 C), at a premium of 48.53 points, and buying 1 E-mini S&P500 index at-the-money put option that expire in late September (ESU4 5640 P), at a premium of 104.31 points. This puts the total premium to 152.84 (=48.53+104.31) points, or 50 x 152.84 = 7642 USD, the maximum potential loss for the position. At expiration, if the E-mini S&P500 index futures price is above 5650+152.84 = 5802.84 or below 5640-152.84 = 5497.16, the position would be in profit. The payout diagram below is generated by CME QuikStrike’s Trade Example Simulator.
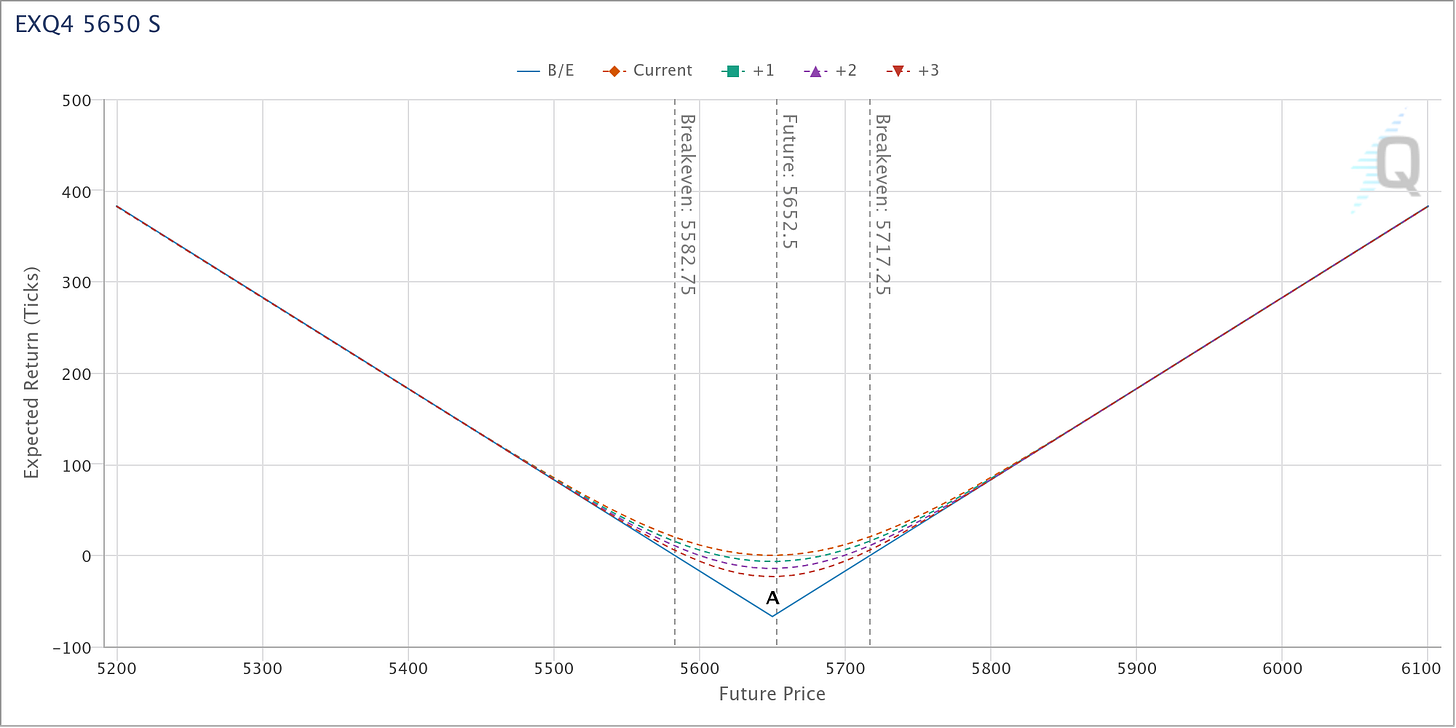
The same straddle strategy can be adopted for the Micro E-mini S&P500 index futures, which is 1/10 the size of the E-mini contract. The at-the-money call option (EXQ4 5650 C) and at-the-money put option (EXQ4 5650 P), that expire in late September, have premiums of 34.86 and 32.36 respectively. This puts the total premium to 67.22 (=34.86+32.36) points, or 5 x 67.217 = 336.10 USD. At expiration, if the E-mini S&P500 index futures price is above 5650+67.22 = 5717.22 or below 5640-67.22= 5582.78, the position would be in profit.
Case study 2: Long Gold Futures
We would consider taking a long position on Gold futures (GCZ4) at the present level of 2540, with a stop-loss below 2510, which could bring us a hypothetical maximum loss of 30 points. Looking at Figure 4, if the breakout mirrors the one in March, gold has the potential to continue to climb to 2650, a hypothetical gain of 110 points. Each move in the Gold futures contract is 100 USD. Micro Gold futures are also available at 1/10 the size of the standard contract.
Original link here.
EXAMPLES CITED ABOVE ARE FOR ILLUSTRATION ONLY AND SHALL NOT BE CONSTRUED AS INVESTMENT RECOMMENDATIONS OR ADVICE. THEY SERVE AS AN INTEGRAL PART OF A CASE STUDY TO DEMONSTRATE FUNDAMENTAL CONCEPTS IN RISK MANAGEMENT UNDER GIVEN MARKET SCENARIOS. PLEASE REFER TO FULL DISCLAIMERS AT THE END OF THE COMMENTARY.


