

Catching a Break
Written on 2025-02-06, first published on 2025-02-11


Market snapshots

The rising S&P 500 Index to Crude Oil ratio over the past few months highlights the growing disparity in market sentiment—optimism in equities, fueled by strong technological advancements, versus broader market pessimism amid potential trade tensions. The formation of an inverse cup-and-handle pattern in the ratio suggests a possible bearish reversal, which could bring market expectations into closer alignment.

The rapid rebound of USDJPY following the initial unwinding of the yen carry trade suggests that the yen remains a preferred funding currency. However, this preference appears to be waning recently.

Despite the prior uptrend in AUDJPY, which signaled a preference for selling the yen, the pair failed to break out of its multi-decade trading range and has since reversed.

Following the unwinding of the carry trade, the yen broke above its multi-year resistance line, which has now turned into support. This suggests a shift in market sentiment indicating potential yen strength.
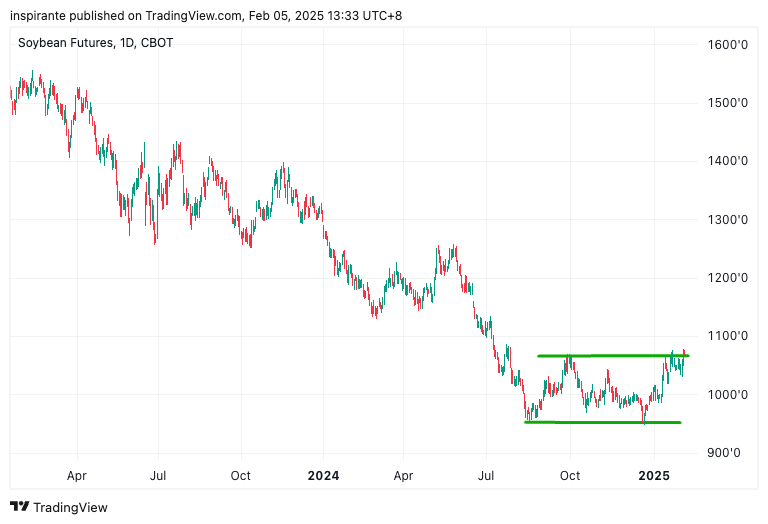
After a prolonged downtrend, Soybean has formed a double bottom and is now attempting to break above key resistance. A decisive breakout could signal the start of a strong bullish reversal.
Beyond the charts
Just two weekends into U.S. President Donald Trump’s second term, his policies have already kept markets on edge. Over the weekend, he signed three Executive Orders imposing new tariffs: a 25% duty on all Canadian goods (with energy products taxed at a lower 10%), a 25% duty on all Mexican goods, and an additional 10% duty on all Chinese imports. These measures were set to take effect just three days after the announcement, triggering a global market sell-off the following Monday.
However, following a swift response from Canadian Prime Minister Justin Trudeau, who announced 25% retaliatory tariffs on U.S. goods, and Mexican President Claudia Sheinbaum, who pledged countermeasures, led to last-minute diplomatic negotiations that delayed the Canada and Mexico tariffs by a month. Meanwhile, China unveiled its own retaliatory measures, though they were perceived as measured, likely leaving room for further trade talks. While trade tensions remain elevated, President Trump’s first term taught markets one key lesson: escalating trade tensions drive persistent policy uncertainty, making it difficult for markets to price in regulatory and geopolitical shifts.
At the start of the year, we highlighted Japan as an area with lower geopolitical risk exposure. This time, however, our focus shifts to its currency. After decades of deflation, we witness Japan entering a sustained inflationary regime, with core inflation reaching a 16-month high of 3% in December and surpassing Bank of Japan’s 2% target for the 33rdconsecutive month. This strengthens the case for further rate hikes as Japan moves toward monetary policy normalization, contrasting with other major central banks, which are leaning toward rate cuts. A narrowing interest rate differential would provide a more fundamental justification for the unwinding of yen carry trades, rather than the previous unwinding driven primarily by panic which has since reversed.
“Secretary Bessent and I confirmed we would consult closely in regards to forex,” said Japanese Finance Minister Katsunobu Kato following a video conference with U.S. Treasury Secretary Scott Bessent. Given Trump’s previous criticisms of a weak yen, calling it a “disaster” for U.S. manufacturers, we expect renewed discussions around a stronger yen. Moreover, if geopolitical tensions escalate, the yen could once again regain its safe-haven appeal. Together, these factors set the stage for yen appreciation.
From ideas to actions
We conclude with the following hypothetical trades1:
Case study 1: Long Japanese yen futures
We would consider taking a long position in the Japanese yen futures (6JH5) at the current price of 0.006595, with a stop-loss below 0.0062, a hypothetical maximum loss of 0.006595 – 0.0062 = 0.000395 points. Looking at Figure 4, the Japanese yen has the potential to rise back to its previous highs at 0.0072 and 0.0078, resulting in 0.0072 – 0.006595 = 0.000605 points and 0.0078 – 0.006595 = 0.001205 points, respectively. Each point move in the Japanese yen futures contract is 12,500,000 USD.
Case study 2: Long Soybean futures
We would consider taking a long position in Soybean futures (ZSH5) at the current price of 1077’4, with a stop-loss below 1065’4, a hypothetical maximum loss of 1077’4 – 1065’4 = 12 points. Looking at Figure 5, if the Double Bottom reversal is confirmed, soybean prices have the potential to reach 1194’4, resulting in 1194’4- 1077’4 = 117 points. Each Soybean futures contract represents 5,000 bushels and each point move is 50 USD.
Original link here.
EXAMPLES CITED ABOVE ARE FOR ILLUSTRATION ONLY AND SHALL NOT BE CONSTRUED AS INVESTMENT RECOMMENDATIONS OR ADVICE. THEY SERVE AS AN INTEGRAL PART OF A CASE STUDY TO DEMONSTRATE FUNDAMENTAL CONCEPTS IN RISK MANAGEMENT UNDER GIVEN MARKET SCENARIOS. PLEASE REFER TO FULL DISCLAIMERS AT THE END OF THE COMMENTARY.
 | A guest post by
|