Flipping through the markets
As the year draws to a close and we begin to look forward to next year, we're keeping an eye on several key themes. One such theme is the Dollar Index, which typically exhibits a recurring 3.5-year cycle. It's now nearing the end of this cycle, generally signaling an approaching bottom. This aligns with recent signals from the Fed hinting at the end of its tightening cycle.
Consequently, currencies become a fascinating space to watch, particularly as many dollar pairs are at critical technical levels. The USDCNH pair stands out as likely to be the most affected by the dollar's turn. It has clearly broken below its 2-year trend support as well as an arguable head and shoulders pattern.
The cyclical pattern isn't exclusive to the Dollar Index. When we zoom out, the USDCNH demonstrates repeated cycles, typically taking around 600 days to rise before a sharp decline to its long-term support.
The MSCI Singapore Index is now on an attempt to break higher, with prices just crossing the descending resistance level established since 2022.
Again, zooming out we find the current price level significant too as the MSCI Singapore Index is also near the long term support - a zone where prices have historically hovered before rallying. With an average rally of 108% from these support levels, current prices offer potentially attractive opportunities.
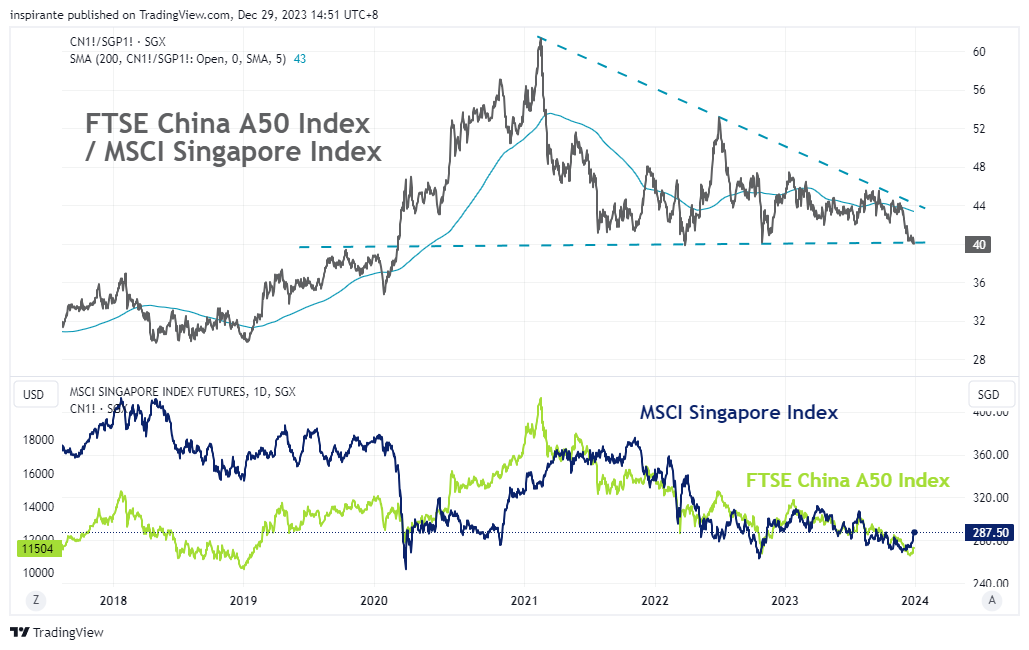
The ratio of the FTSE China A50 Index to the MSCI Singapore Index has begun to break below the descending triangle pattern it has maintained since 2020, largely propelled by the MSCI Singapore Index's recent upward movement.
What’s inside our playbook?
Instead of focusing solely on usual economic and macro-based ideas, sometimes it's enlightening to step back and view the markets through the lens of cycles and critical levels. Our attention is particularly drawn to the dollar's trajectory, especially in light of potential policy shifts from the Federal Reserve. The Dollar Index is nearing the end of its typical 3.5-year cycle, which traditionally signals an approaching bottom. The culmination of this cycle, along with the Federal Reserve's hints at potential easing of its hawkish stance, suggests the dollar may trend lower influenced by both monetary policy and cyclical factors.
As we brace for a weaker dollar, currencies tied to this movement appear compelling. Specifically, the USDCNH presents an intriguing setup marked by both a distinctive technical formation and a historical cyclical pattern. The pair has recently breached its 2-year trend support, suggesting a potential significant shift. Moreover, the cyclical behavior of the USDCNH, characterized by roughly 600-day ascents followed by sharp declines to long-term support, emphasizes the yuan pair's rhythmic nature. Given that the current rally has lasted almost exactly 600 days, a sharp downturn may be on the horizon.
Turning our focus to equity markets, we observe the MSCI Singapore Index breaking above its short-term resistance and, more critically, trading close to long-term support. Historically, rallies from these support levels have averaged a 108% increase, indicating potentially attractive opportunities at current prices. Another perspective that now looks interesting involves examining the ratio of the FTSE China A50 Index versus the MSCI Singapore Index (CN/SGP). This ratio is currently at a critical juncture, hovering near the support of a descending triangle pattern, typically indicative of a bearish continuation. A turn lower in the ratio, propelled by the MSCI Singapore Index's continued upward momentum, could be possible if historical cycles and patterns repeat.
As we conclude the final edition of the Trader's Playbook for the year, we want to extend our heartfelt thanks to all our readers for their continued support. We wish everyone a happy holiday season and a prosperous new year!
Executing the plays
A hypothetical investor can consider the following two trades1 :
Case Study 1: Short SGX USD/CNH FX Futures (UC)
We would consider going short the SGX USD/CNH FX Futures (UC) on the downward trend for the dollar and break of technical price level for the USDCNH pair. This view can be expressed using either the SGX USD/CNH FX Futures Full-Sized (UC) or Mini (MUC) contracts, where each 0.0001 move is equal to 10 CNH for the full-sized contract and 2.5 CNH for the mini contract. From the current level of 7.1107, stop at 7.2050 and take profit at 6.8700.
Case Study 2: Short SGX FTSE China A50 Index Futures (CN), Long MSCI Singapore Index Future (SGP)
We would consider taking a short position on the SGX FTSE China A50 Index Futures (CN) and Long the MSCI Singapore Index Futures (SGP) on the upward momentum in the MSCI Singapore Index as well as the formation of a descending triangle on the ratio. To roughly match the notional value of both contracts, 2 (CN) : 1 (SGP) ratio is used in sizing the trade. A short at the current level of 39.95, stop at 44 and the take profit at 30. Each 1 point move in the CN contract is 1 USD while a 1 point move in SGP is 100 SGD.
Original Link: https://www.sgx.com/research-education/market-updates/20231230-derivatives-traders-playbook-cycles-and-levels
Examples cited above are for illustration only and shall not be construed as investment recommendations or advice. They serve as an integral part of a case study to demonstrate fundamental concepts in risk management under given market scenarios.


