
Don’t Chase the Headlines
Don’t Chase the Headlines
First published on 2022-03-02


Markets in Focus
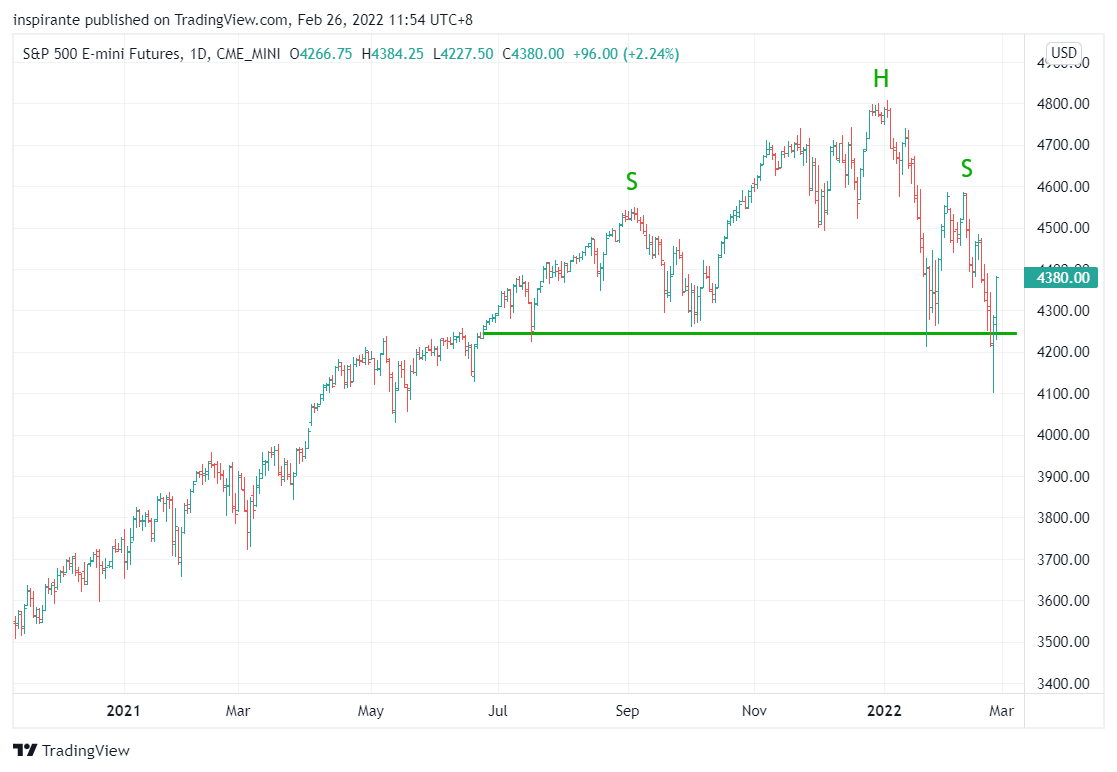
Since we published the Feb 15 issue, the S&P 500 Index had indeed formed the right shoulder on the rapid escalation of the Russian-Ukraine conflict. 4200 was the line in the sand that was broken intraday on Thursday. Fortunately for the bulls, Friday’s violent rebound saved the index from a confirmed Head-and-Shoulder break on a weekly close.
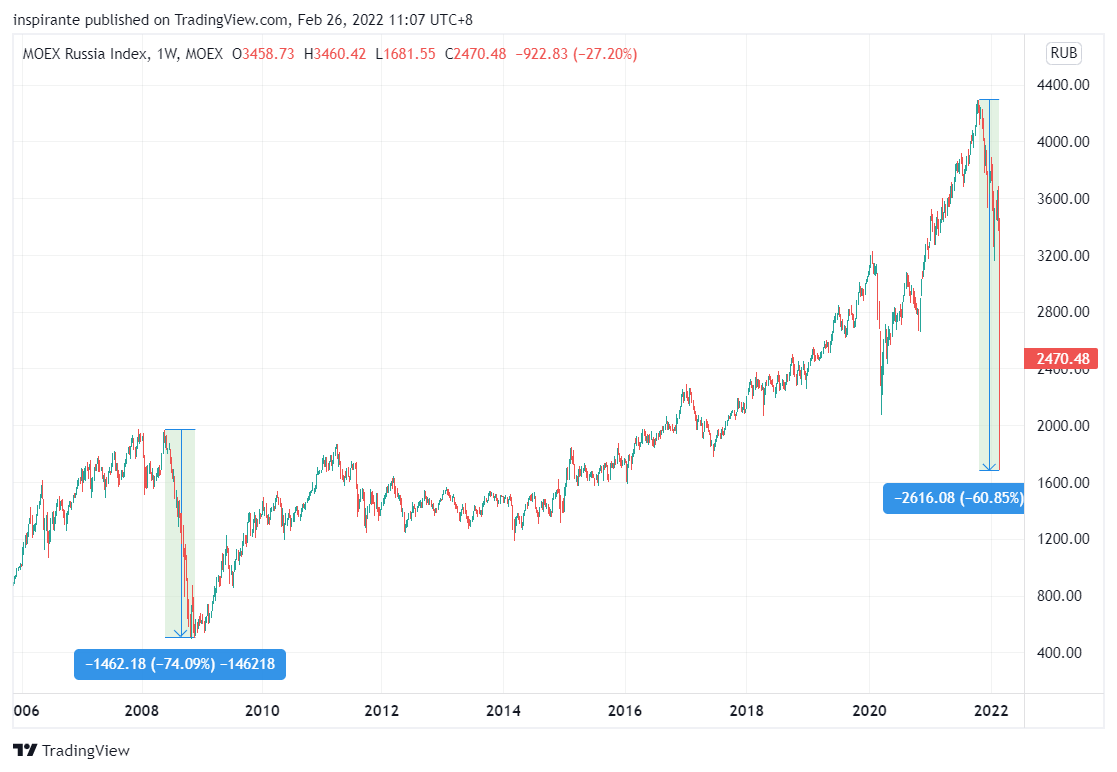
The MOEX Russia Index has had one of the largest and fastest declines in history. From the 2021 peak to last week’s trough, the index has given up more than 60%, and the bulk of the move happened in the past few days. Depending on the development of the situation, it is a possibility that potential sanctions imposed on Russia would render the country “uninvestable” to international funds. Be careful picking bottoms!
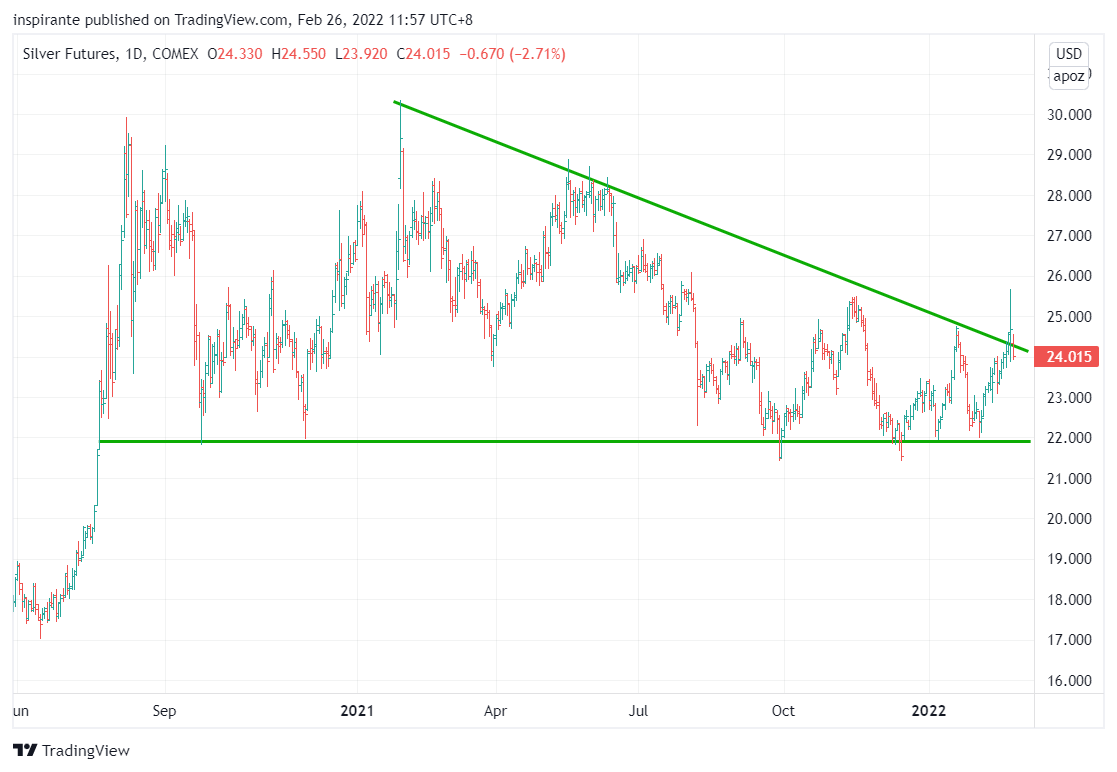
Geopolitical tensions and conflicts are conventionally bullish for safe-haven assets, especially the precious metals. Silver, for example, has been trading in a giant descending triangle since the beginning of 2021. Last Thursday, it had a massive breakout to 25.67, only to close the week at 24.05, giving up the entire Thursday’s gains.
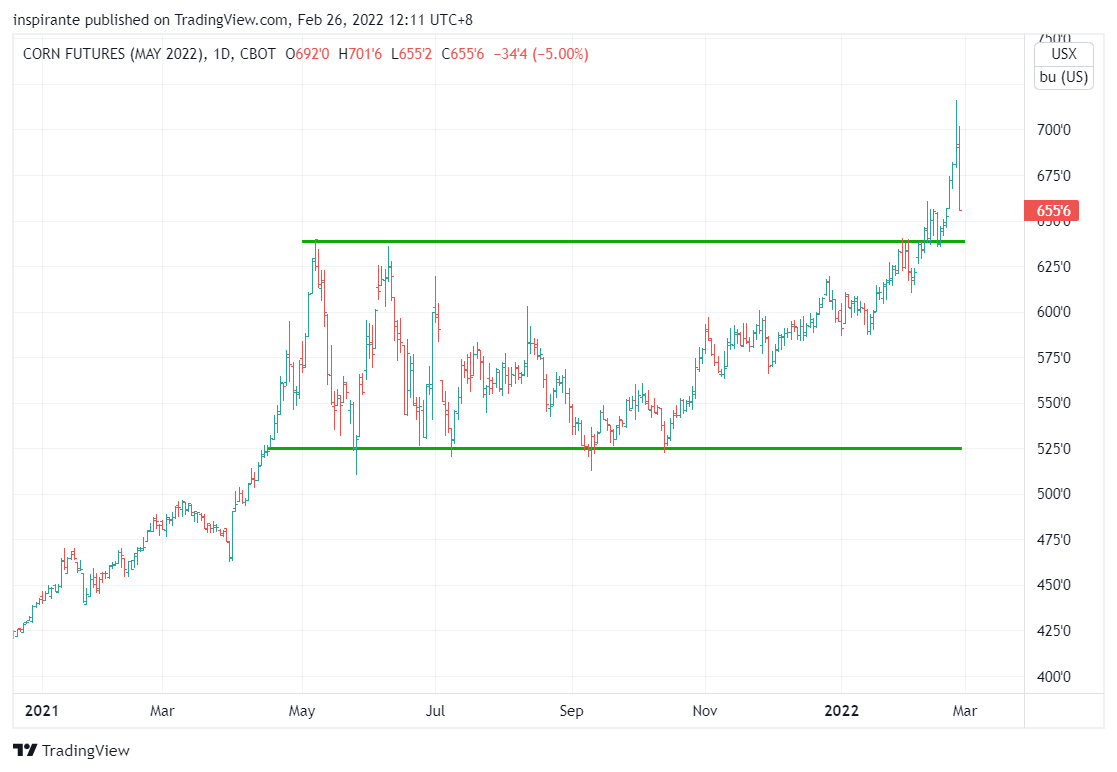
Corn experienced a similar round-trip. It went parabolic after breaking out from the ten-month trading range last week. Friday was a huge reversal day, bringing the price back to near the support level.
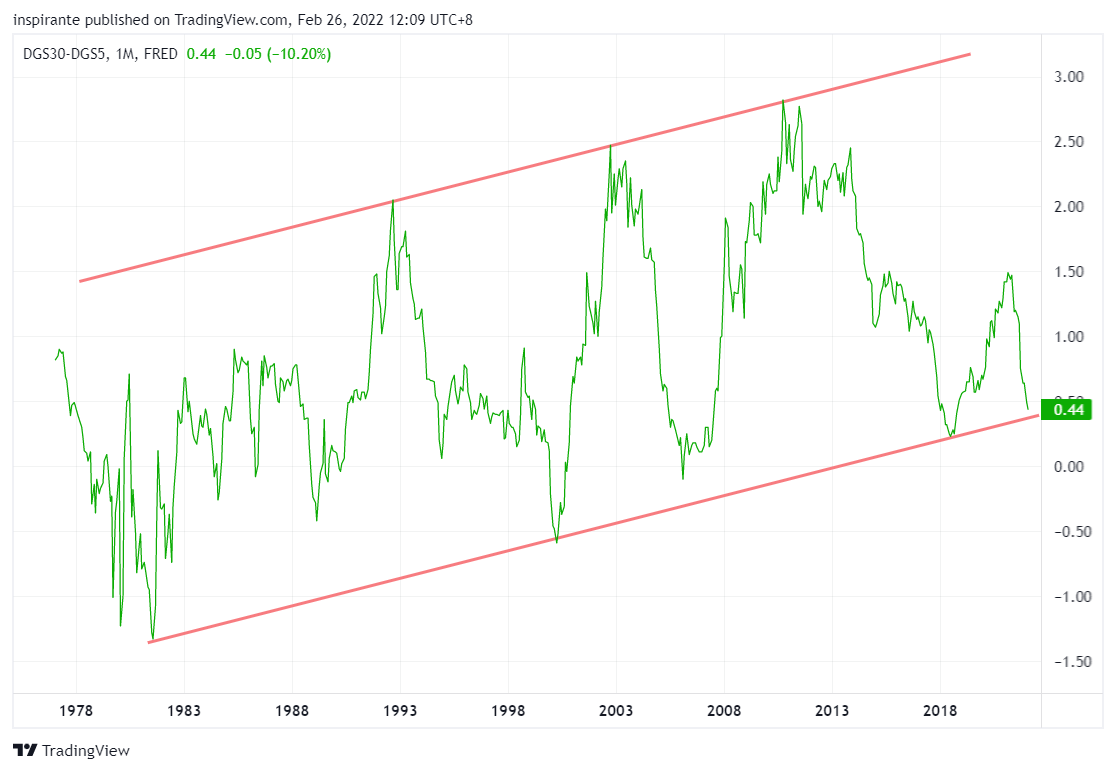
The US yield curve has relentlessly flattened since early 2021, as shown by the 30-year minus 5-year Treasury yield spread (5s30s spread). Historically, we see the yield curve reaching both the upper and lower bands of the channel for each economic cycle since the 1970s. This time, the yield curve steepening was cut short early into the recovery, when 5s30s turned down at 1.5 instead of the normal range of 2.5 – 3 before flattening.
Market Views
Don’t trade on the headlines, especially geopolitical conflicts related ones. Past week’s price actions of many assets once again proved the point.
Granted, we could see the rationale behind why precious metals and many agricultural products rallied. Geopolitical conflicts are conventionally bullish for safe-havens, and both Russia and Ukraine play important roles in global energy and grain exports. These factors, however, were hardly sufficient for putting on new trades and chasing the price on Thursday. For those who did that, Friday turned out to be a painful lesson to learn as most assets had a massive reversal day. We have remained bullish on energy and agricultural products since early last year. The recent events, if anything, are accelerants to the dominant trend of these assets.
We urge our readers to filter out the noises, look beyond the geopolitical headlines, and keep the focus on the fundamentals that truly matter to the financial market. That is, inflation has been running out of hand post-COVID recovery in most countries, and now major central banks have finally acknowledged it and are about to tighten the financial conditions quickly. They will do so via rate hikes and balance sheet reductions to curb the economy from overheating further.
Lastly, we are increasingly concerned about the US yield curve as it had continued to flatten even before Fed made the first rate hike. The market is pricing in aggressive rate hikes (higher yield on the front end) and muted growth in the future (relatively lower yield on the back end). If the equity market deteriorates further, which we believe it will, we could not help but wonder if the Fed can really pull off the rate hike plans as much as suggested by the curve front end.
How to play the theme out
A hypothetical investor can consider the following trades1:
Case Study 1: Short Micro E-mini S&P 500 Index Future
If the investor were to short the Micro E-mini S&P 500 Index future (MESH2) at around 4380 and set the stop above 4600, his maximum loss per contract would be (4600 – 4380) x 5 = 1100 USD. A measured target points to 3600, resulting in (4380 – 3600) x 5 = 3900 USD.
Case Study 2: Long US 5s30s Yield Curve Spread
If the investor were to long the US 5s30s yield curve spread at around 0.41 and set the stop below 0.2, he could sell the Micro 5-year Yield future (5YYH2) at around 1.87 and buy the Micro 30-year Yield future (30YH2) at around 2.28. His maximum loss per spread would be (0.41 – 0.2) x 1000 = 210 USD. An initial target points to 1.0 and subsequently 1.5, resulting in (1.0 – 0.41) x 1000 = 590 USD and (1.5 – 0.41) x 1000 = 1090 USD.
Original Link: https://www.cmegroup.com/newsletters/fresh-from-the-trading-room/files/fresh-from-the-trading-room-2022-03-01.pdf
Examples cited above are for illustration only and shall not be construed as investment recommendations or advice. They serve as an integral part of a case study to demonstrate fundamental concepts in risk management under given market scenarios.
 | A guest post by
|