Markets in Focus
Gold has been trading in a down channel since it registered all-time high in March 2022. As the greenback is still strengthening and real yields steadily climbing up, gold is facing multiple headwinds. The channel resistance is likely to hold and reject gold's bear market rally once again.
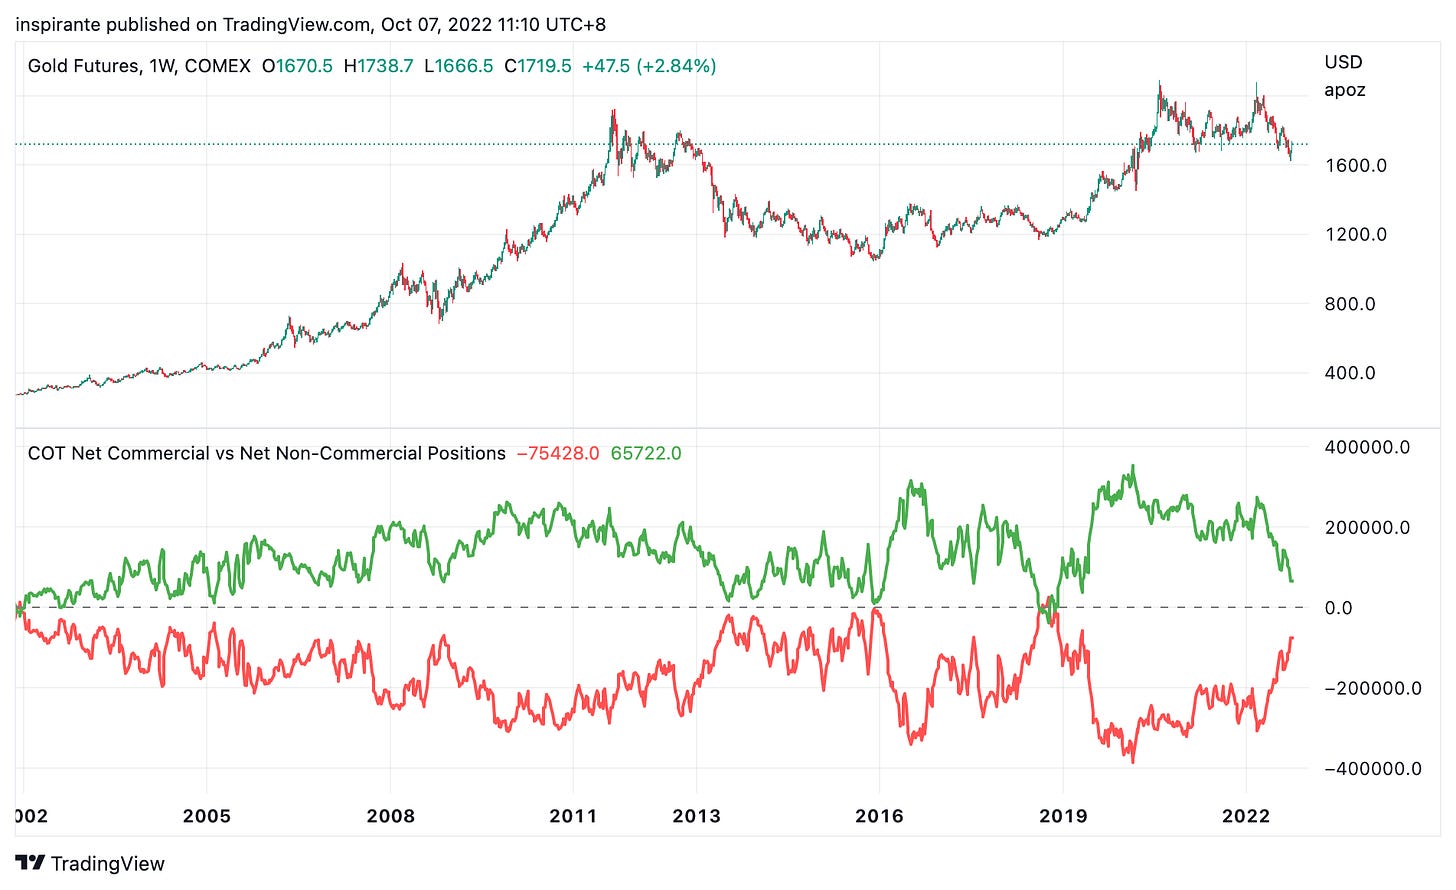
The Commitment of Traders (COT) profile of gold is approaching interesting levels. We see Commercials reducing their short positions, and Non-Commercials trimming their longs. Sometimes that marked the local bottom in gold prices, such as in late 2018. However, we are not there yet, as the current environment felt more like 2013 for gold. We may need to see more pain and more extreme COT positions before the bottom is in.
On a much longer timeframe, the US Dollar's current rally has been nothing short of spectacular. The speed of the rise surpassed the previous two major bull runs, although the magnitude is smaller thus far. As we can see from the year-over-year change and the standard score (Z-score), it is reasonable to expect some degree of consolidation or small retracement. After all, nothing moves in a straight line in the financial market.
After the Bank of Japan (BoJ) intervened in the foreign exchange market to defend the Japanese Yen for the first time in many decades, USD/JPY is back to the 145 level, which looks like the line in the sand drawn by the BoJ. Pressure is mounting as the market tests how resolute the BoJ will defend the Yen here.
Natural gas had another substantial correction back to the trendline since the beginning of the year and looks to be bouncing back up. Logistically, due to the lack of LNG ports and vessels, it is challenging for North American gas to be exported to Europe, which is in dire need after the incidents at Nord Stream 1 & 2 pipelines. Nonetheless, as the winter season approaches, we still expect a higher natural gas price in the US.
Market Views
"Inflation" is one of the most mentioned terms in media nowadays; it is no longer something we only see in History or Macroeconomics textbooks. Undoubtedly, the inflation problem has long rippled from Wall Street to Main Street. People worldwide have been impacted by the soaring prices of everyday goods and services.
Curiously, gold, which used to be discussed together with inflation, is largely missing from the spotlight now. For some, it is the ultimate insurance outside the modern financial system. For others, a useless barbaric rock. Many investors who believed that gold should do well in the current macro environment with decade-high inflation and geopolitical turmoil have been deeply disappointed by its lackluster performance in recent months. What happened? Did gold lose its shine, and will it ever shine again?
If history is any guide, we see that the price of gold is affected most prominently by the real yields. After the "Great Inflation" of the 70s, the US 10-year real yield climbed from 0.29% in 1980 to 7.46% in 1982, which brought down the gold price by nearly 60% in the same period. In the post-GFC era, the US 10-year real yield climbed from -0.71% to 1.59% from 2012 to 2014, and the gold price collapsed by more than 30%. Right now, we are likely only at the beginning of another cycle of rising real yield, which marked its low at -3.8% in March 2022. That coincided with the all-time high we saw in gold. With the rate of change in inflation slowing down and the Fed aggressively pushing up the nominal yields, the US 10-year real yield is now above -2.5%. The gold price has already given back more than 20% from the recent high.
Ben Hunt (@EpsilonTheory) once said, "Gold is an insurance policy against central bank error."1. In countries where central banks' policy responses have led to hyperinflation and massive debasement of fiat currencies, gold has worked excellently in preserving value and purchasing power for its owners. That is not the case now with many of the major central banks that are genuinely trying to tackle economic challenges with their toolkits. Facing a strong US Dollar and rising real yields, we fear the short-term outlook for gold is dim. It may experience another leg down, like in 2013, before establishing the multi-year bottom.
How to play the theme out
A hypothetical investor can consider the following trades2:
Case Study 1: Short Micro Gold Future
If the investor were to short the micro gold future (MGCZ2) at 1730 and set the stop above 1830, his maximum loss per contract would be (1830 – 1730) x 10 = 1000 USD. An initial target points to 1500 and subsequently 1100, resulting in (1730 – 1500) x 10 = 2300 USD and (1730 – 1100) x 10 = 6300 USD.
Case Study 2: Long Natural Gas Future
If the investor were to long natural gas future (NGZ2) at 7.33 and set the stop below 6.5, his maximum loss per contract would be (7.33 – 6.5) x 10000 = 8300 USD. An initial target points to 8.0 and subsequently 10.0, resulting in (8.0 – 7.33) x 10000 = 6700 USD and (10.0 – 7.33) x 10000 = 26700 USD.
Original Link: https://www.cmegroup.com/newsletters/fresh-from-the-trading-room/2022-10-12.html


Examples cited above are for illustration only and shall not be construed as investment recommendations or advice. They serve as an integral part of a case study to demonstrate fundamental concepts in risk management under given market scenarios.


