
Higher for longer?
Higher for longer?
Written on 2023-09-22, first published on 2023-09-27


Markets in focus
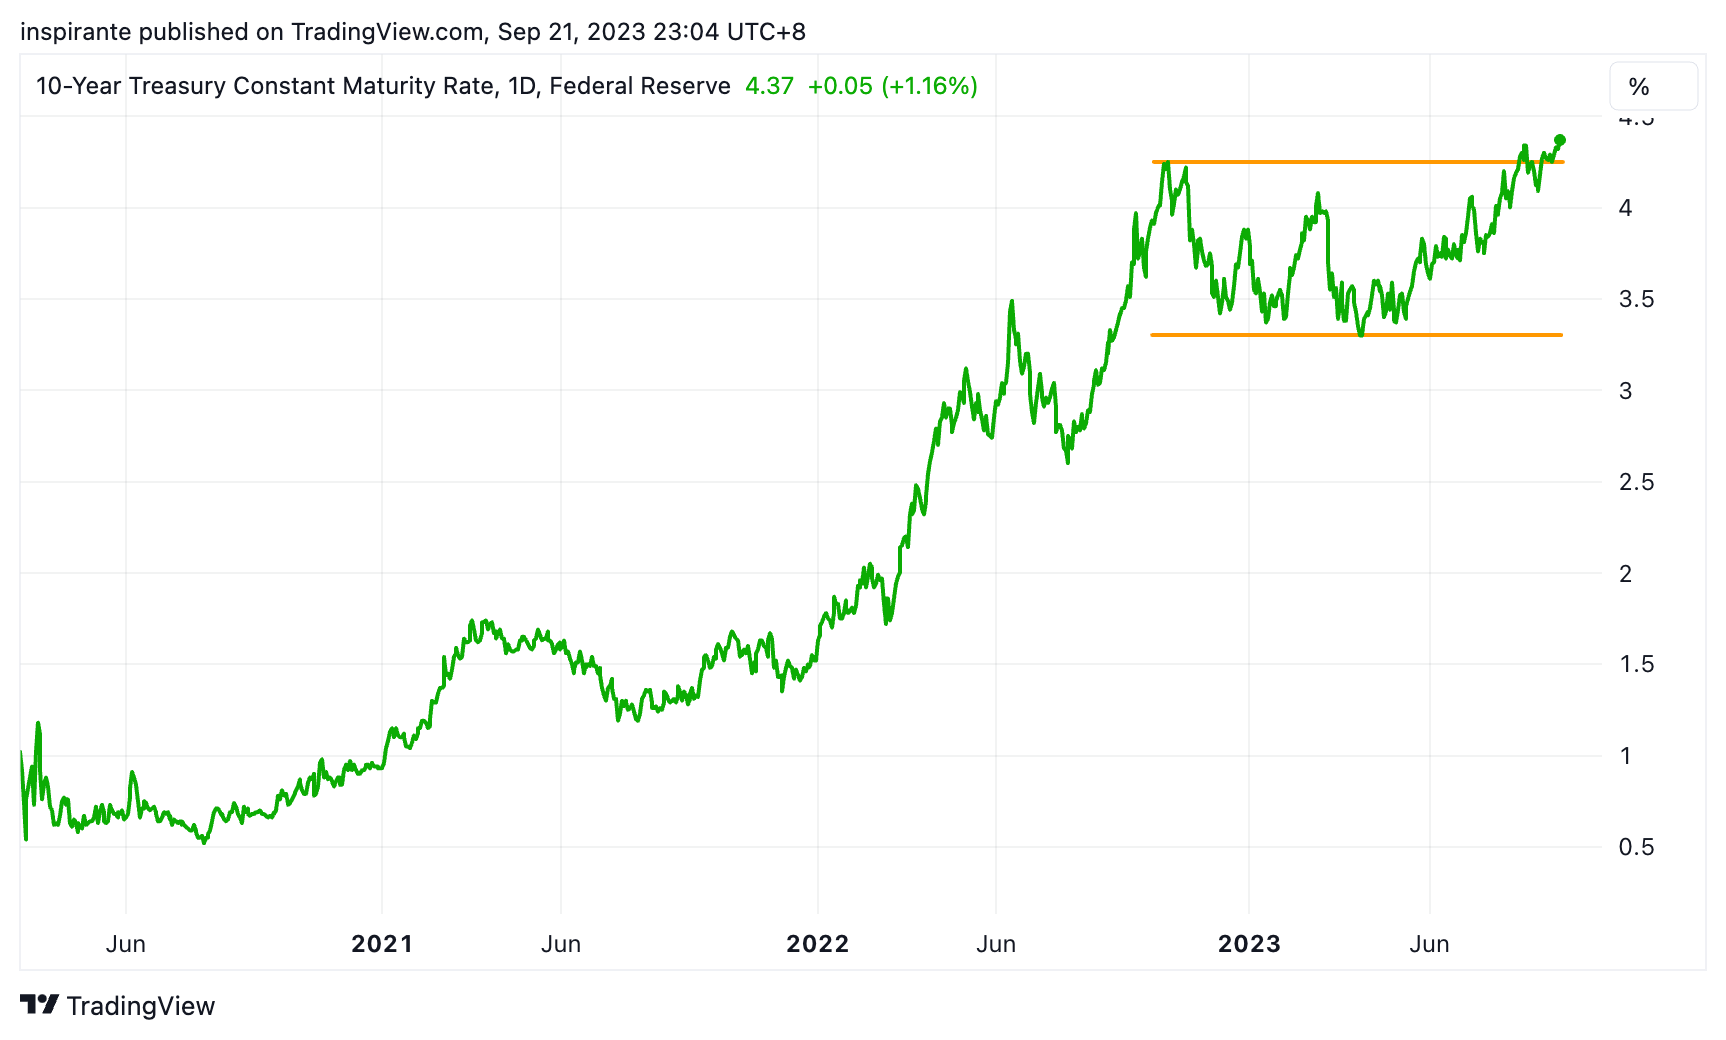
US treasury yields across all tenors have broken higher, reaching levels last seen in 2007, just before the Great Financial Crisis. For instance, the US 10-year yield wrapped up the week nudging close to 4.5%.
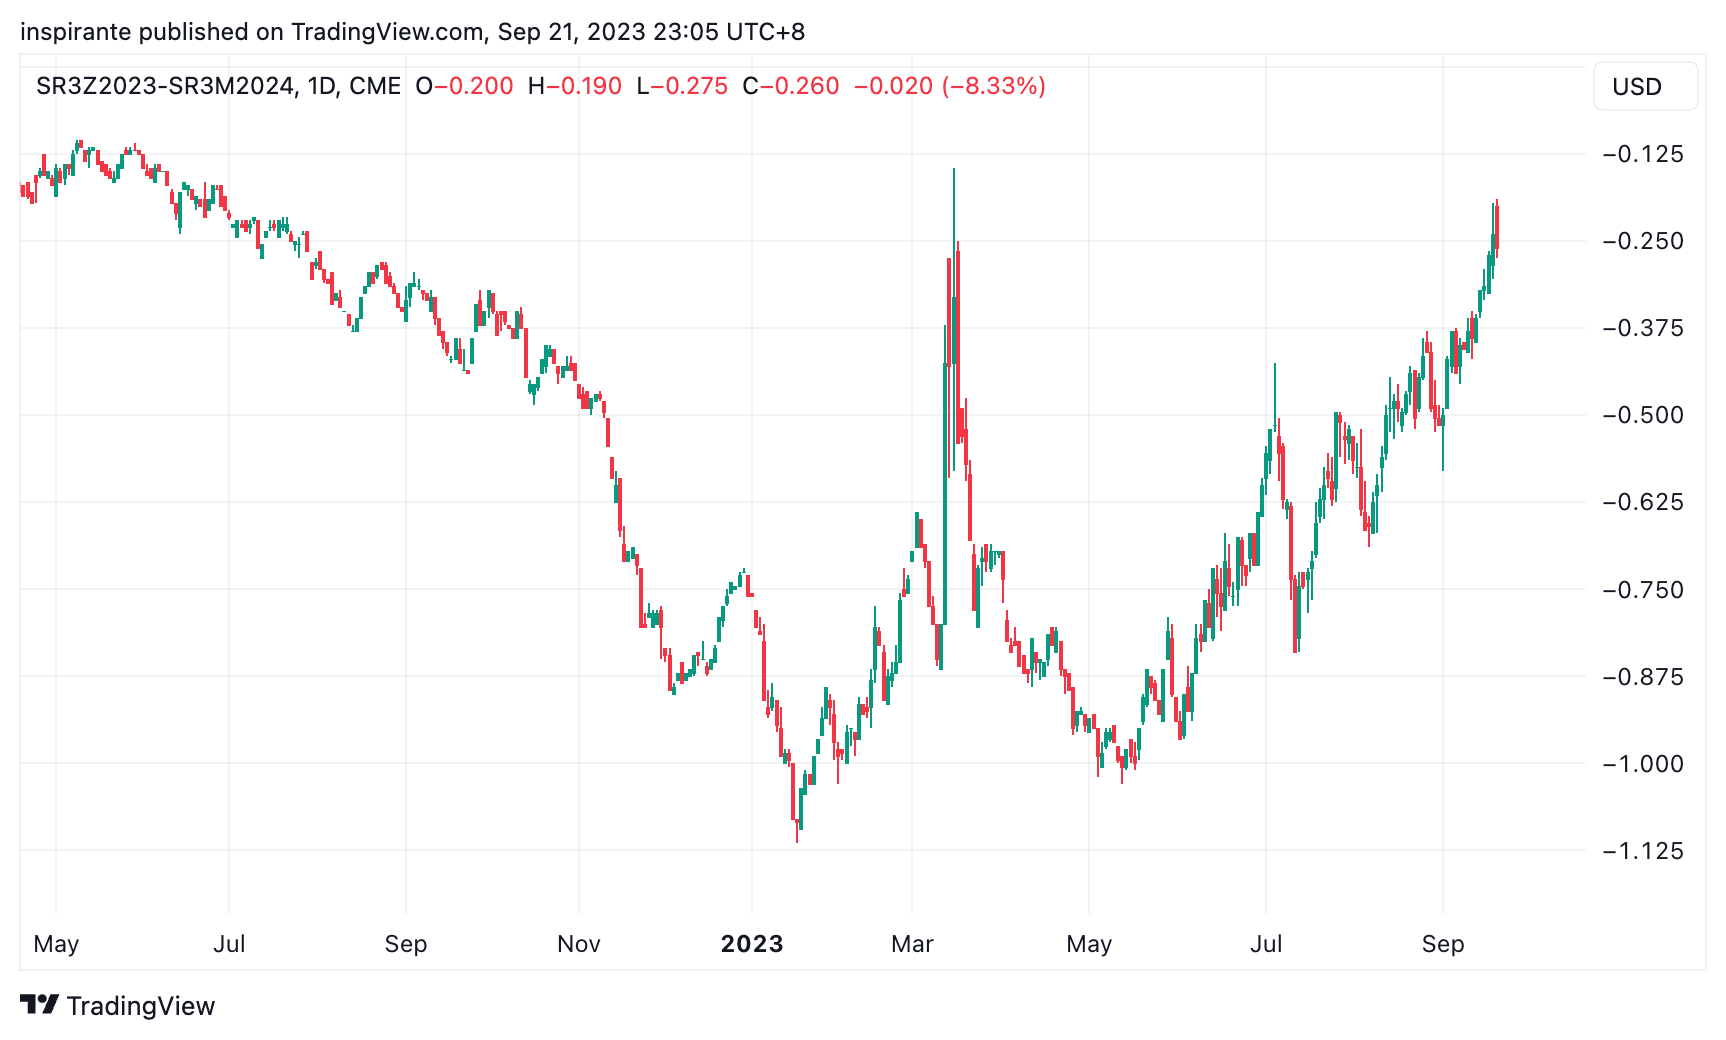
Rate cut expectations have been gradually “priced out” since May. The spread between SOFR Dec 23 and Jun 24 spread shows the market is only pricing in a 25bps rate cut from the end of 2023 to mid-2024.
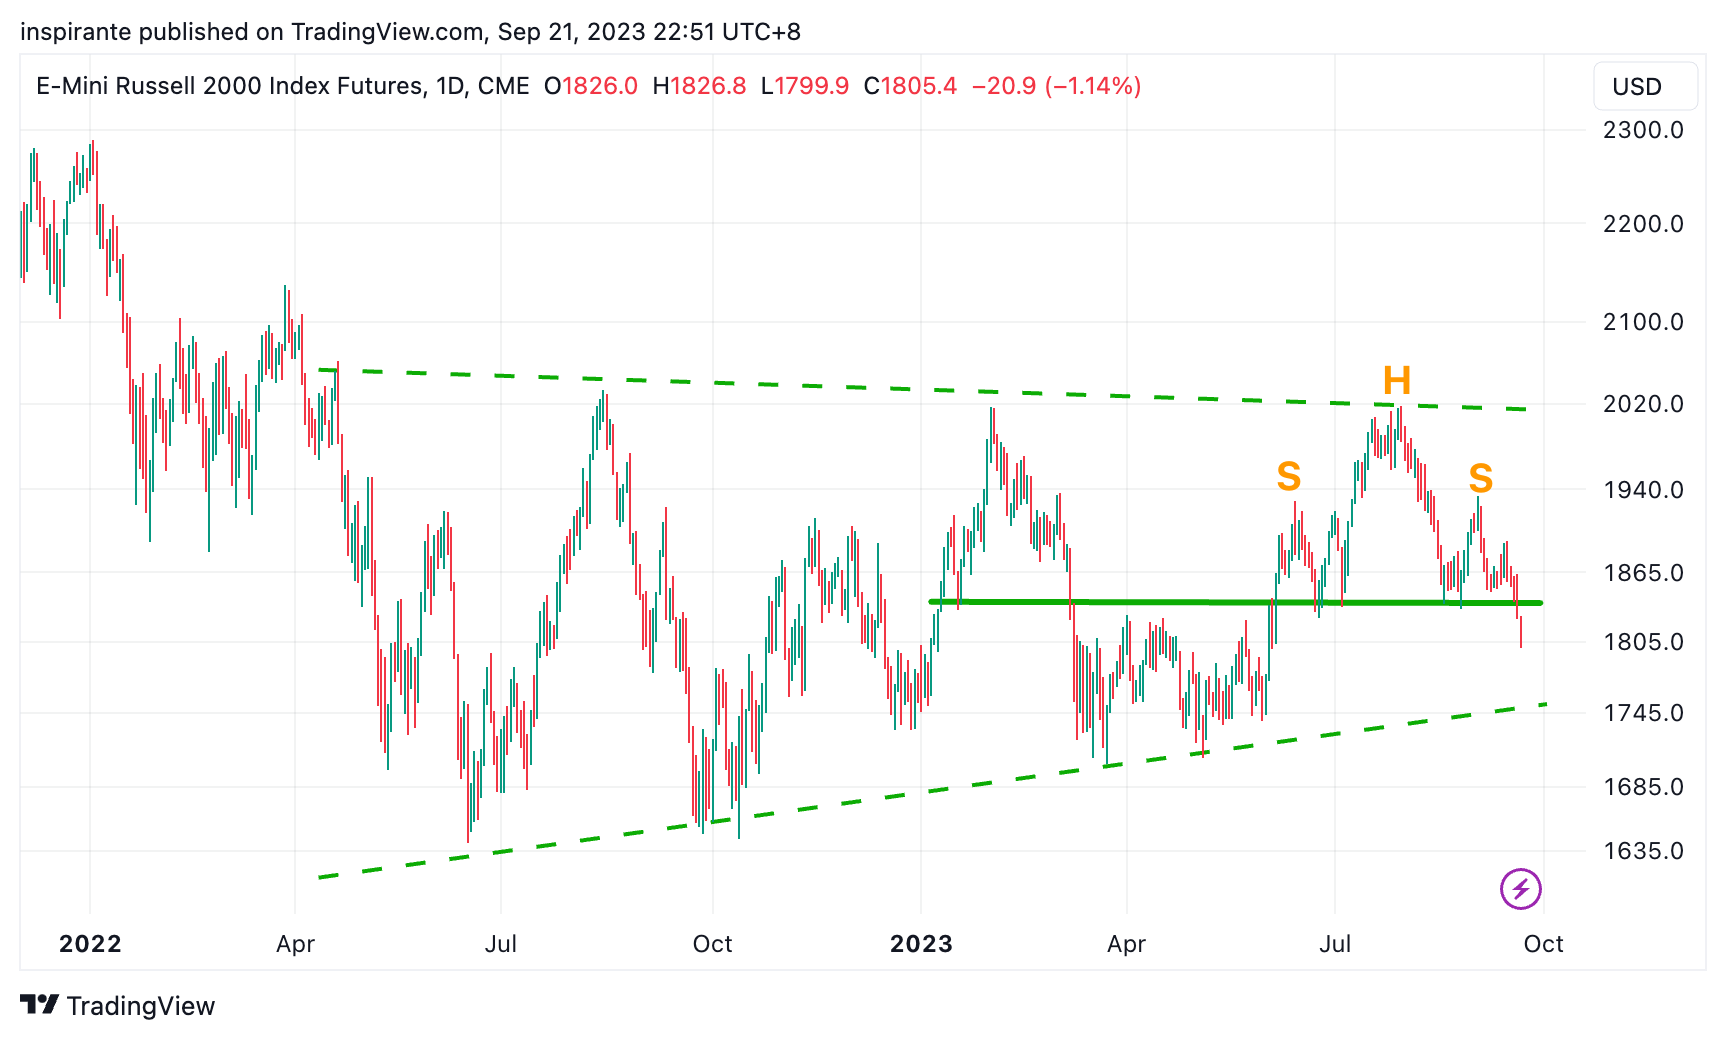
US small caps are trailing far behind their larger peers, especially the tech bigwigs. The Russell 2000 Index is still trading sideways, nowhere near its 2022 high, unlike the S&P and Nasdaq. In a “higher for longer” interest rate environment, these small caps face the headwind of huge financing costs on their existing and new debts. This contrasts starkly with mega caps, which sit on piles of cash raking in decent risk-free returns.
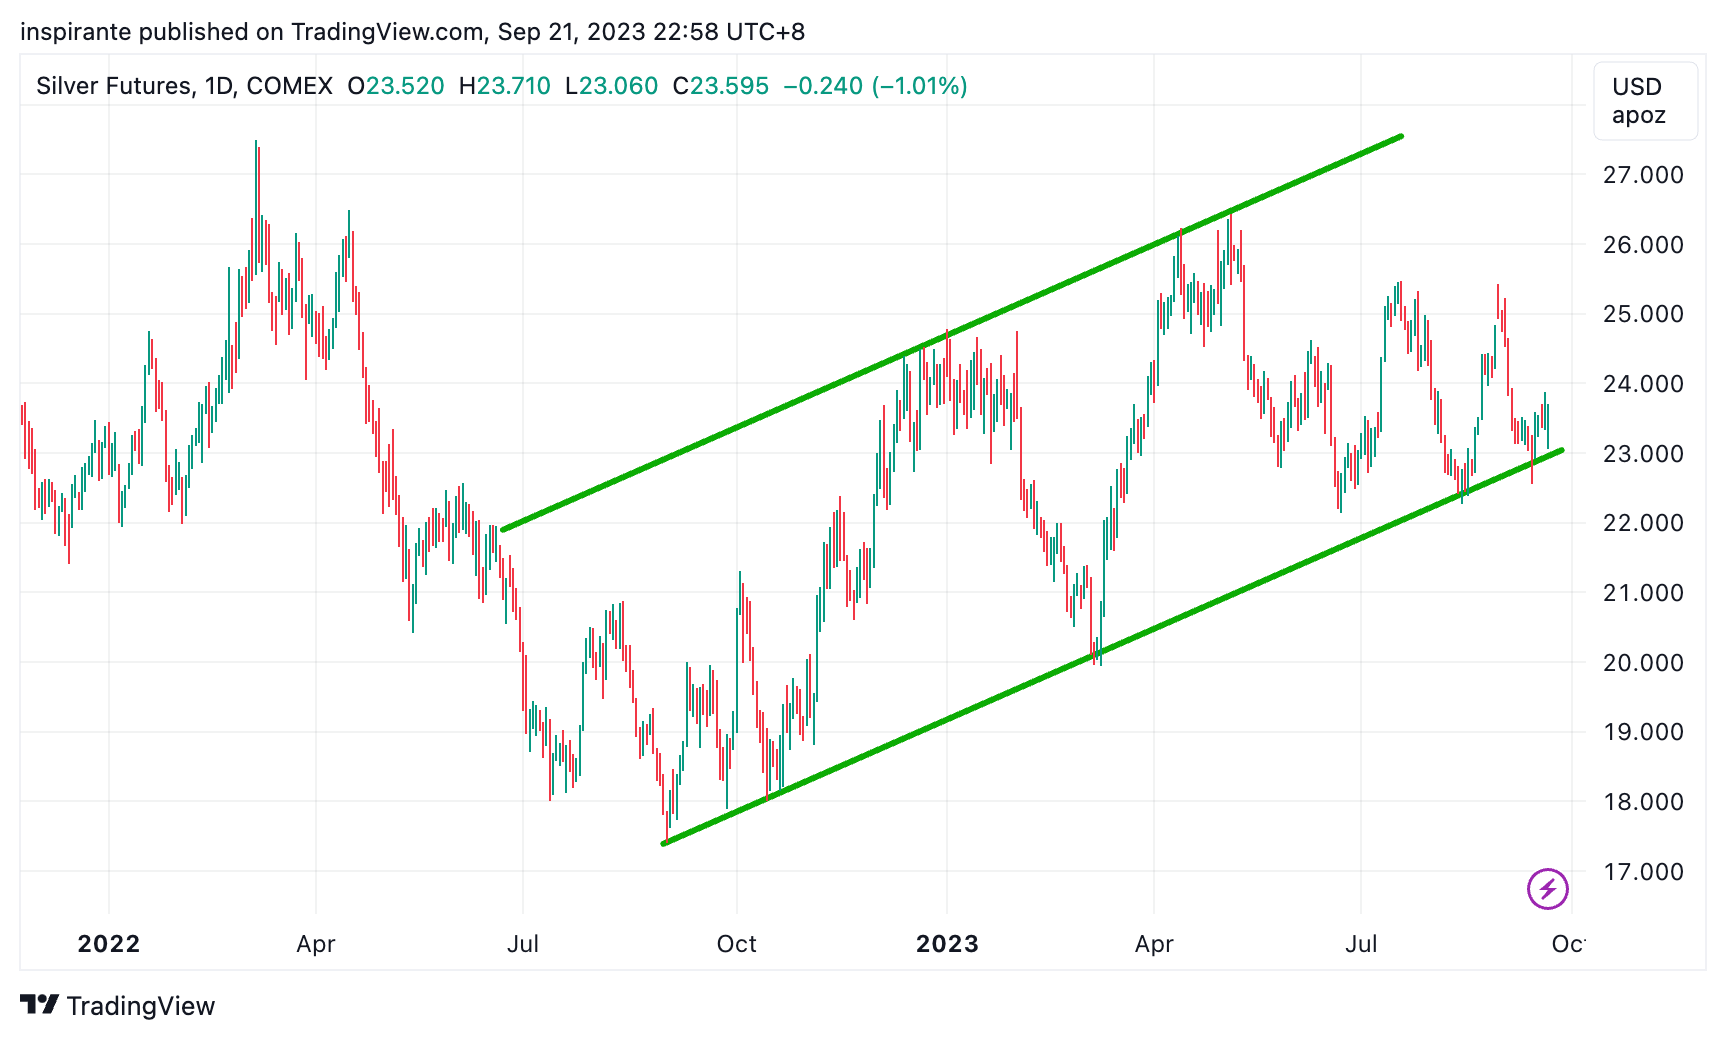
Silver has been trading in a well-defined uptrend channel for more than a year. The channel support has successfully reversed price declines multiple times. Currently, silver has bounced back once again at the support. Typically, silver shines in two scenarios: when the economy sidesteps a recession and finds its mojo again, or when the US dollar takes a hit due to significant rate cuts.
Our market views
As anticipated by many, the Fed opted for a pause on its rate hike during the September FOMC meeting, indicating a probable singular 25bps hike for the remainder of this year, aligning well with market expectations. However, the market is now peering ahead, particularly curious about the policy trajectories for 2024 and 2025.
For those monitoring the Short Term Interest Rate (STIR) market, a shift has been evident since early May. The previous enthusiasm for rate cuts seems to be tempering. To illustrate, consider the SOFR Dec 23 – Jun 24 spread in Figure 2. In early May, the market projected about 100bps of rate cuts from the end of 2023 to mid-2024. Currently, this spread has contracted to approximately one 25bps rate cut. The CME FedWatch Tool offers more insight into the market expectation of changes in the Fed fund target rate, based on the Fed Funds futures pricing data.
We have consistently questioned the initial aggressive rate cut expectations, especially given the strong recovery observed in the equity market coupled with a resilient labor market. Our stance has been clear: we are navigating a novel macro regime distinctive from the previous two decades. The implication is that interest rates are poised to remain elevated for an extended period, given the Fed’s unwavering commitment to counter inflation and uphold price stability. This perspective now seems to resonate more widely, with the market not only adjusting to this new reality but also displaying confidence in the economy’s capacity to endure this extended phase of elevated rates, potentially resulting in a mild economic slowdown, a.k.a. “soft landing.”
However, we wish to emphasize a note of caution. We believe there’s a potential misinterpretation or over-simplification of the probabilities at play. In our view, the actual outcomes could be bimodally distributed. We posit that the STIR market may not just be unimodally pointing towards a soft landing with a moderate rate cut by the Fed in the coming months. The readings from the Fed Funds futures could actually be the result of two very polarized scenarios where the Fed maintains restrictive rates for a significant duration or, conversely, the economy experiences a more severe downturn, prompting the Fed to enact much more aggressive rate cuts. Given the prevailing uncertainties, both outcomes hold merit. Hence, we’re tilting our hats to this bimodal distribution as a closer-to-true picture of the market’s pulse.
If that’s indeed the case, the Fed truly finds itself on a precarious tightrope. It is hardly surprising that when Chairman Powell was asked about “soft landing” being his baseline expectation, he poured some cold water, saying, “No, I would not do that. I’ve always thought that the soft landing was a plausible outcome... ultimately, this may be decided by factors that are outside our control at the end of the day, but I do think it’s possible.” In other words, “higher for longer” is but one of the potential outcomes. It would be prudent to brace ourselves for the other where the horizon isn’t quite as bright. The two case studies below nicely capture both scenarios.
How do we express our views?
We consider expressing our views via the following hypothetical trades1:
Case study 1: short E-mini Russell 2000 Index future
We would consider taking a short position on the E-mini Russell 2000 Index future (RTYZ3) at the present level of 1805, with a stop-loss above 1865, which could bring us a hypothetical maximum loss of 60 points. Looking at Figure 3, if the H&S top is confirmed, the index has the potential to fall to 1650, a hypothetical gain of 155 points. Each point move in the E-mini Russell 2000 Index futures contract is USD 50. The micro contract (M2KZ3) can be used to express the same view, with each point only representing USD 5.
Case study 2: long silver future
We would consider taking a long position on the silver future (SIZ3) at the present level of 23.6, with a stop-loss below 22, which could bring us a hypothetical maximum loss of 1.6 points. Looking at Figure 4, if the channel support holds, silver has the potential to reach 26, a hypothetical gain of 2.4 points. Each silver contract represents 5000 troy ounces of silver. Each point move in the silver futures contract is USD 5000. The micro contract (SILZ3) can be used to express the same view, with each point only representing USD 1000.
The Rearview Mirror
A look into history could help us position ourselves better for the future. This section provides a rundown of market moves across major asset classes between July and September.
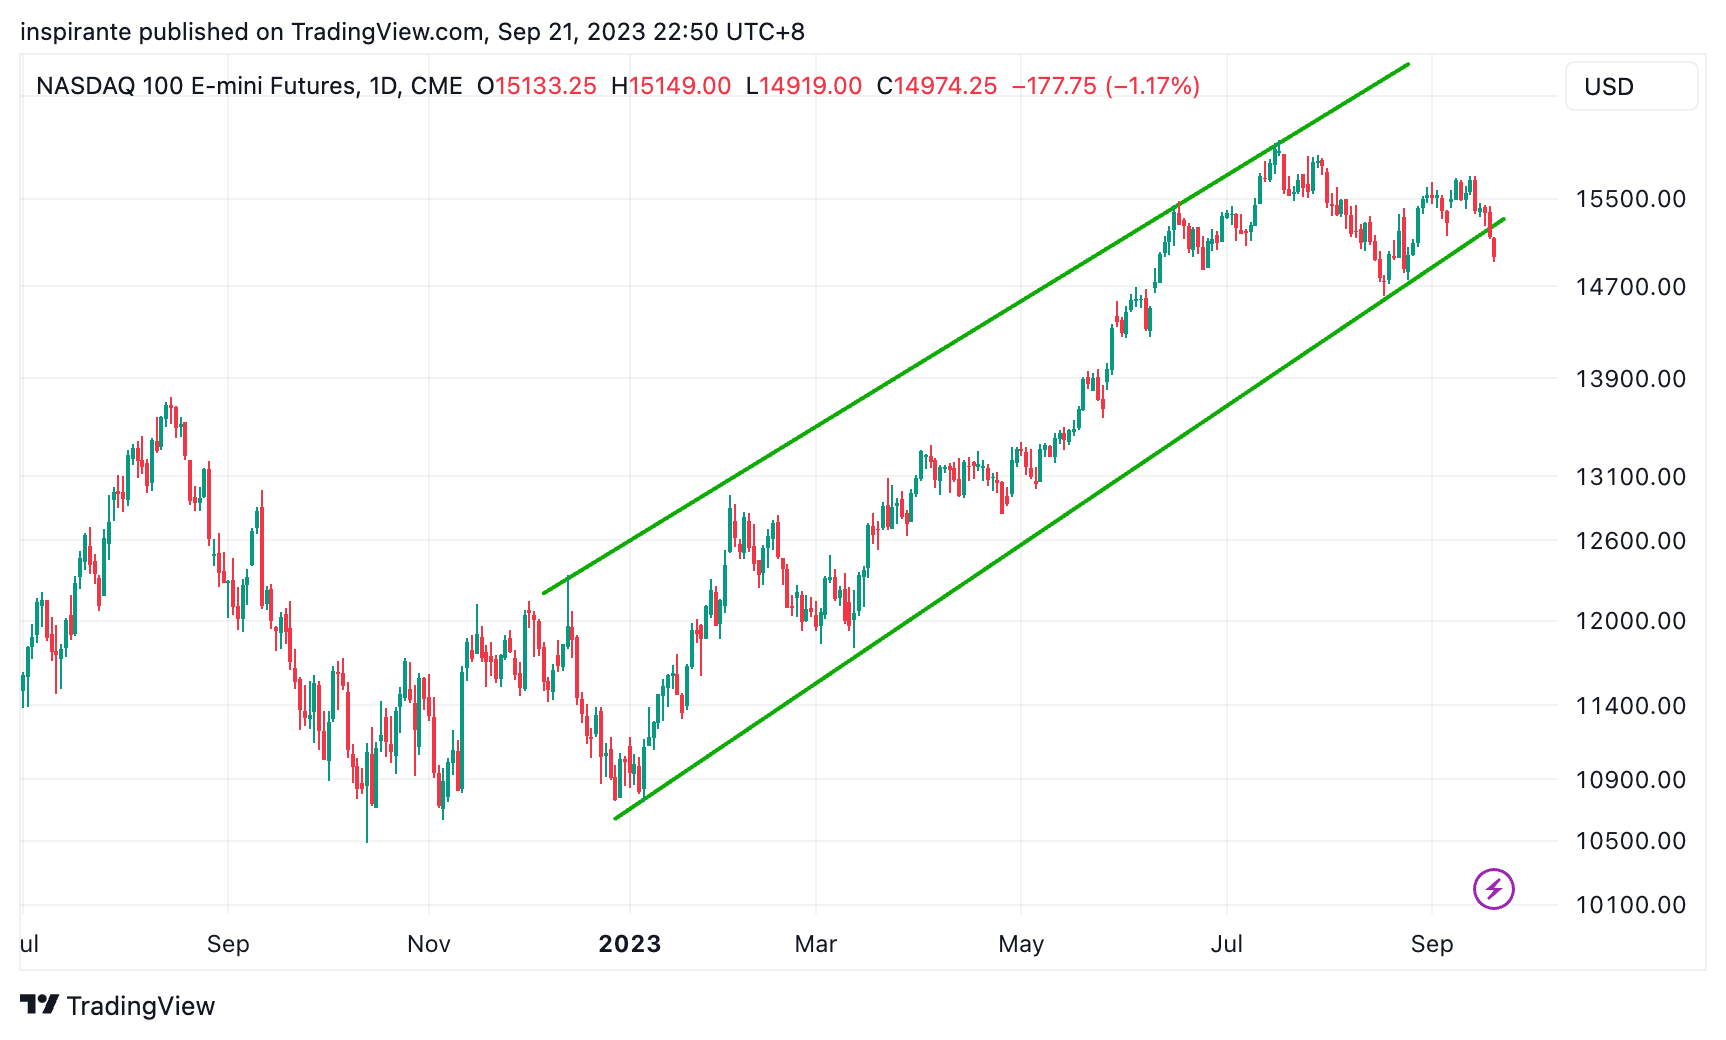
The Nasdaq’s year-long ascend took a hit, largely as big AI names like Nvidia began to cool off. Causes? A cocktail of profit-taking, a tightening macro backdrop, and the recent buzz around ARM’s IPO.
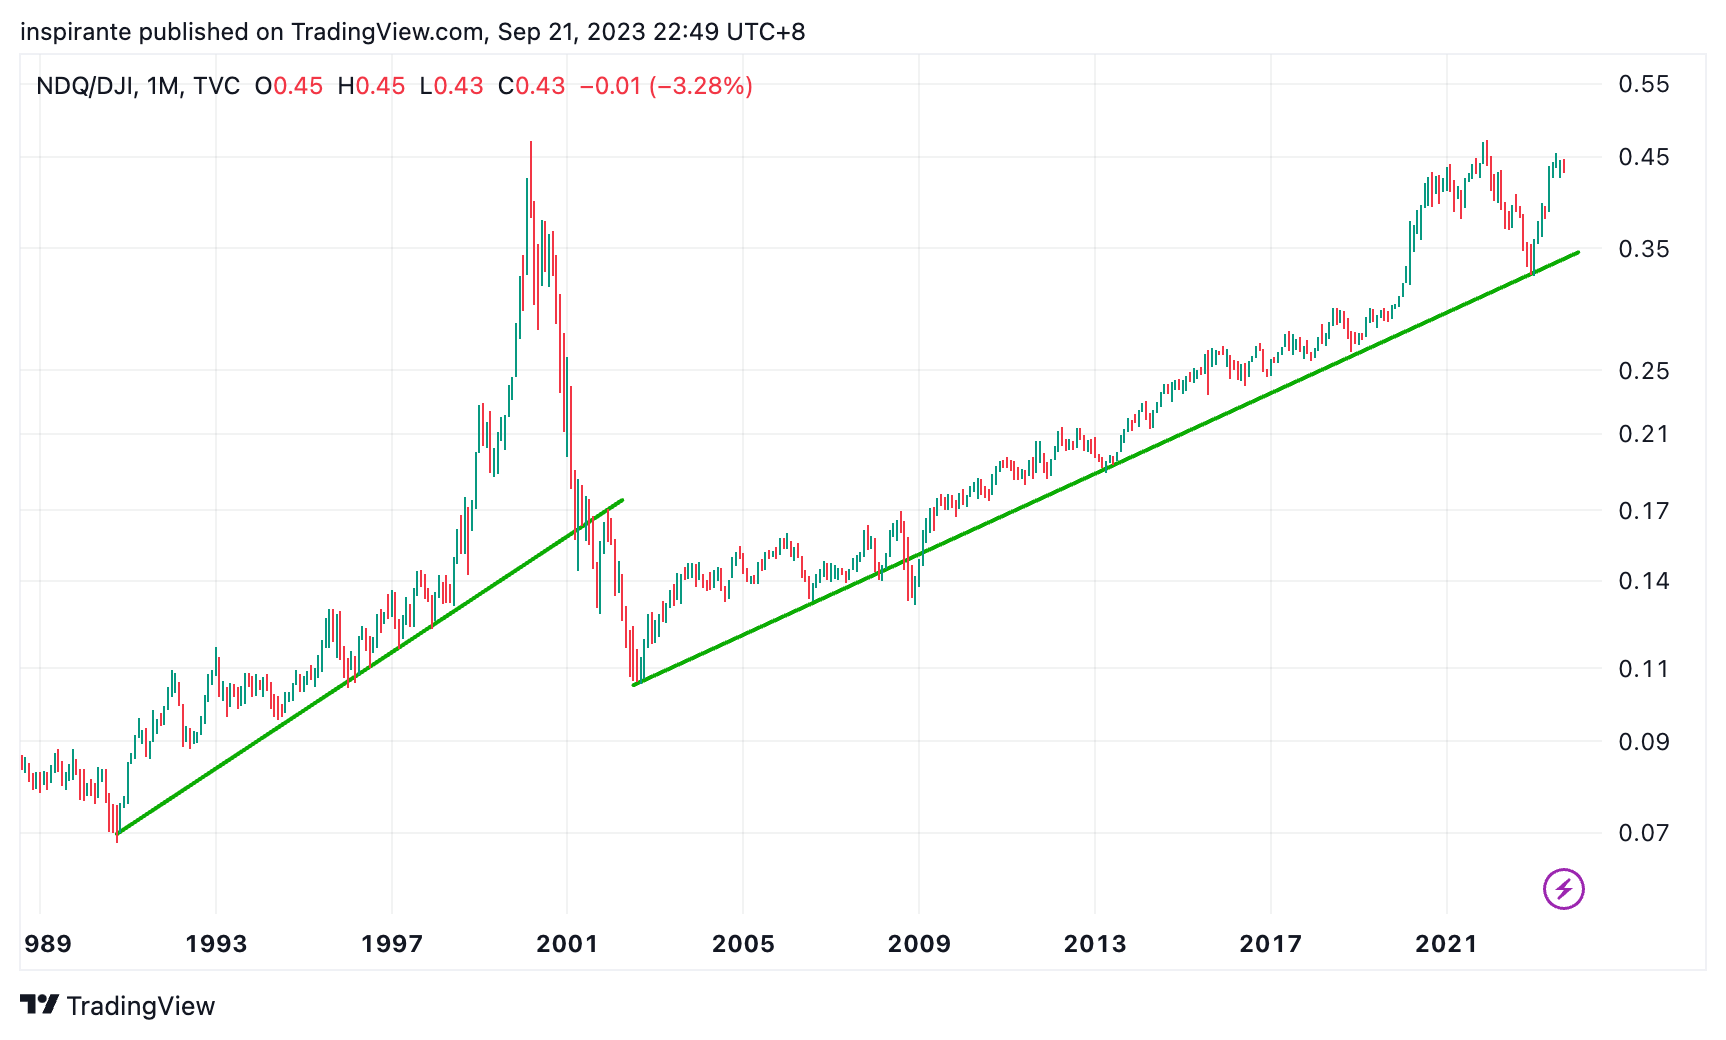
The Nasdaq to Dow Jones Industrial Average ratio, often seen as a growth/value barometer, still hovers at a historical peak. It’s worth noting, this is precisely where it stood during the DotCom bubble pop in 2000, and the 2022 market selloff.
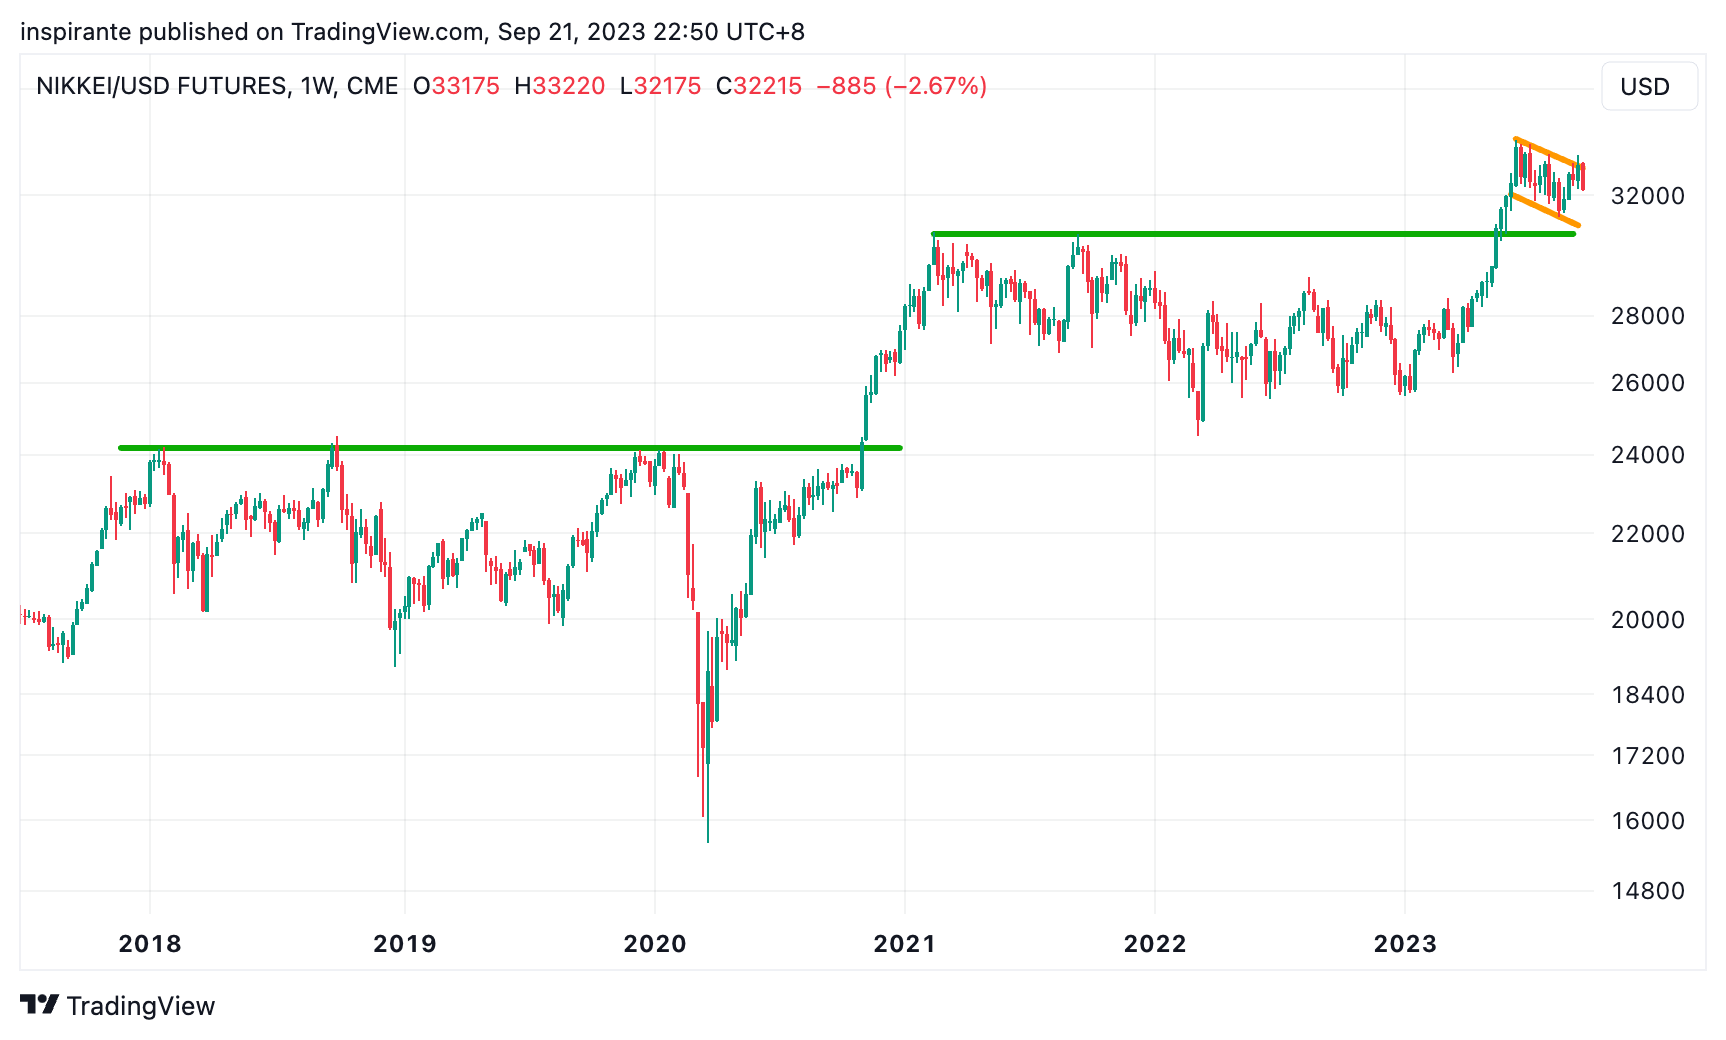
The Japanese equity market still looks constructive. It is currently consolidating in a bull flag, which is typical after a significant breakout from a multi-year resistance.
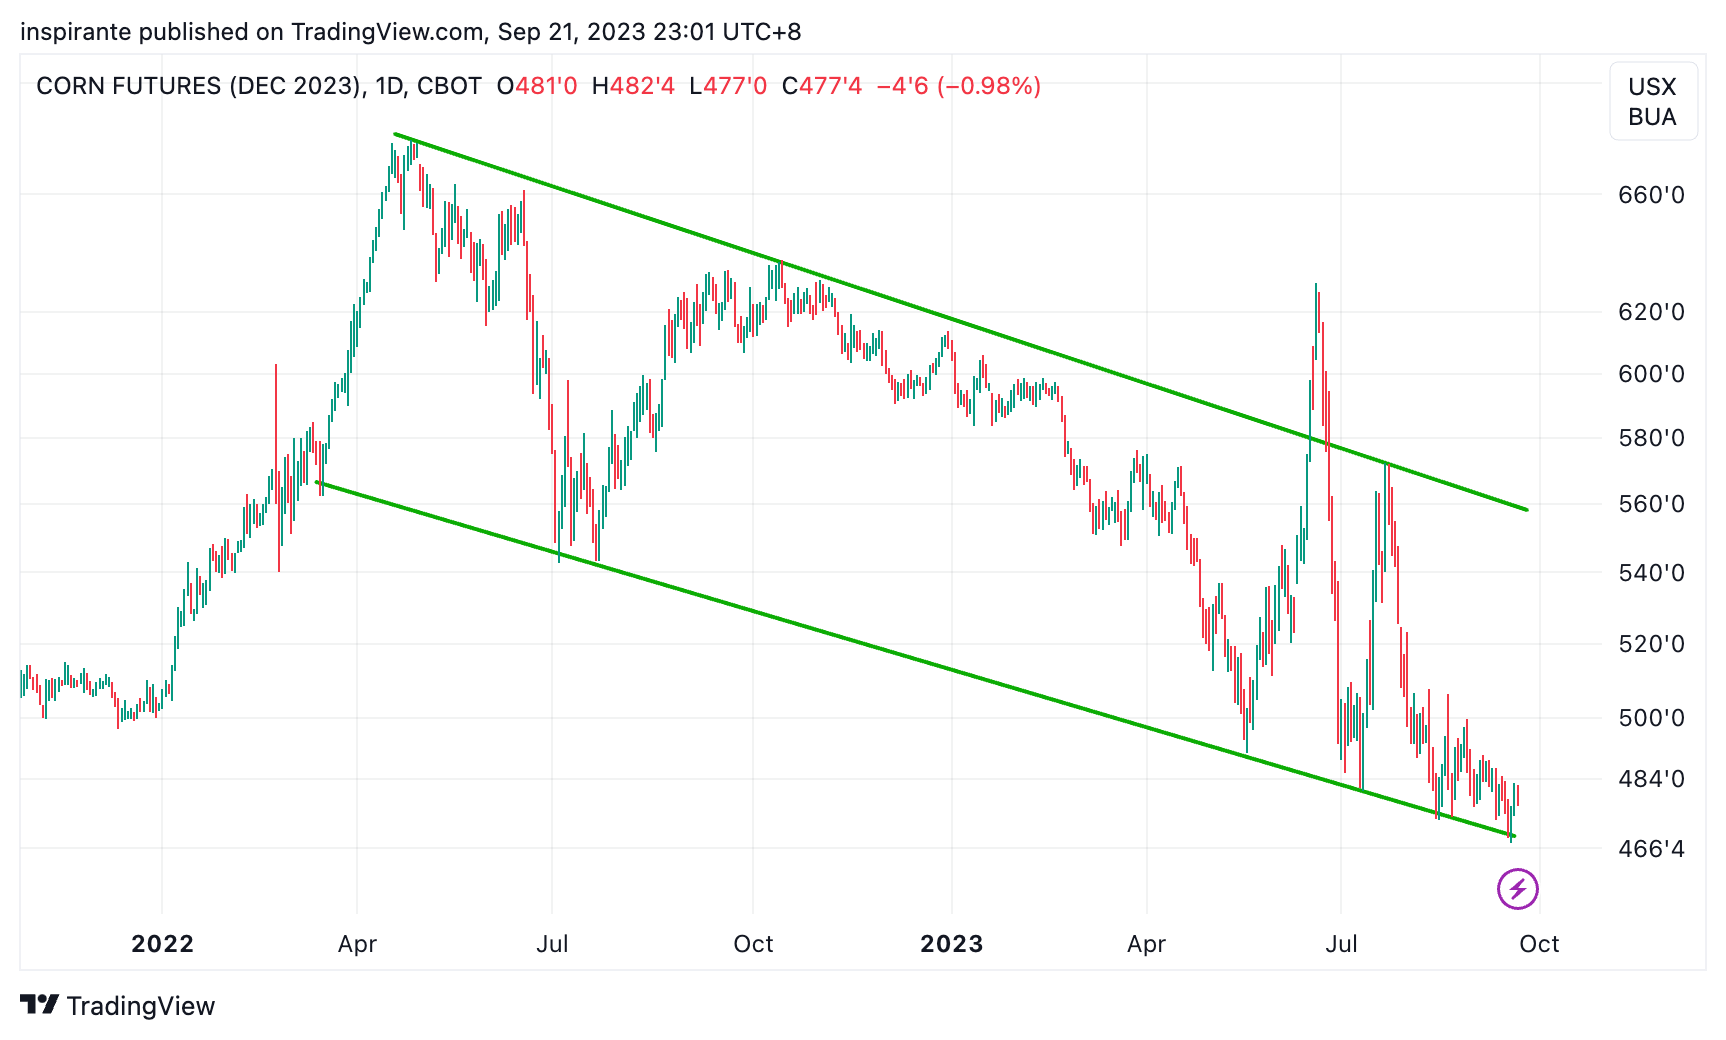
Corn prices have been slumping lower since mid-2022. Now they are near the notable support line, and downward momentum seems to wane. We are watching for a potential reversal.
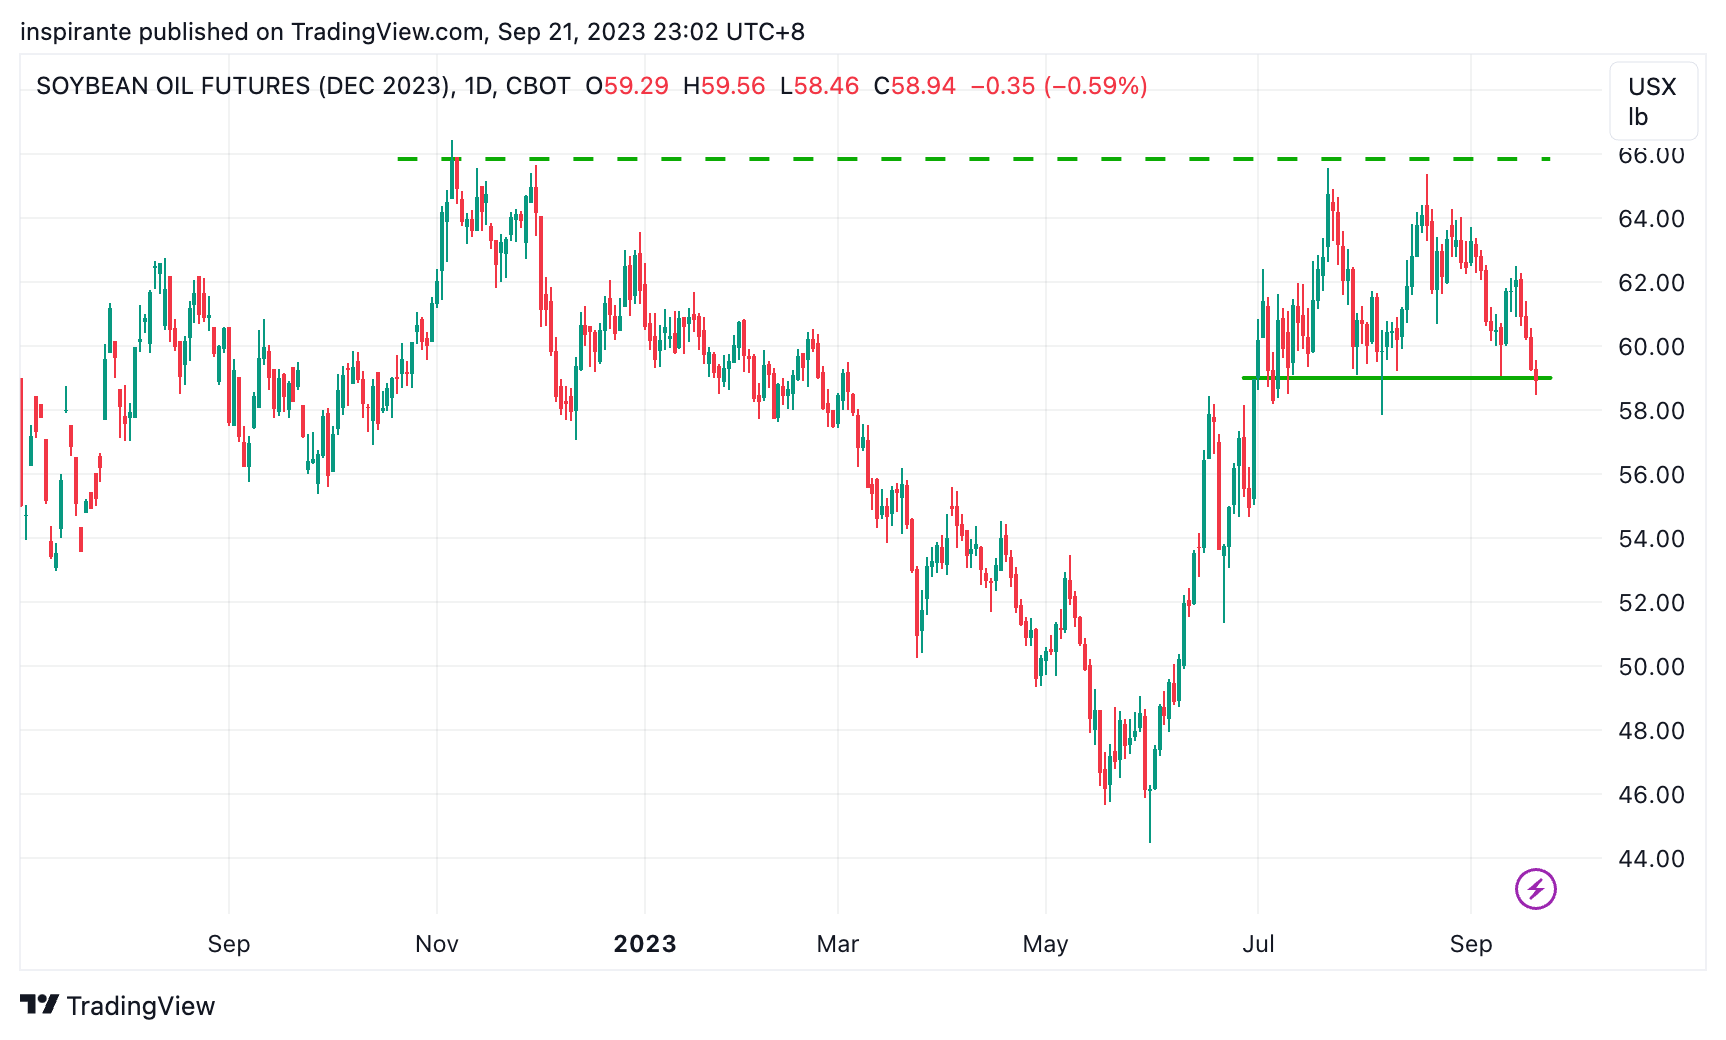
Soybean oil has arguably completed a rounding top pattern. If the neckline breakout is confirmed on the downside, we could see a significant further decline from here.
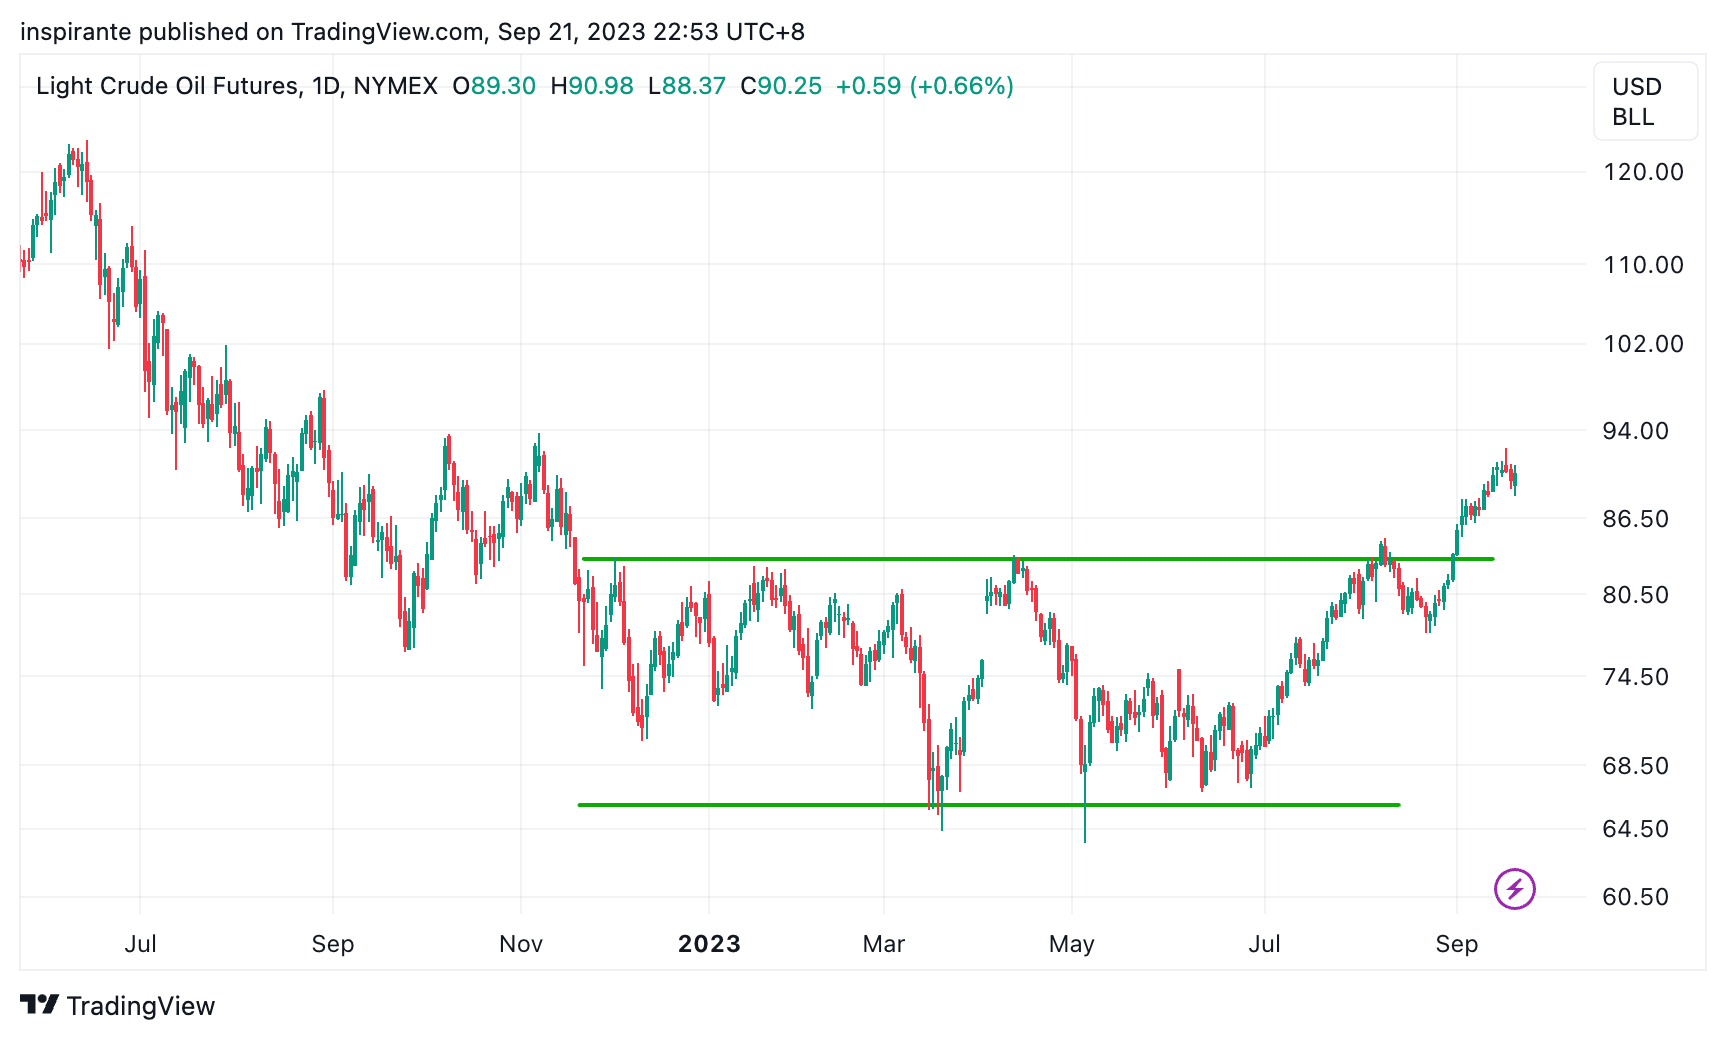
Crude oil has broken out from its year-long horizontal trading range. The voices calling for a much higher oil price are getting louder. If so, inflation might get a second wind.
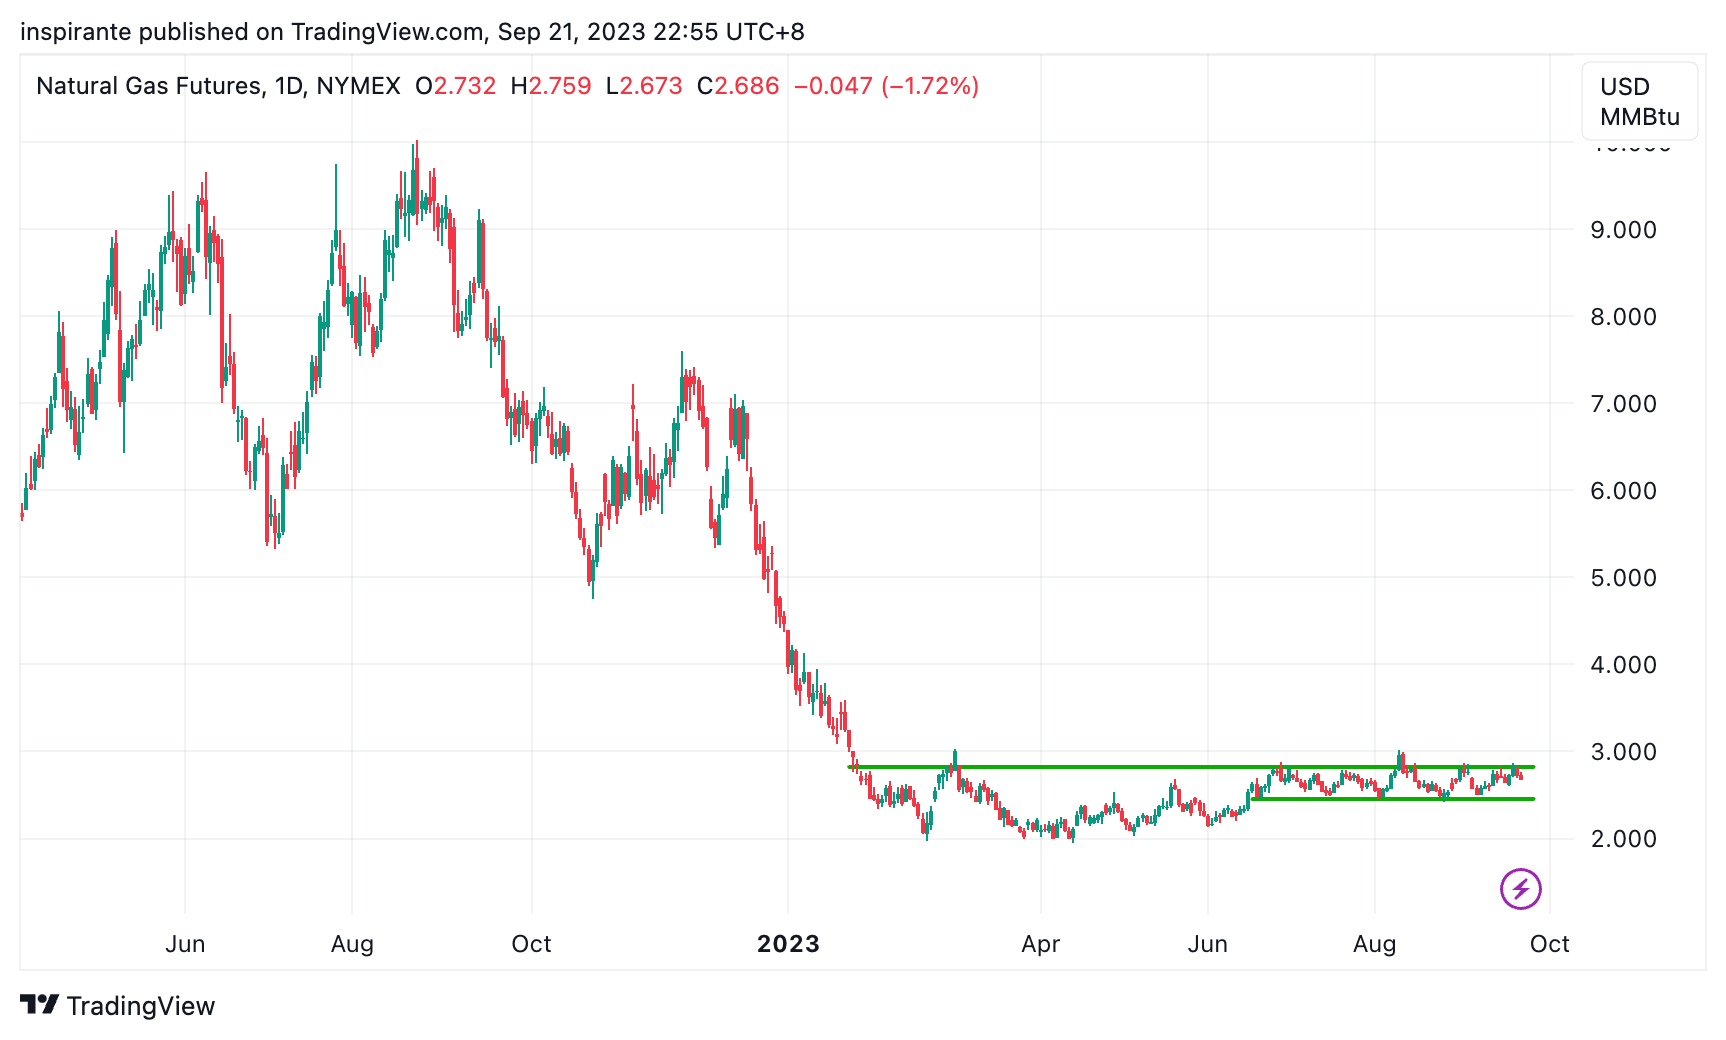
After last year’s wild move, natural gas is still consolidating in a tight range. But the current standing does tip the scales towards a lopsided upside.
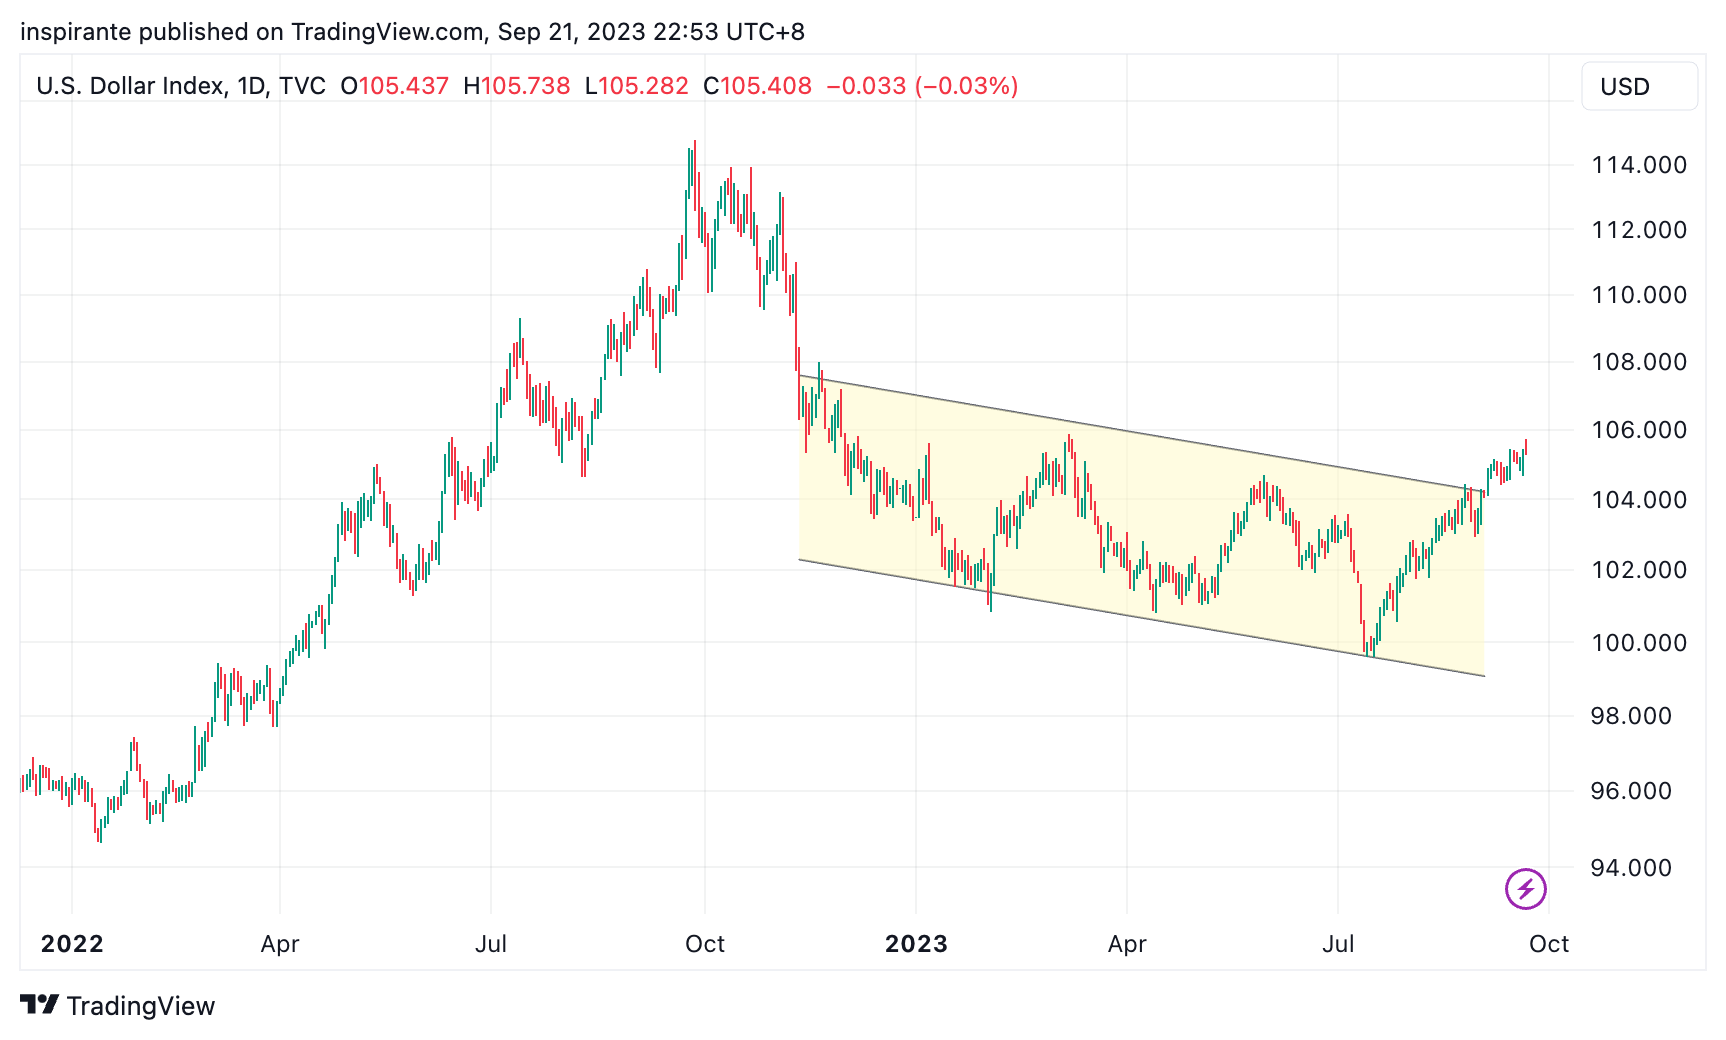
The US dollar has strengthened considerably lately. A strong dollar coupled with high energy prices spells trouble for inflation and countries relying on energy imports.
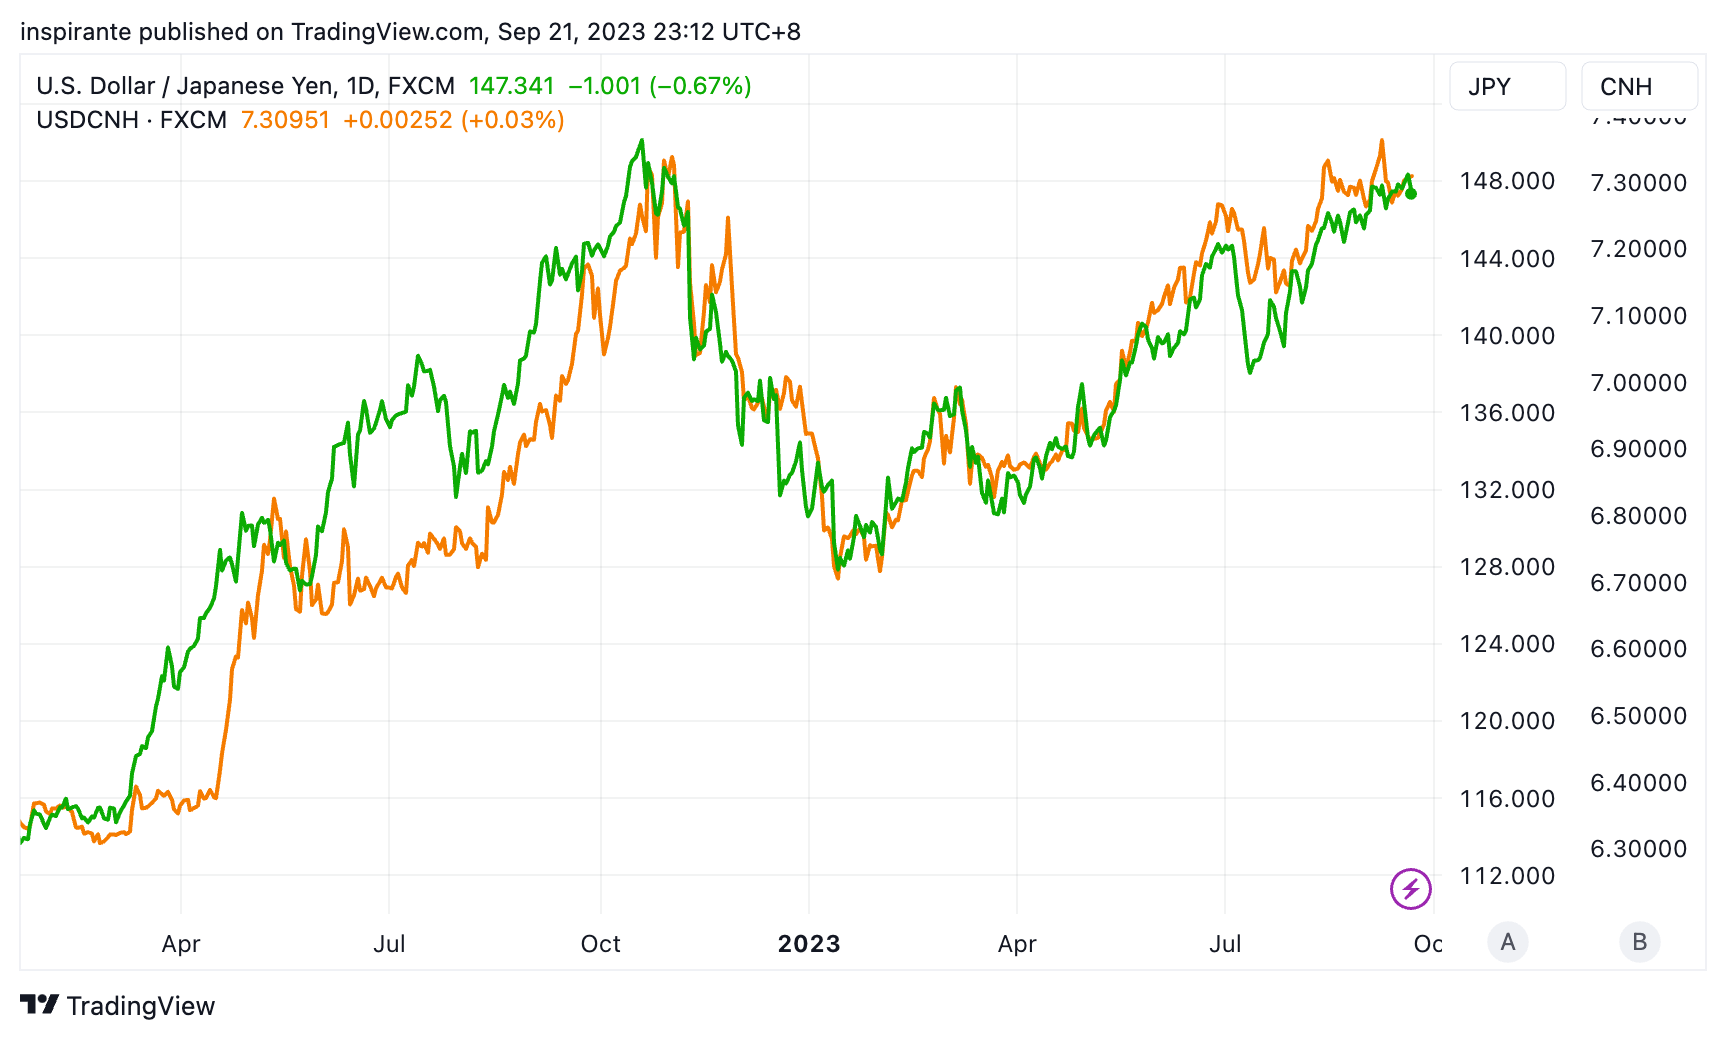
The Yen and CNH have been virtually mirror-imaging each other since 2022. Both Japan and China are sticking to their easy-money stance. A wild move in one currency might yank the other along since both nations lock horns in the export arena. Having a currency that is too strong could sideline their export game.
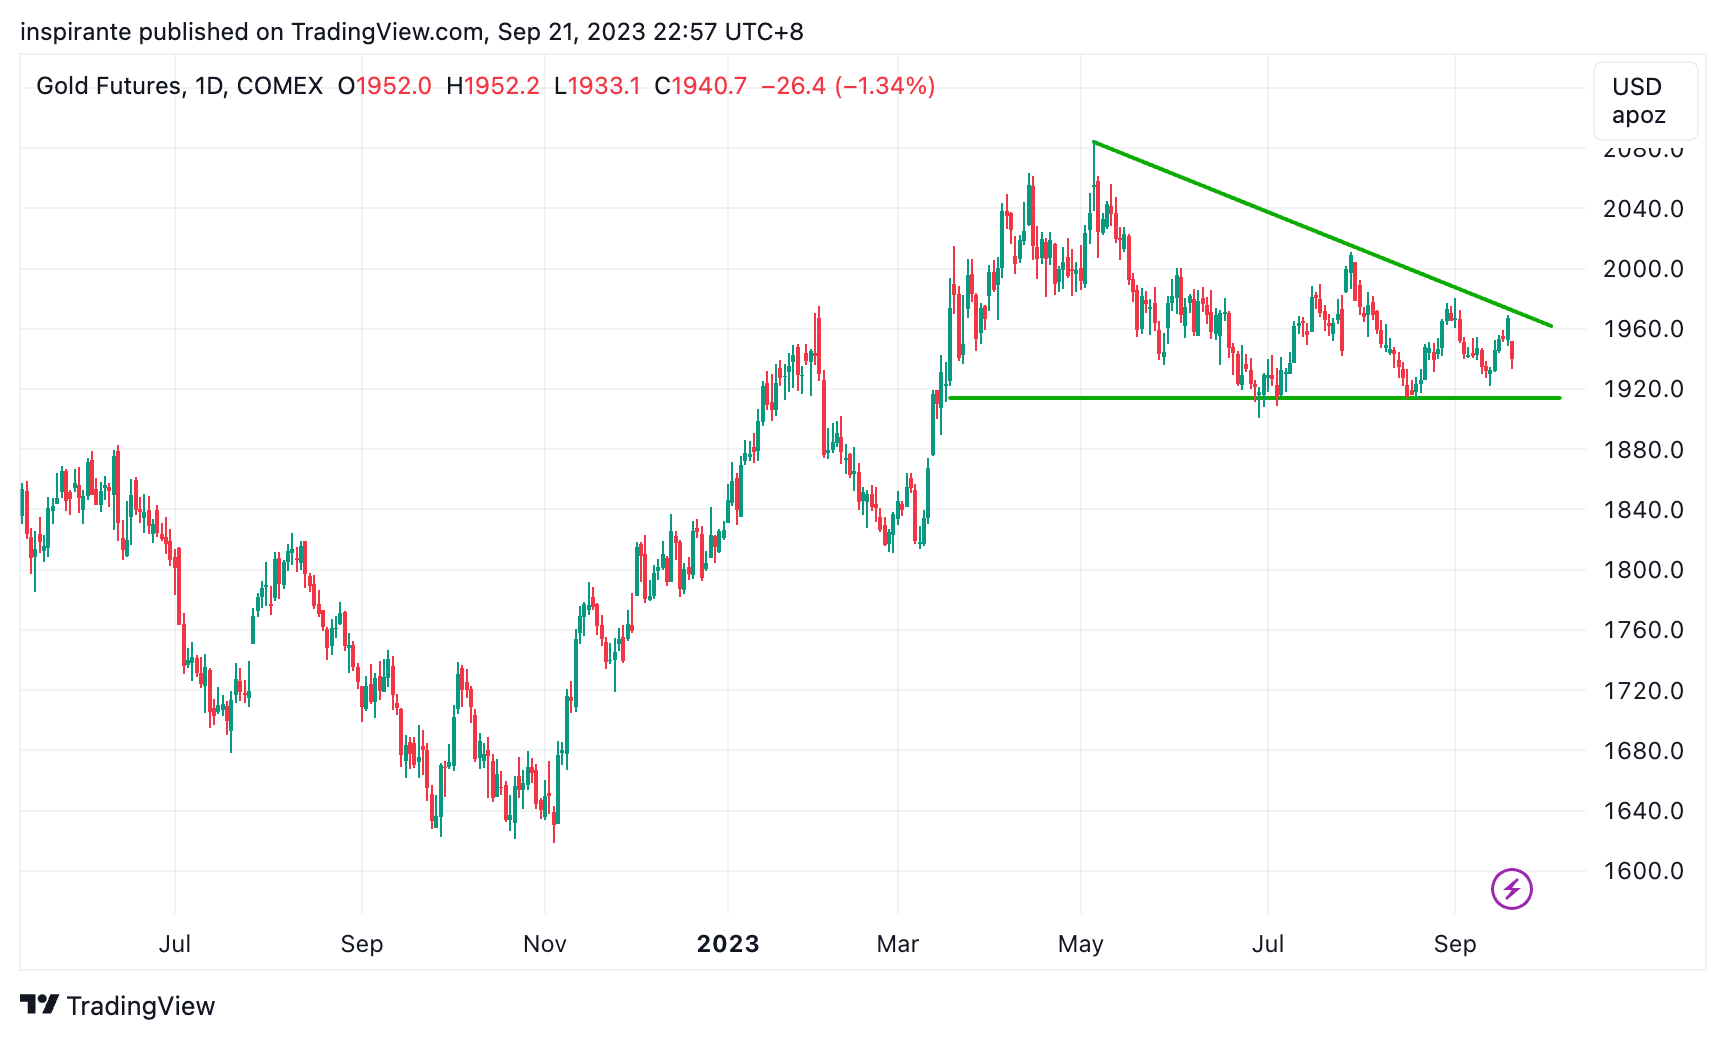
Gold is still consolidating in a descending triangle. It is near the apex, which usually suggests the probability of a breakout in either direction is on the rise.
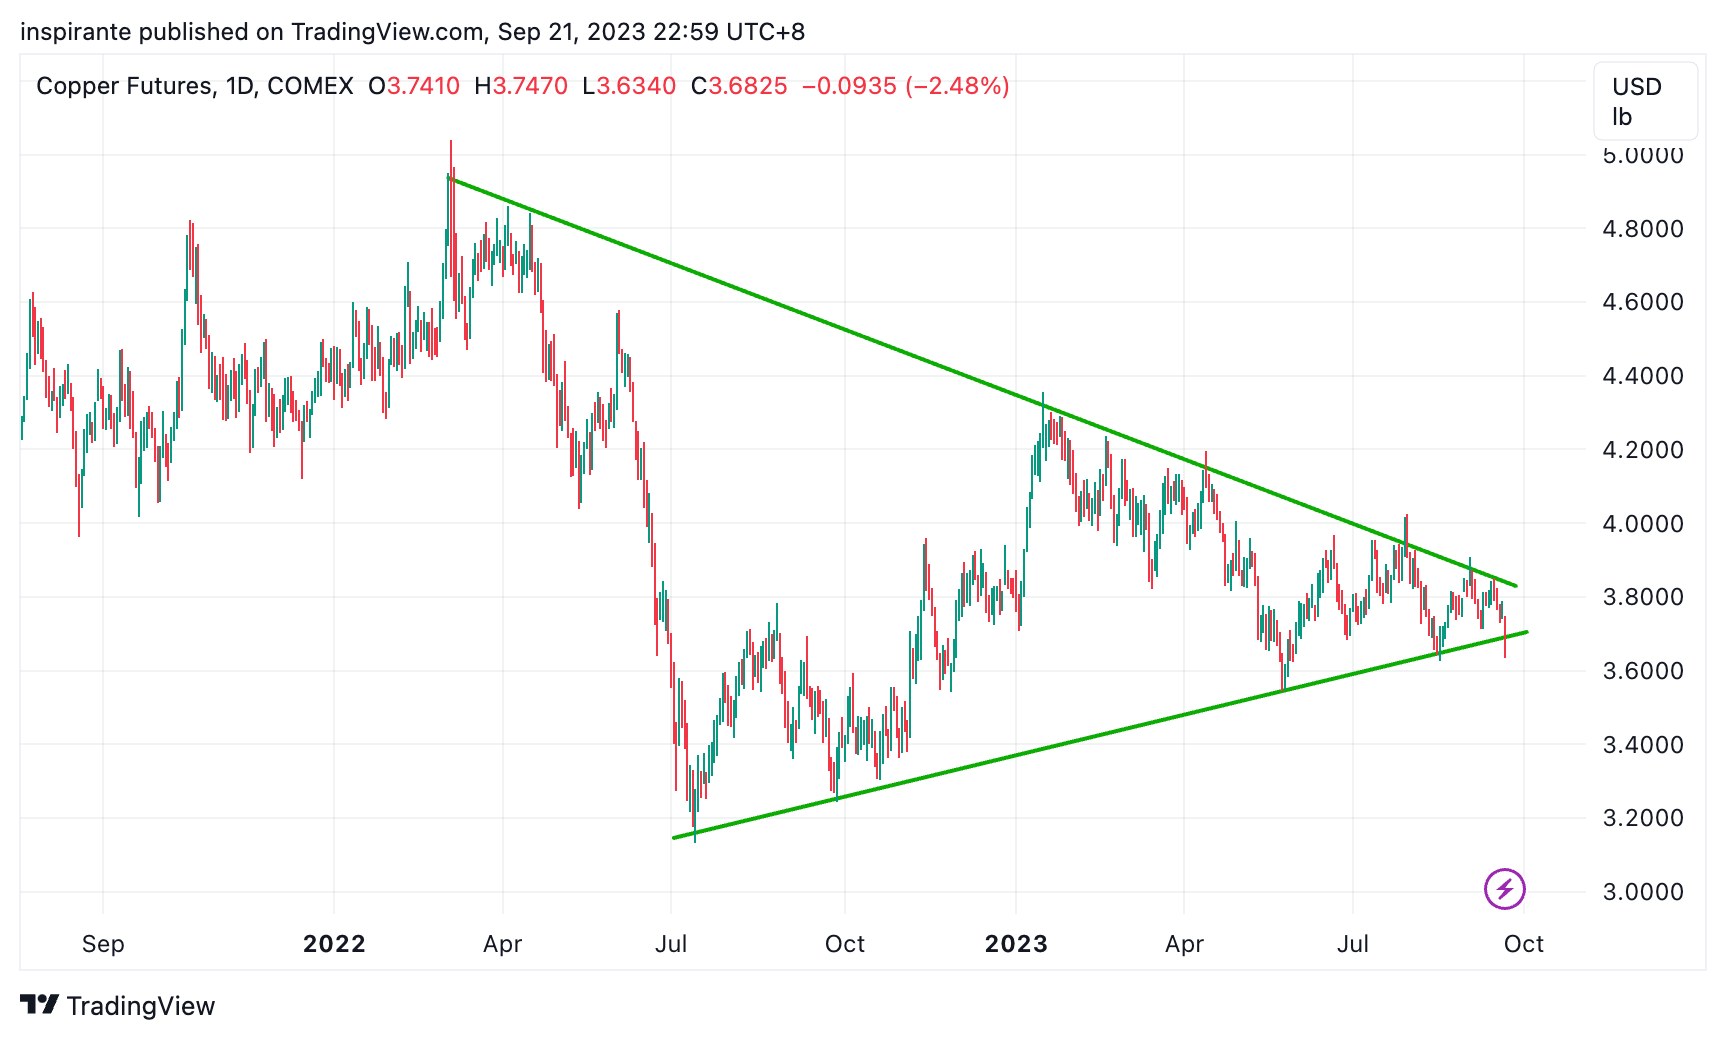
Copper is at the cusp of breaking down from a two-year symmetrical triangle. Economic slowdown and a potential recession would likely put further downward pressure on copper prices.
Original link here.
EXAMPLES CITED ABOVE ARE FOR ILLUSTRATION ONLY AND SHALL NOT BE CONSTRUED AS INVESTMENT RECOMMENDATIONS OR ADVICE. THEY SERVE AS AN INTEGRAL PART OF A CASE STUDY TO DEMONSTRATE FUNDAMENTAL CONCEPTS IN RISK MANAGEMENT UNDER GIVEN MARKET SCENARIOS. PLEASE REFER TO FULL DISCLAIMERS AT THE END OF THE COMMENTARY.
 | A guest post by
|