Markets in focus
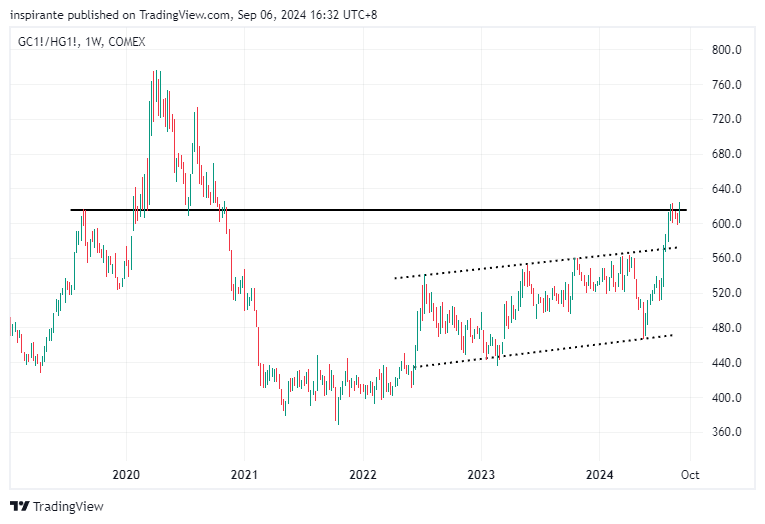
The Gold to Copper ratio has recently broken out from an ascending channel reaching levels last seen when the pandemic first disrupted the global markets.
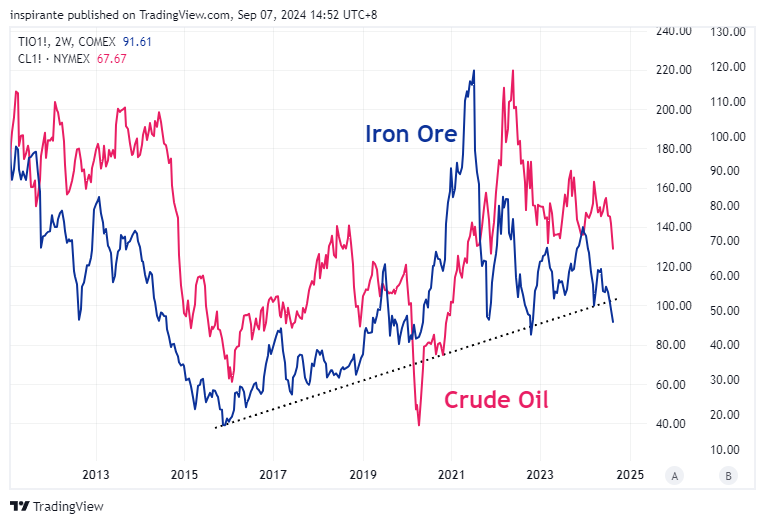
Iron ore prices have plummeted below a historical support line signaling potential further weakness. Historically, iron ore prices have shown a loose leading relationship with crude oil.
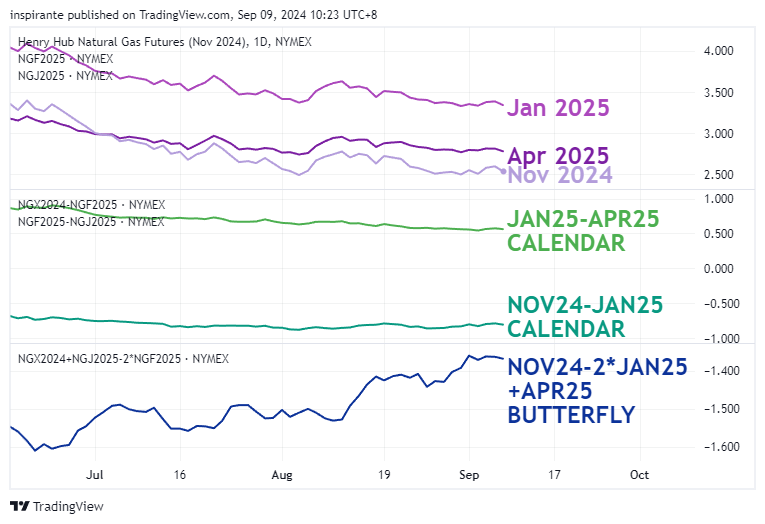
The Natural Gas January 2025 contract trades significantly higher than its surrounding months. This leads to a steep contango for the November 2024 – January 2025 calendar spread and a steep backwardation for the January 2025 – April 2025 calendar spread. The winter butterfly spread, created from a long in November 2024 – January 2025 calendar and a short in January 2025 – April 2025 calendar, currently trades at a negative.
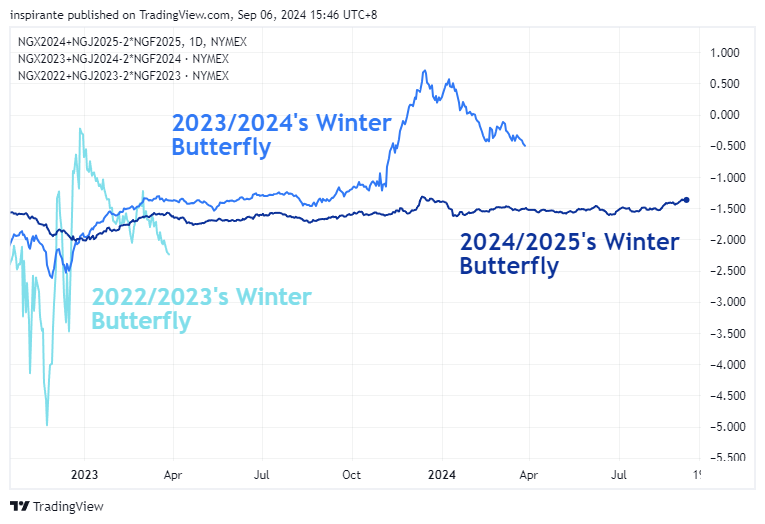
Excluding the effect of Russia-Ukraine war on the 2022/2023’s winter butterfly, the 2024/2025’s winter butterfly spread trades relatively lower than the previous two winters. This steeper curvature reflects heightened anticipation over natural gas availability during this period, driven by expectations of greater need for heating.
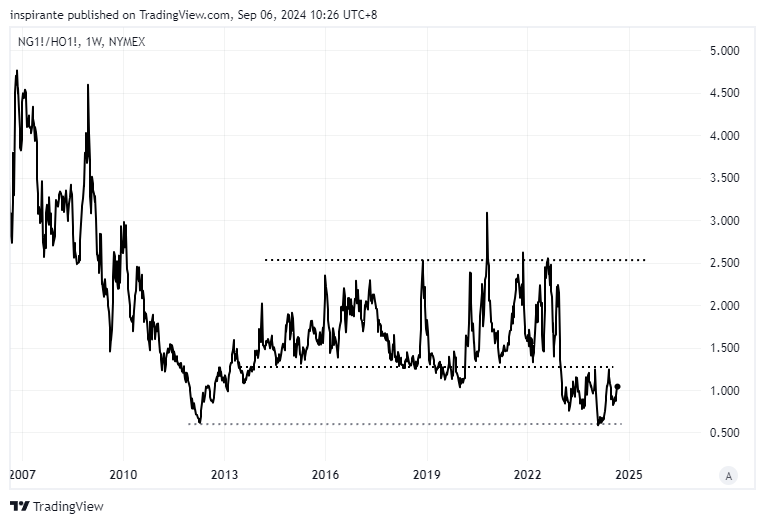
The Natural Gas to Heating Oil ratio has remained within a relatively consistent channel for the past decade. In more recent years, it has broken lower and currently trades in a newer channel.
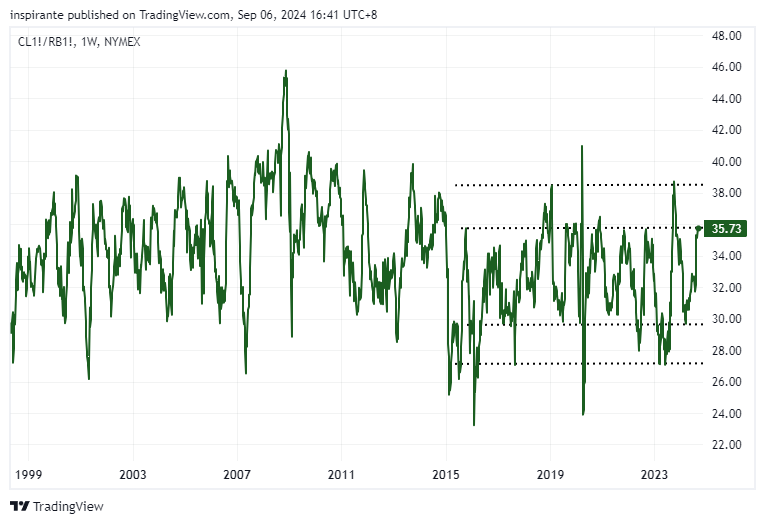
The Crude Oil to Gasoline ratio appears to be mean-reverting, currently trading near the inner resistance of a well-defined channel.
Our market views
For the second consecutive month, the VIX index, which gauges the market’s expectation of volatility in equities, has spiked at the start of the month. A series of disappointing data releases—the weaker-than-expected S&P Global PMI, a soft ISM Manufacturing PMI, a continued decline in the Employment Index and slowdown in employment growth—have stoked anxiety among investors. Although the market reaction in early August may have seemed like an overreaction to many, it served as a stark reminder that a soft-landing is not a guarantee and the fight against inflation, alongside the goal of sustaining a strong labor market, is far from over. As weak data continues to emerge, these initial concerns may deepen, turning fleeting thoughts of a potential recession into a more profound and pervasive fear.
A look at the metals futures market offers further insight into the market’s shifting sentiment. Copper, due to its broad applications across various industries, is often viewed as a proxy for global economic growth, while gold traditionally serves as a safe haven in times of uncertainty. The recent breakout in the gold-to-copper futures ratio, reaching levels last seen at the start of the pandemic, further underscores the growing pessimism in market outlook. In addition, iron ore—a commodity closely tied to the Chinese economic cycle due to its primary use in steel production—has recently plummeted, signaling potential further weakness in China’s already faltering economy.
The price trends observed in gold, copper, and iron ore collectively suggest a slowdown in economic activities, likely leading to softer demand for crude oil. Despite recent disruptions in Libyan oilfields, OPEC’s announcements to boost supply in the near future have weighed on crude prices, contributing to a bearish sentiment. This combination of reduced demand from key consumers and increased supply from OPEC suggests that crude oil prices could face downward pressure in the near term, reinforcing a generally negative market outlook.
Given the heightened market sensitivity, it’s prudent to explore opportunities less dependent on U.S. economic developments. Natural gas, whose demand fluctuates significantly with weather patterns rather than economic cycles, presents such an opportunity. As the summer heat subsides, consumption typically declines. With production relatively flat, net injections into storage are unlikely to change significantly. According to the U.S. Energy Information Administration (EIA), working natural gas stocks are currently 11% above the five-year average and 7% higher than last year’s levels at the end of August. Furthermore, the Old Farmer’s Almanac forecasts a “calmer, gentler” winter for 2025, suggesting lower heating costs, with Carol Connare, the editor-in-chief, noting that “the high heating costs associated with the season shouldn’t hit so hard.”
However, despite this outlook, the current pricing in the butterfly spread tells a different story. A butterfly spread, which involves trading a combination of November, January, and April futures contracts, helps capture the market’s expectations for price changes throughout the winter season. Specifically, the November 2024 contract reflects that at the start of winter, the January 2025 contract represents the peak of winter, and the April 2025 contract signals the end.
This year’s winter butterfly spread is trading in the negative, indicating a steep price increase for January relative to November 2024 and April 2025. The November 2024 – January 2025 spread shows steep contango, where prices rise sharply going into winter, while the January 2025 – April 2025 spread shows backwardation, where prices fall sharply after the peak. This setup, which suggests the market is overpricing natural gas for the coming winter in anticipation of a sharp rise in demand during the coldest months, contrasts sharply with the current situation of high storage levels and forecasts for a mild winter. If winter remains mild as predicted, the anticipated demand surge may not materialize, putting downward pressure on prices and potentially making the butterfly spread a mispriced opportunity.
In parallel, heating oil is primarily used for heating and can serve as a substitute for natural gas. Since crude oil is the primary raw material used in the production of heating oil, its weakness could trickle into lower heating oil prices. With the Natural Gas to Heating Oil ratio near historical lows, there is limited downside risk. A rise in natural gas or a decline in heating oil prices could push the ratio back into its long-term trading channel, reinforcing heating oil’s position as a cheaper alternative and capping upside demand for natural gas.
However, the energy market is inherently volatile. Unpredictable weather patterns, aptly described by Katy Perry’s “Hot n Cold” lyrics, could cause sudden surges in heating demand. Furthermore, the upcoming U.S. election introduces an additional layer of uncertainty. A potential Kamala Harris presidency may favor renewable energy initiatives, while a Trump administration could pivot towards the deregulation of fossil fuels, potentially causing significant shifts in energy policies that affect market dynamics and price volatility. As such, tight stop-loss measures are essential to mitigate the risk of adverse market movements.
Furthermore, the weakness in crude oil prices could inadvertently benefit refineries, which are currently grappling with poor margins. Lower input costs from cheaper crude may enable refineries to reduce production cuts, potentially boosting the output of refined products like gasoline. Historically, the Crude Oil to Gasoline ratio tends to mean revert, and with the ratio trading at a channel’s resistance, a failed breakout could trigger a downward reversion, further highlighting the nuanced interplay between these commodities.
How do we express our views?
We consider expressing our views via the following hypothetical trades1:
Case study 1: Long Natural Gas Futures Butterfly Spread
To express the view that market is overpricing natural gas for the winter, we expect these spreads to flatten. Referring to Figure 3, this means the November 2024 – January 2025 calendar spread would narrow, while the January 2025 – April 2025 calendar spread would widen. We would thus consider taking a long position in the Natural Gas futures butterfly spread by taking a long position in the November 2024 – January 2025 calendar spread (NGX4NGF5) and a short position in the January 2025 – April 2025 calendar spread (NGF5NGJ5). Currently, at the present level of -1.362, with a tight stop loss below -1.500, which could bring us a hypothetical maximum loss of -1.500-(-1.362) = -0.138 points. The butterfly spread price has the potential to reach 0.000, which signals a flat term structure, a hypothetical gain of 0.000 -(-1.362) = 1.362 points. Since each natural Gas futures contract represents 10,000 MMBtu and each point move represents 10,000 USD, each point move in the butterfly spread would also represent 10,000 USD. There is margin offset for natural gas futures calendar spread. E-mini and Micro natural gas futures are also available at ¼th and 1/10th of the standard contract size respectively.
Case study 2: Short Crude Oil/ Gasoline ratio
We would consider taking a short position in the crude oil/ gasoline ratio, by simultaneously selling ten Micro WTI Crude Oil future (MCLZ4) at 68.30 and buying one Gasoline future (RBZ4) at 1.90, with an effective price ratio of 68.30/1.90 = 35.95. We would put a stop-loss above 38.50, the outer resistance level, which could bring us a hypothetical maximum loss of 35.95 – 38.50 = -2.55 points. Looking at Figure 5, the ratio has the potential to revert to the inner support of 29.50, a hypothetical gain of 35.95 – 29.50 = 6.45 points. Each point move in the Micro WTI Crude Oil futures contract is 100 USD, and each point move in the Gasoline futures contract is 42,000 USD. Micro WTI Crude Oil futures have a contract size of 100 barrels of oil, which is equivalent to 4,200 gallons. To make the two legs of this trade dollar neutral, we will need a 10: 1 ratio.
· Leg 1: short 10 MCLZ4 at $68.3
Notional value: $68.3*100*10=$68,300
· Leg 2: long 1 RBZ4 at $1.9
Notional value: $1.9*42,000=$79,800
We can look at two hypothetical scenarios to understand the approximate dollar value of a 1 point move in ratio.
Scenario 1: Assuming the Gasoline stays unchanged, and the Crude Oil falls to 66.41 and the ratio becomes 66.40/1.90 = 34.95. The overall profit, which comes solely from the Crude Oil position in this case is (68.30-66.40) x 100 x 10 = 1,900 USD.
Scenario 2: Assuming the Crude Oil stays unchanged, and the Gasoline falls to 1.85 and the ratio becomes 68.30/ 1.85 = 36.95. The overall loss, which comes solely from the Gasoline position in this case is (1.90-1.85) x 42,000 = 2,100 USD.
In Scenario 1, the ratio drops by 1 point, yielding a profit of 1,900 USD from the short Crude Oil position. In Scenario 2, the ratio rises by 1 point, yielding a loss of 2,100 USD from the long Gasoline position.
We could express the same view by using the standard WTI Crude Oil Futures and Gasoline futures at a ratio of 1:1, too.
Original link here.
EXAMPLES CITED ABOVE ARE FOR ILLUSTRATION ONLY AND SHALL NOT BE CONSTRUED AS INVESTMENT RECOMMENDATIONS OR ADVICE. THEY SERVE AS AN INTEGRAL PART OF A CASE STUDY TO DEMONSTRATE FUNDAMENTAL CONCEPTS IN RISK MANAGEMENT UNDER GIVEN MARKET SCENARIOS. PLEASE REFER TO FULL DISCLAIMERS AT THE END OF THE COMMENTARY.


