

"I raise..."
First published on 2022-09-28


Markets in Focus
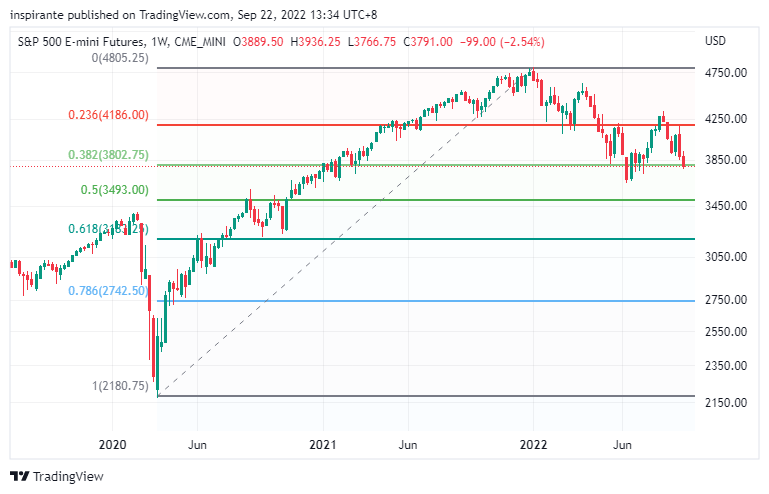
The bear market rally of the S&P 500 was forcefully rejected near 4300. It is now trading near the June low. To meaningfully tighten financial conditions, as suggested by the Fed’s clear message, the equity market will likely fall to pre-pandemic levels. In the case of the S&P 500 index, it could be below 3200, the 61.8% retracement level of the entire post-pandemic rally.

The US 2-year treasury yield has skyrocketed to 4%. The multi-decade downward trend is clearly broken to the upside. Both the speed and magnitude of the spike are jaw-dropping, as we see the year-over-year change dwarfed anything in the past 50 years.

Heating oil has been trading in a five-month descending triangle top. It is sitting at the significant support region between 3.1 and 3.2. It remains to be seen if it will rebound from here as winter season approaches. Nevertheless, it offers a very asymmetrical risk/reward for the energy bulls.

Feeder Cattle has completed a two-month symmetrical Head-and-Shoulder top. It has broken the neckline around 184, subsequently retested and failed. The price is now heading towards the low 170s.
Market Views
In the well-known game of Poker, you can raise when you believe you have a strong hand to increase the size of an existing bet in the current round. The other players need to either call or re-raise to remain in the game. In such a game of incomplete information, raising sometimes signals the strength of the hand. However, raising is also a commonly used technique to bluff, when the player likely does not have the best hand but hopes the opponents will fold their mediocre yet stronger hands. The reason is that players can only see their own “hole cards” and the “community cards,” which are in the center of the table, but not other players’. Making an informed and probabilistic guess on whether the player is bluffing makes Poker an intriguing game.
By analogy, the financial market resembles the game of Poker in terms of uncertainty and its various types of participants, to name a few, long-term investors, speculators, regulators, and policymakers. At the press conference post the September 21 FOMC meeting, after delivering another 75bps hike in interest rates, Chairman Powell resolutely said, “The path that we actually execute will be enough. It will be enough to restore price stability.” It reminded us of another historical moment when ECB President Mario Draghi said “whatever it takes,” which marked the turnaround of the euro crisis in July 2012.
In our opinion, the message of Chairman Powell could not be clearer. Central banks, especially the Fed, are laser-focused on inflation right now. In his own words, “reducing inflation is likely to require a sustained period of below-trend growth, and it will very likely be some softening of labor market conditions.” We strongly urge our readers to listen to the full speech just to see how unequivocally hawkish the Fed is signaling to the market.
Such a stance has important implications for the financial market. Tightening financial conditions means high bond yields, lower asset prices, sustained strength of the US Dollar, weaker labor market, lower economic growth, and finally, reduced aggregate demand. None of these is friendly to risk assets, especially the US equity market that is still at historically high valuations despite the recent selloff.
The recency bias tends to lead market participants to believe that central banks would always come to the rescue when the equity market is under stress, as we have seen in the past two decades. We have been pounding the table since last year, suggesting that we have already moved into an entirely different macro regime because inflation is something most countries have not seen in decades. That changes everything. The “Fed Put,” if it still exists, is far down below. “Buying the dip” will not work like a charm anymore. We caution our readers to give the Fed more credit when they are already this clear when telling the market what is going to happen next. They will not be afraid to raise again (pun intended).
How to play the theme out
A hypothetical investor can consider the following trades1:
Case Study 1: Short Micro E-mini S&P 500 Future
If the investor were to short the Micro E-mini S&P 500 future (MESZ2) at 3790 and set the stop above 4190, his maximum loss per contract would be (4190 – 3790) x 5 = 2000 USD. An initial target points to 3400 and subsequently 3000, resulting in (3790 – 3400) x 5 = 1950 USD and (3790 – 3000) x 5 = 3950 USD.
Case Study 2: Long Heating Oil Future
If the investor were to long the Heating Oil future (HOZ2) at around 3.2 and set the stop below 3.0, his maximum loss per contract would be (3.2 – 3.0) x 42000 = 8400 USD. An initial target points to 3.8, resulting in (3.8 – 3.2) x 42000 = 25200 USD.
The Rearview Mirror
A look into history could help us position ourselves better for the future. This section provides a rundown of market moves across major asset classes between July and September.

The US small caps, as suggested by the Russell 2000 index, retraced more than the big caps. It is already near the pre-pandemic level of 1700, which is also the 50% retracement level since the low of 2020. 1600 region is going to provide strong support. Therefore, in the following months, the Russell 2000 index is likely to outperform the S&P and the Nasdaq.

The second leg higher in USD/CNH is just as fierce as the first one when the symmetrical triangle consolidation was broken out in August. 7.2 will be a formidable resistance level that rejected the rally twice in 2019 and 2020. Even though our fundamental bias is still long USD/CNH, it is extremely overbought from a technical perspective.
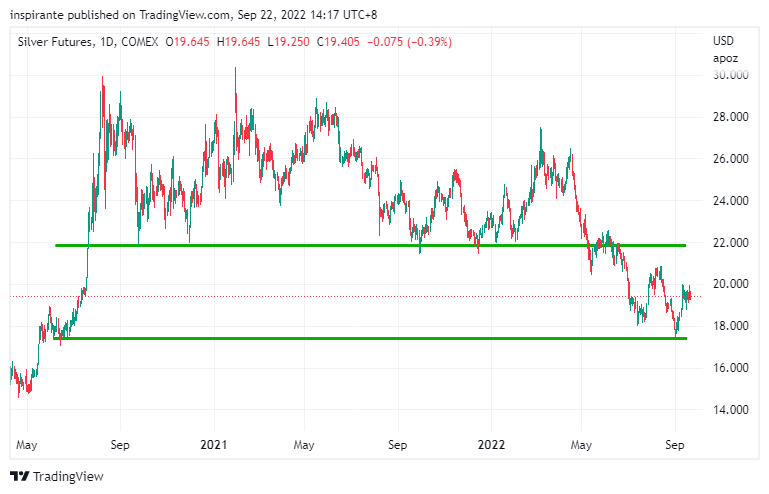
When silver lost the multi-year support at 22, it continued to weaken in a series of lower highs and lower lows. Just like gold which performed poorly in the rising real rates environment, silver also could not find a bid until 17. Even then, it is still questionable if silver can make a comeback anytime soon.

Despite recent recession fears and weakness in crude oil, it is still holding above 80, a psychologically important support level. If the bulls could not defend this level, we could see crude oil price fall to 60s before finding another meaningful support.

Gasoline price has come down substantially from the high registered in June. It has given back 61.8% of the gains since the beginning of the year. The lowering of gasoline price has undoubtedly help alleviate the inflation pressure, which makes us wonder why the latest CPI number still surprised the consensus to the upside.
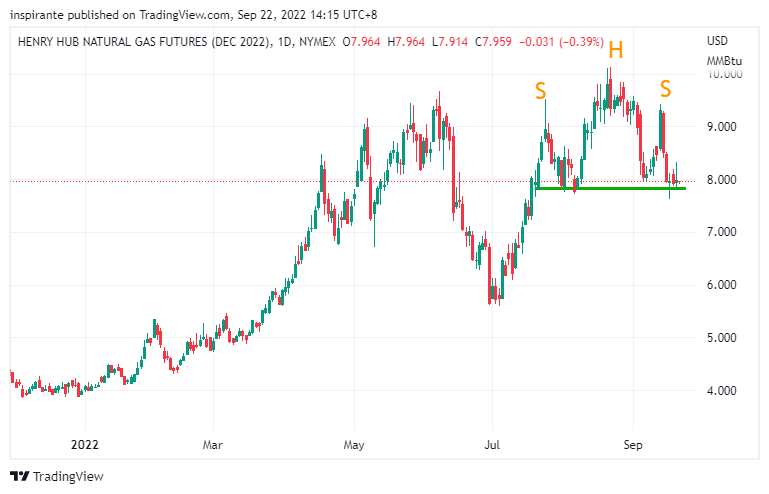
Henry Hub Natural gas is trading near the neckline of a potential Head-and-Shoulder top. Given the dire natural gas shortage situation in Europe and Asia, we remain long biased in natural gas price. Similar to heating oil in Figure 3, it offers an asymmetrical risk/reward for the energy bulls.

After completing an inverse Head-and-Shoulder bottom in August, Corn has gained the momentum to rally towards 700 region. If it can break above 700, corn price could reach 750 before year-end.

After a sharp reversal in late July, soybean oil has been consolidating in a symmetric triangle. The direction of the next substantial move is still to be determined.

Wheat price has completed another inverse Head-and-Shoulder bottom in September. If history is any guide, we could see wheat continue this leg higher to above 1000.
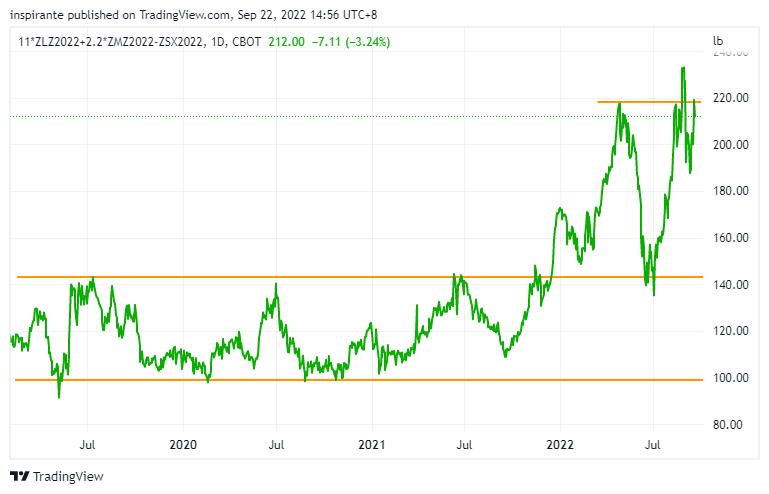
The soybean crush spread had a short spike higher before sharply falling below 200. It is currently still trading between 200 and 220. We are watching closely for the spread to collapse back to 150 region.

Live Cattle is facing a strong resistance at around 152. It has rejected the rally a few times since the beginning of the year. If the current uptrend is broken and price falls to 148, we could see another leg lower, like what happened in May.

The Eurodollar December 2022 - December 2023 spread narrowed for more than 50bps (two fewer rate cuts in 2023) since July, suggesting the market is finally repricing the “Fed Pivot” as the Fed signaled both rates and inflation are likely to stay higher for longer.
Original Link: https://www.cmegroup.com/newsletters/fresh-from-the-trading-room/2022-09-28.html
Examples cited above are for illustration only and shall not be construed as investment recommendations or advice. They serve as an integral part of a case study to demonstrate fundamental concepts in risk management under given market scenarios.
 | A guest post by
|