Markets in focus
It’s premature to dismiss a resurgence of inflation under Trump’s second term. The 1970s stand as a historical reminder, with inflation rebounding sharply after an initial decline.
The broader uptrend in U.S. Treasury yields remains intact. Prior descending channels appear to be corrective pullbacks, with subsequent breakouts aligning with a higher inflation scenario.
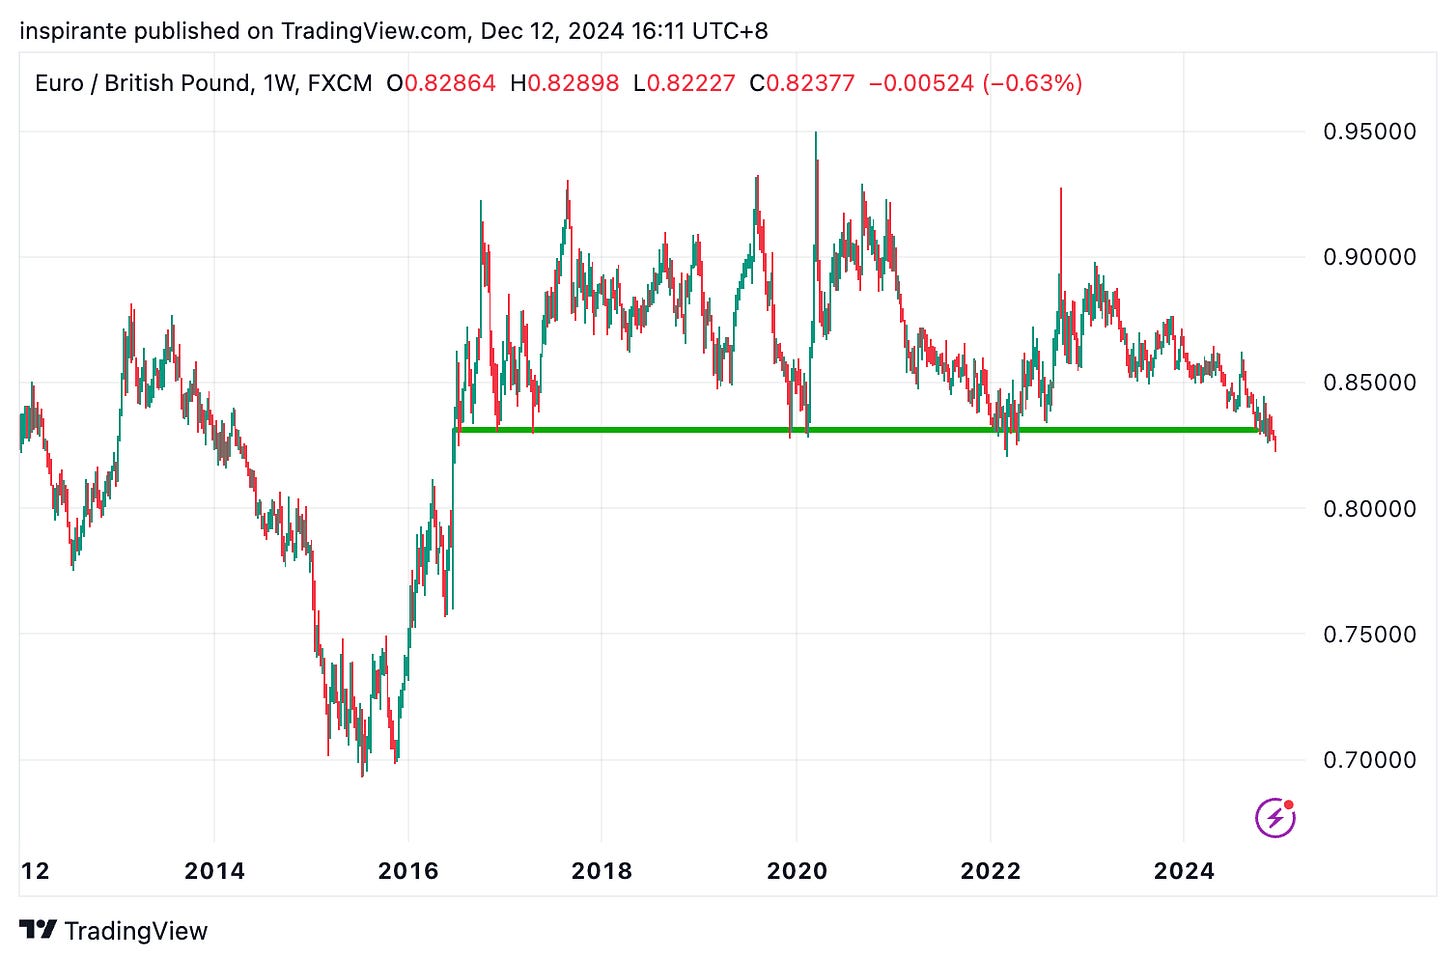
Following the European Central Bank (ECB)’s latest rate cut, the euro weakened further against the British pound and is now at a multi-year support level that has repeatedly contained declines in the past.
Live cattle prices have decisively broken out of a 15-month ascending triangle, indicating renewed bullish momentum after a prolonged consolidation.
Our market views
It’s that time of year again. As we head into the second half of December, the market tends to show certain seasonal patterns. Perhaps the most famous is the “Santa Rally,” when stock markets often finish the year strong and sometimes even extend their gains into early January. This phenomenon is attributed to various factors, including holiday optimism, year-end portfolio adjustments, lighter trading volumes, and higher retail participation. All these influences are valid reasons for us to stay comfortably on the sidelines rather than pushing a contrarian bearish stance—especially given the recent market euphoria across risk assets, notably technology stocks and cryptocurrencies. As the saying goes, don’t fight the trend. That said, as we prepare to turn the page into the new year, we need to look beyond this seasonal upswing and consider the larger forces at play and remain watchful of the potential headwinds that could challenge the current exuberance.
Analysts scrutinized the Trump administration’s Cabinet picks and key White House appointments, seeking clarity on his likely policy priorities for the second term. A well-known foreign policy hawk, Senator Marco Rubio, has been nominated for Secretary of State. Once a protégé of George Soros and an advocate of tariffs, Scott Bessent was slated to be the Treasury Secretary. To address the burgeoning U.S. budget deficit, a new Department of Government Efficiency (DOGE) has been established, helmed by Elon Musk and Vivek Ramaswamy. DOGE is mandated to streamline the federal operations, reduce wasteful spending, cut unnecessary regulations, and restructure agencies. Many see this as overdue, given that the U.S. budget deficit this year is at a record high outside of the pandemic years. “We have to reduce spending to live within our means,” Musk remarked. “That might bring some temporary hardship, but it will ensure long-term prosperity.”
From these developments, we can draw a few conclusions. Trump’s team is clearly focused on domestic economic health and prosperity, promoting economic protectionism, a non-interventionist military posture, and a more isolationist foreign policy. Tax reforms, deregulation, and other incentives to encourage reshoring—bringing production and jobs back to U.S. soil—will likely follow. These changes might make it cheaper for companies to bring operations back home, but that doesn’t necessarily guarantee lower consumer prices. Trade frictions are set to persist, if not intensify.
This marks a key difference between Trump’s upcoming term and his first. Back in 2016–2020, U.S. inflation hovered near 2%, roughly in line with the preceding two decades. The next four years, however, may tell a very different story. Investors anticipating a repeat of market performance during Trump’s first term could be setting themselves up for a rude awakening. We believe inflation may soon return to the hot spot (pun intended). As investors realize the world has entered a new regime, many of the assumptions and models built on the patterns of the past three decades may no longer hold true. We believe this is one of the most underappreciated risks in today’s market.
The final FOMC meeting of the year takes place on December 18th, and the short-term interest rate market has almost fully priced in a 25bps rate cut, as suggested by the CME FedWatch Tool. But looking further out, if inflation indeed flares up again, expectations for further cuts could shift dramatically, and so will bond yields.
In an environment where volatility is likely to remain elevated—thanks to policy uncertainties and ongoing geopolitical tensions—our preferred asset allocation still leans toward “hard assets” like commodities. This asset class remains under-owned and overlooked, yet it has the potential to do well under both inflationary and growth scenarios, not to mention amid trade frictions and heightened geopolitical risks.
With this broader perspective in mind, we wrap up our last report in 2024, an eventful year marked by political shifts, AI explosion and regulation, escalating tensions and economic uncertainty. We wish all our readers a wonderful holiday season filled with warmth, hopes, and joy. See you next year!
How do we express our views?
We consider expressing our views via the following hypothetical trades1:
Case Study 1: Long 10-Year Yield Futures
We would consider taking a long position in the 10-year yield futures (10YZ4) at the current price of 4.40, with a stop-loss below 4.10, a hypothetical maximum loss of 4.40 – 4.10 = 0.30 points. Looking at Figure 2, if the 10-year yield breaks out from the bull flag pattern, it has the potential to reach 5.00, resulting in 5.00 – 4.40 = 0.60 points. Each point move in the 10-year yield futures contract is 1,000 USD.
Case Study 2: Long Live Cattle Futures
We would consider taking a long position in the live cattle futures (LEG5) at the current price of 191.375, with a stop-loss below 186, a hypothetical maximum loss of 191.375 – 186 = 5.375 points. Looking at Figure 4, if the triangle breakout is confirmed, live cattle price has the potential to reach 210, resulting in 210 – 191.375 = 18.625 points. Each live cattle futures contract represents 40,000 pounds; each point move is 400 USD.
The Rearview Mirror
A look into history could help us position ourselves better for the future. This section provides a rundown of market moves across major asset classes between September and December.
The Nasdaq’s ascending channel, in place since 2023, remains intact as the index hovers at all-time highs with no clear resistance overhead.
The Russell 2000 has yet to break its 2021 high, now a formidable resistance level. As it consolidates around this barrier, the index has begun underperforming relative to the Nasdaq.
The Nikkei 225 has been consolidating in a rectangular pattern below the 40,000 level for the past three months, following a volatile August led by rapid yen appreciation.
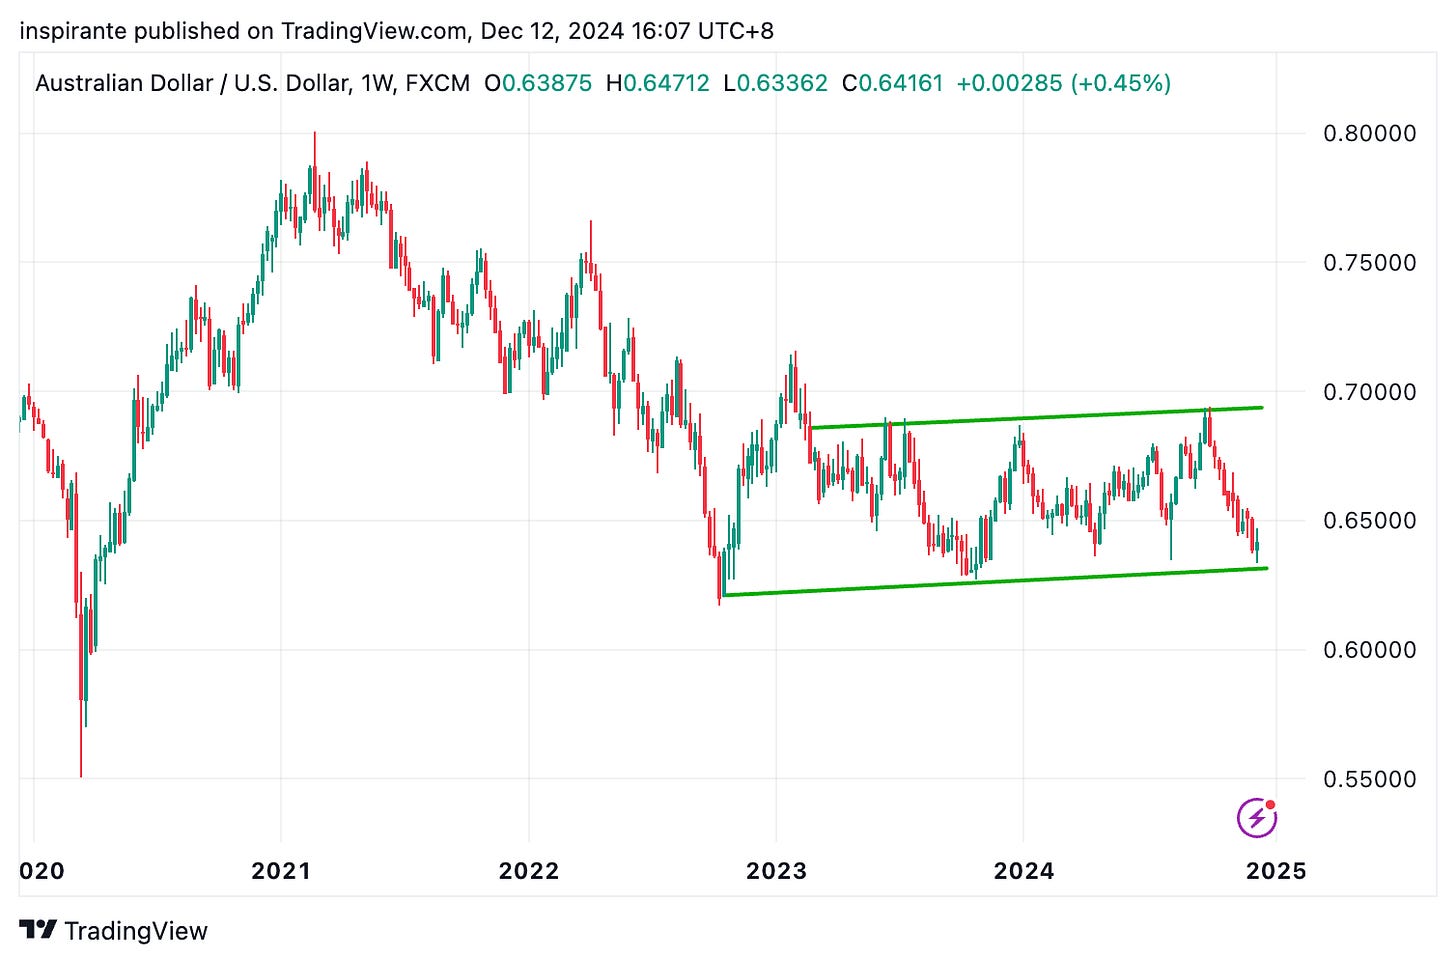
AUD/USD is currently testing support near the lower boundary of a gently rising channel.
The Chinese yuan is once again nearing key resistance above 7.3. During Trump’s first term, tariffs prompted a significant weakening of the currency.
Gold has decisively broken out of a diamond pattern, signaling the end of its three-month consolidation and a resumption of its uptrend.
Silver has followed gold’s lead, pushing above resistance at 32, though it still trades below its October high.
The gold/silver ratio has historically reversed lower after breaking ascending supports. If this pattern repeats, silver could significantly outperform gold in the months ahead.
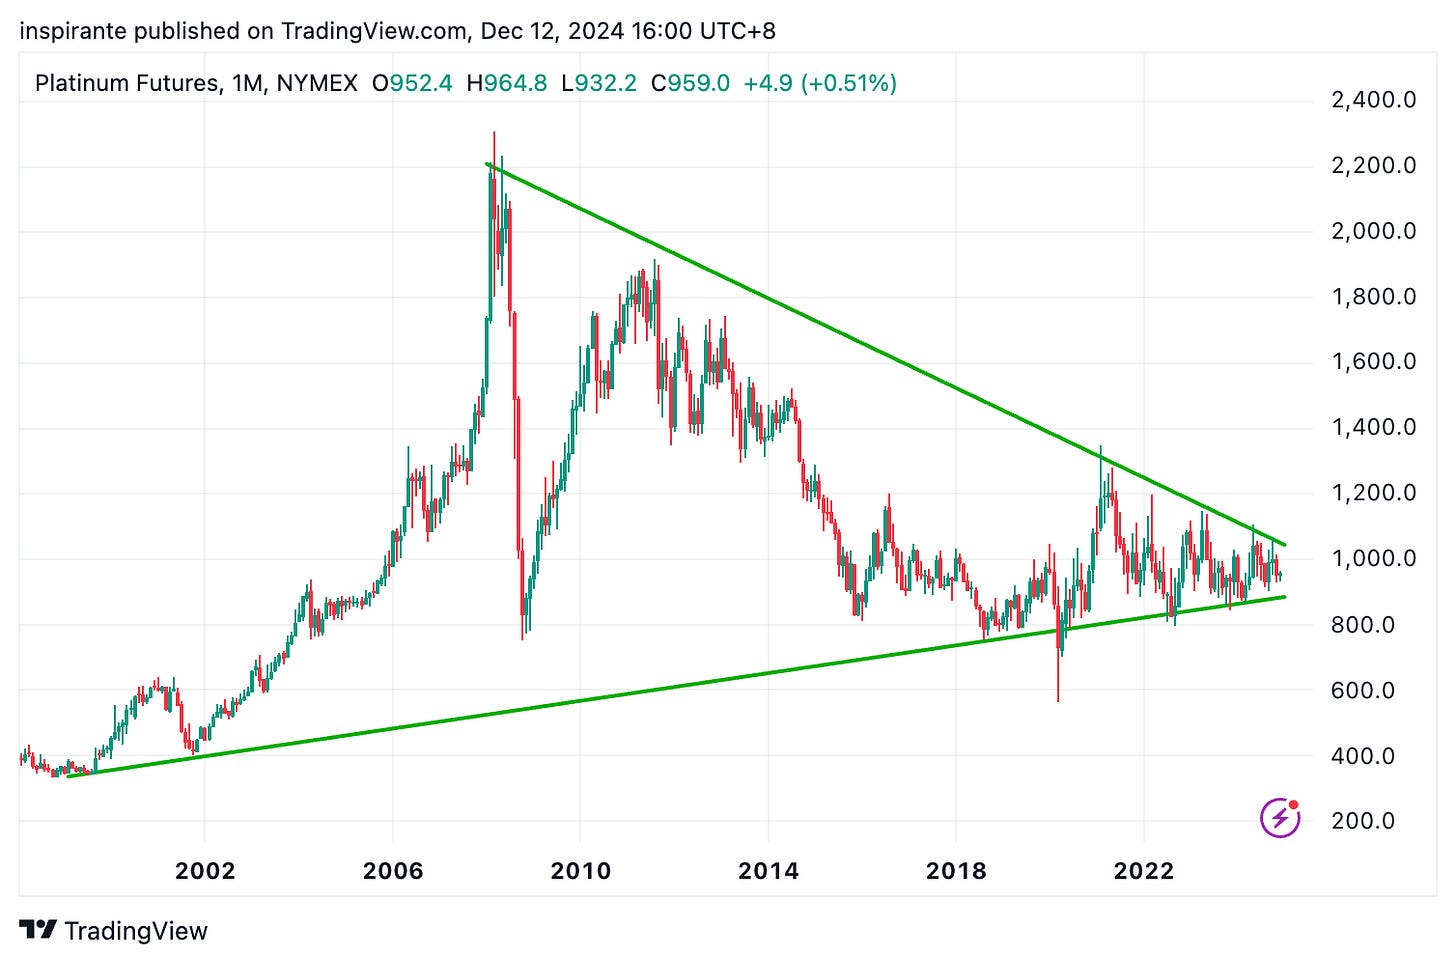
Platinum remains confined within a multi-decade symmetrical triangle, reflecting sustained price and volatility compression. The eventual breakout should define the next major trend.
After a tumultuous 2018–2024 period, Palladium has tested and bounced off key historical support around 800.
Crude oil prices continue hovering near significant support between 60 and 70. A failure at this level would open the door to substantial downside risk.
Gasoline prices are likewise holding at a major horizontal support near 2.0. A decisive move in crude oil could coincide with a similar one in gasoline.
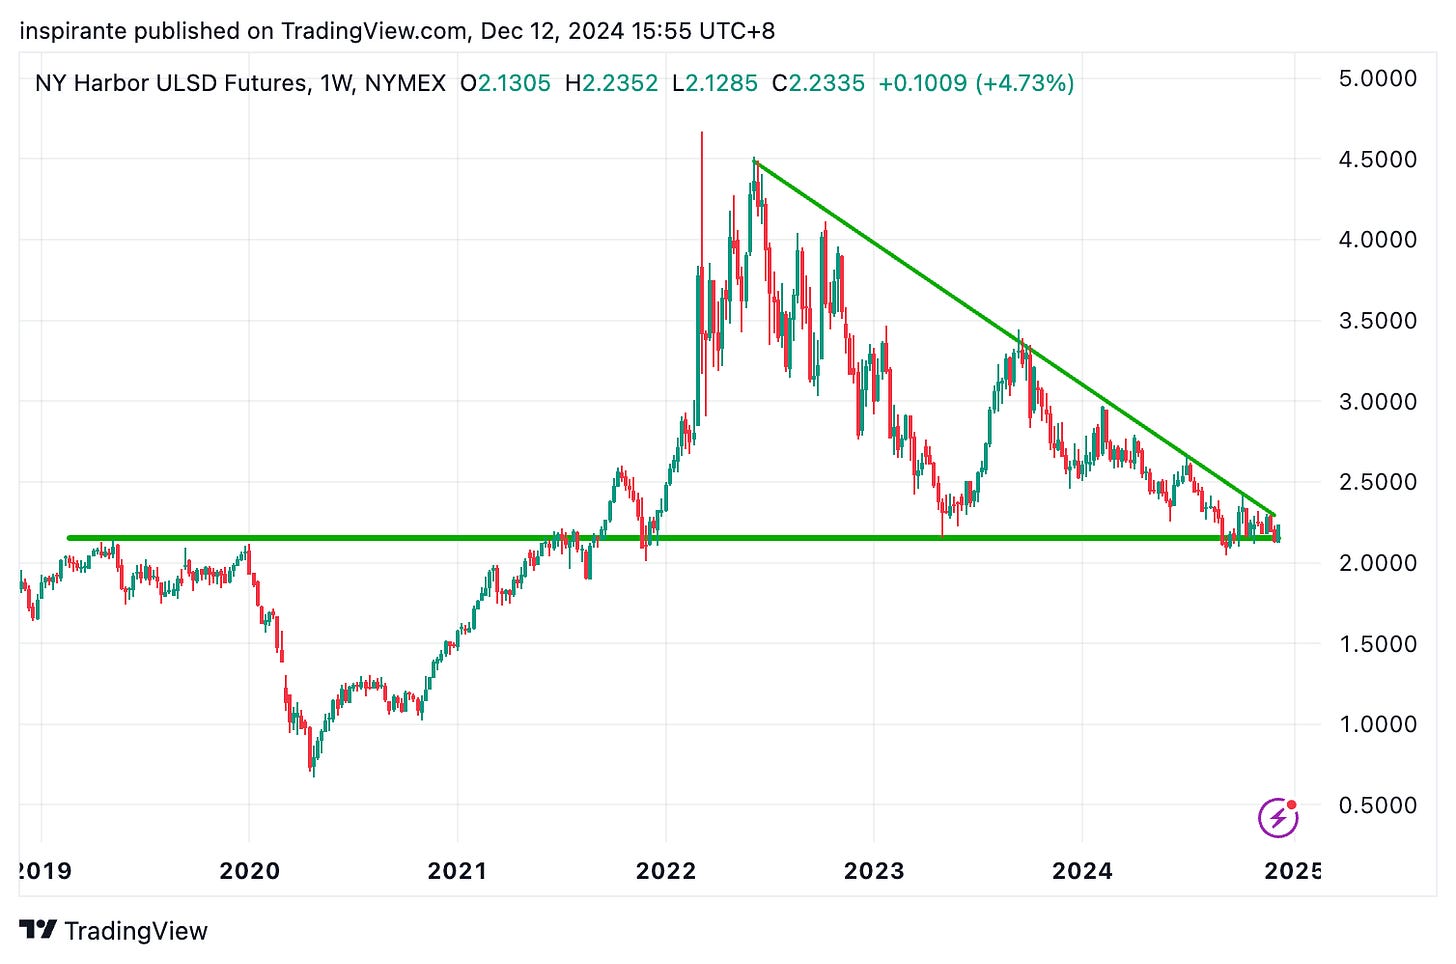
Heating oil is approaching the apex of a descending triangle at multi-year support, suggesting a significant move may be imminent.
Feeder cattle prices are on the verge of breaking out from an ascending triangle pattern at all-time highs, potentially triggering a strong bullish move.
The U.S. 5-year Treasury yield remains supported at 3.5%. Given current inflation expectations, a break below this key level appears unlikely.
Original link here.
EXAMPLES CITED ABOVE ARE FOR ILLUSTRATION ONLY AND SHALL NOT BE CONSTRUED AS INVESTMENT RECOMMENDATIONS OR ADVICE. THEY SERVE AS AN INTEGRAL PART OF A CASE STUDY TO DEMONSTRATE FUNDAMENTAL CONCEPTS IN RISK MANAGEMENT UNDER GIVEN MARKET SCENARIOS. PLEASE REFER TO FULL DISCLAIMERS AT THE END OF THE COMMENTARY.


