

Keep the lights on
First published on 2022-08-31


Markets in Focus
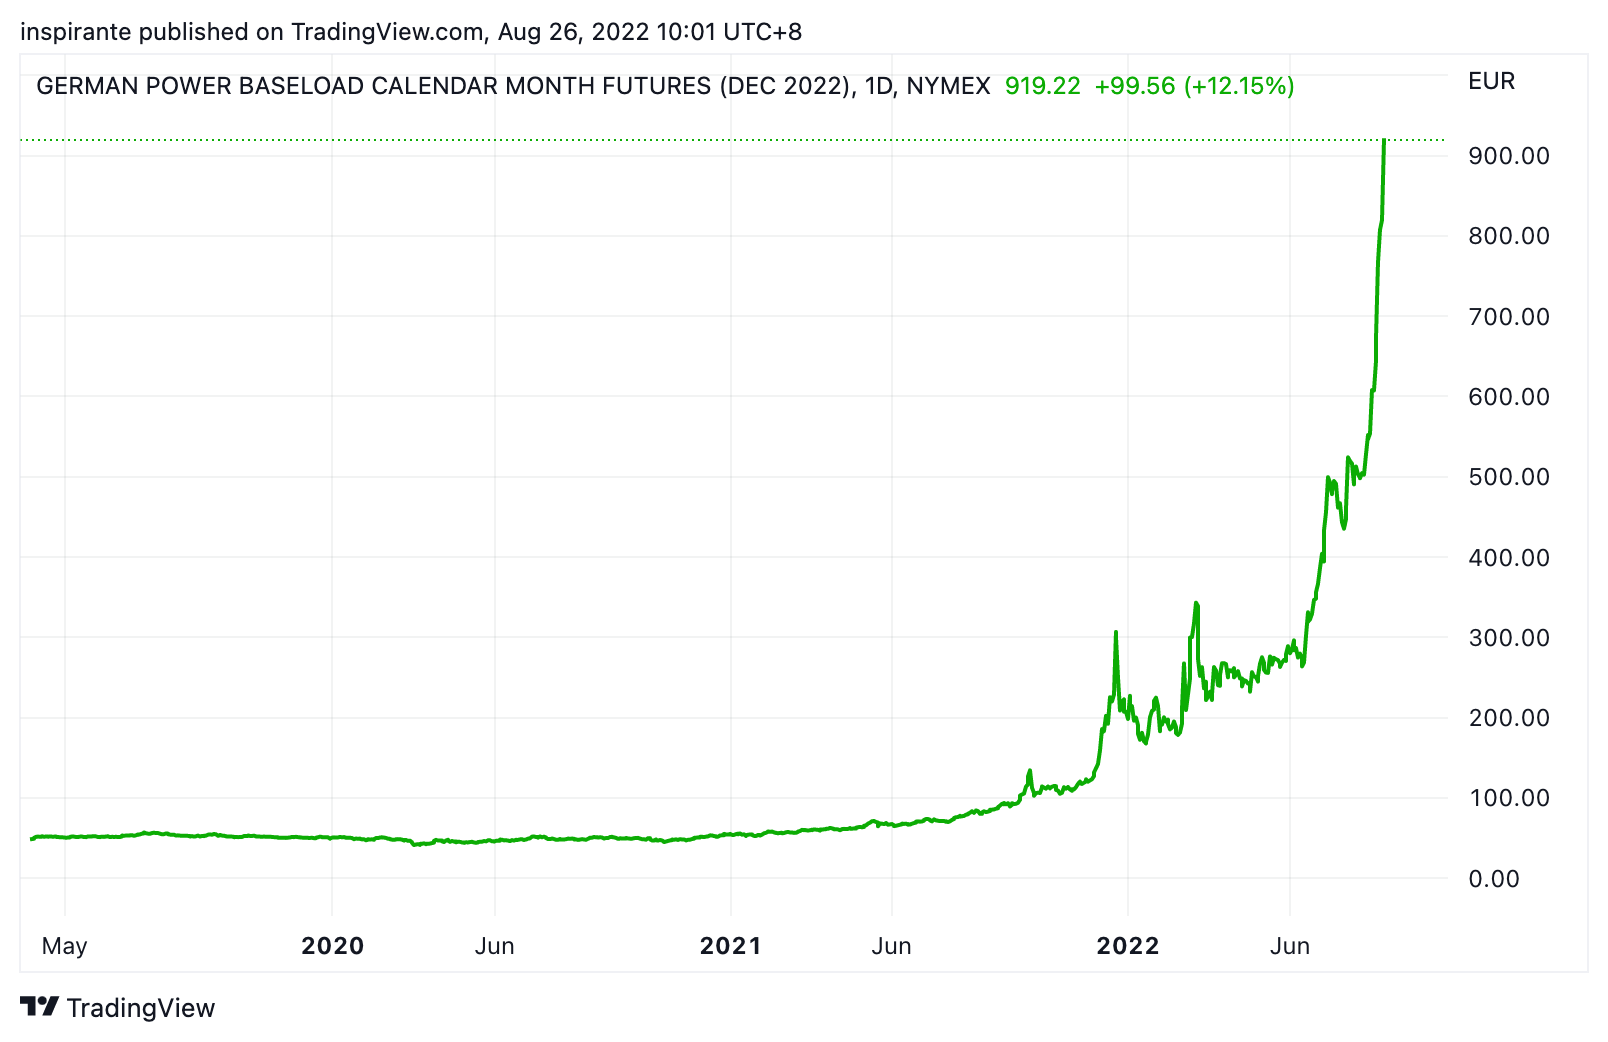
European electricity prices are literally going through the roof. German power baseload price surged more than 10 times from a year ago. The same thing is happening in other European neighbors such as France and Italy.

In our previous issue, we noted that USD/CNY was near the end of consolidation and risked breaking out higher. In the past two weeks, the symmetrical triangle was indeed broken decisively to the upside. Based on Classical Charting principles for measuring price targets, we could see USD/CNY reaching 7.15.

Copper calendar spreads tend to move in tandem with the outright price. However, at critical turning points, the calendar spreads sometimes would offer leading signals on the direction of the outright move later, as shown in the two shaded periods. The December 2022 – March 2023 spread has formed a solid base and looks to be breaking out higher. This is bullish for copper price in the coming few months.

Corn has completed an inverted Head-and-Shoulder (H&S) bottom. Note the striking similarity between the H&S bottom now and the H&S top a few months ago, in terms of the timespan, the magnitude, as well as the slanted shape of the two H&S patterns. If corn breaks above the 680 region, it could reach 760 to test the previous high.
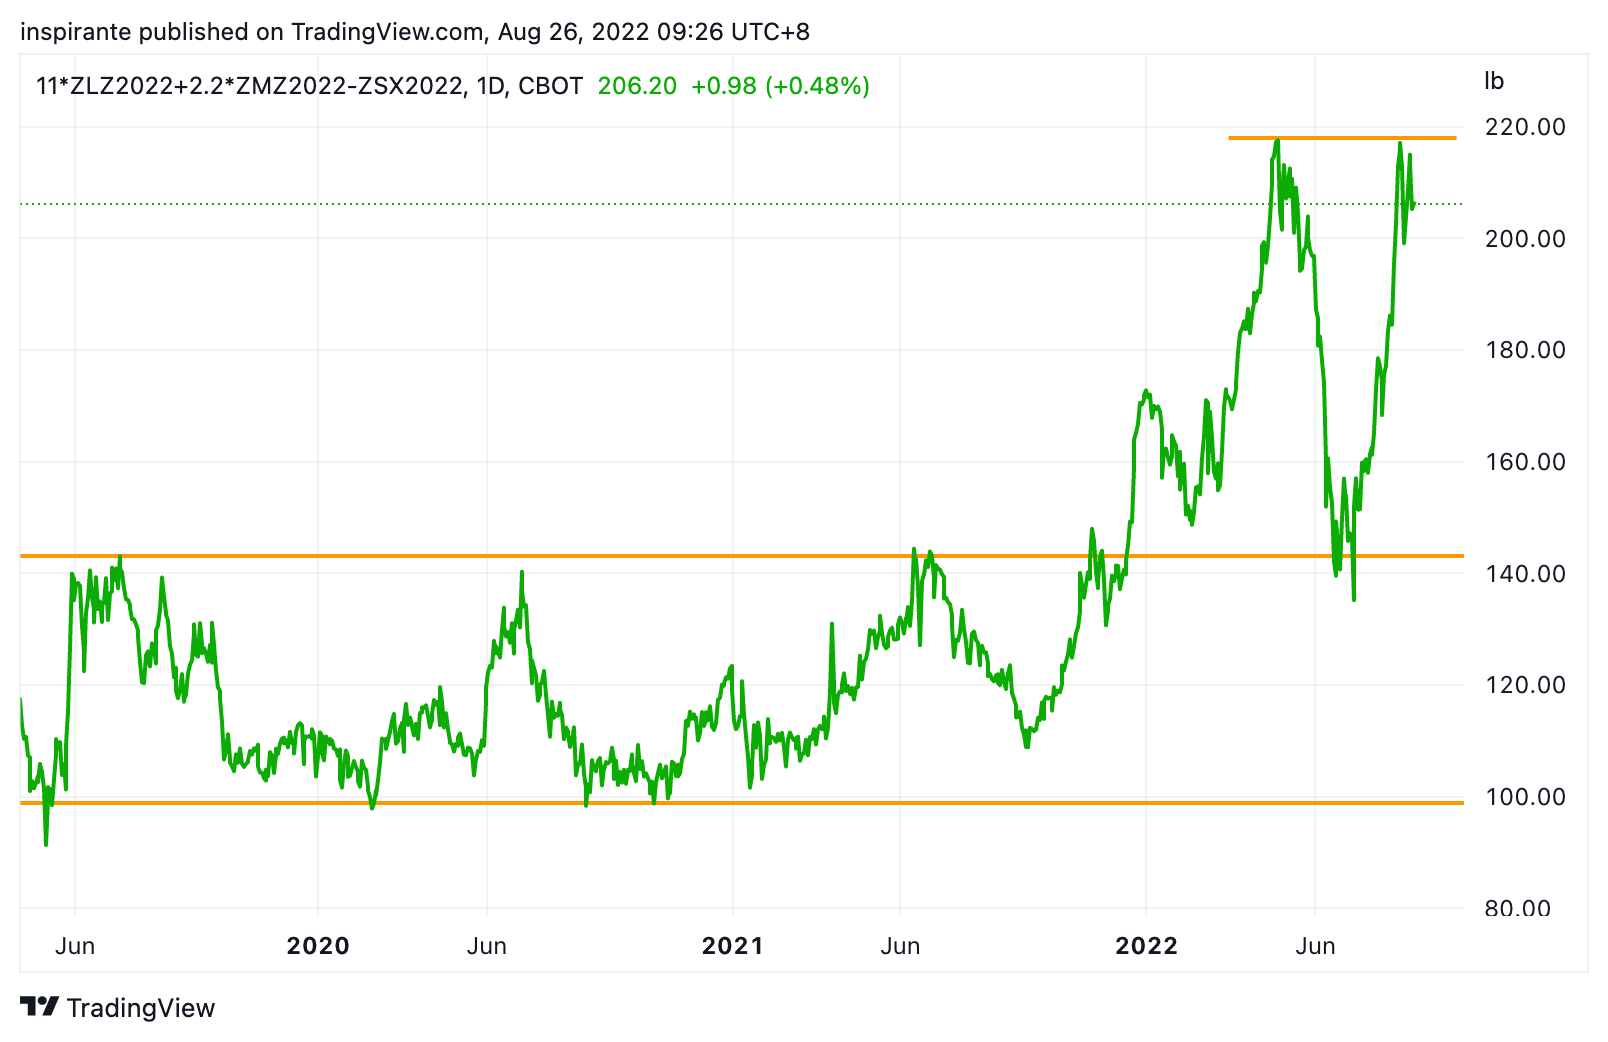
The Soybean Crush spread, constructed by selling soybean oil and soybean meal, and buying soybean, has turned down from a historical high and resistance at 220. If it plays out like the first half of 2022, we could see the crush spread narrowing back to the 140 region.
Market Views
While Wall Street focuses on the annual Jackson Hole Economic Policy Symposium, where central bankers gather to discuss important policy issues, Main Street is facing something much more urgent and impactful – the global energy shortage. Europe is undoubtedly at the epicenter where the natural gas and electricity prices go parabolic. Without looking at the ticker, it is easy to relate the charts to some latest meme stocks getting short-squeezed. Major European countries, such as Germany, France, and Italy, are seeing their power baseload prices surge more than 1000% (yes, that’s 10 times) than merely a year ago. As the winter season approaches, we wonder if Europe can keep the lights on till year-end. Literally.
In mid-July, we suggested that short-term pessimism, profit-taking, and recession fear have led the agriculture market to substantial correction, and a local bottom could be in. Indeed, many grains have formed very constructive bottom patterns since then. This adds more conviction to our view that the next leg higher for foodstuff has properly begun.
In recent years, the energy and agriculture markets have become deeply inter-connected, mainly due to the wide use of fertilizers to increase crop yields, to which natural gas is a key input, and the increasing demand for biofuels which takes a portion of grain supplies away from food into the energy market. In other words, an energy crisis will ultimately ripple into other markets, especially agriculture, and likely lead to a food crisis.
Many investors are searching for the right inflation hedge in the current macro environment where most of the traditional “hedges” produced lackluster performance. For example, gold has lost more than 15% since March and is currently trading at the same level as April 2020. Nasdaq is still down more than 20% from the high despite the recent 20% bear market rally. In addition, it is still facing headwinds from a hawkish Fed that will tighten financial conditions further, making equities a less desirable inflation hedge from a risk/reward perspective. Given the dire situation of global energy and food shortage, we view agricultural commodities among the best inflation hedges right now.
How to play the theme out
A hypothetical investor can consider the following trades1:
Case Study 1: Long Corn
If the investor were to long the Corn future (ZCZ2) at 650 and set the stop below 620, his maximum loss per contract would be (650 – 620) x 50 = 1500 USD. An initial target points to 700 and subsequently 760, resulting in (700 – 650) x 50 = 2500 USD and (760 - 650) x 50 = 5500 USD.
Case Study 2: Short Soybean Crush Spread
If the investor were to short the Soybean Crush Inter-Commodity Spread (SOM:SI U2-U2-X2) at 205, and set the stop above 220, his maximum loss per spread would be (220 – 205) x 500 = 7500 USD. An initial target points to 180 and subsequently 140, resulting in (205 - 180) x 500 = 12500 USD and (205 – 140) x 500 = 32500 USD.
Original Link: https://www.cmegroup.com/newsletters/fresh-from-the-trading-room/files/fresh-from-the-trading-room-2022-08-29.pdf
Examples cited above are for illustration only and shall not be construed as investment recommendations or advice. They serve as an integral part of a case study to demonstrate fundamental concepts in risk management under given market scenarios.
 | A guest post by
|