
Looking in the abyss


Markets in Focus
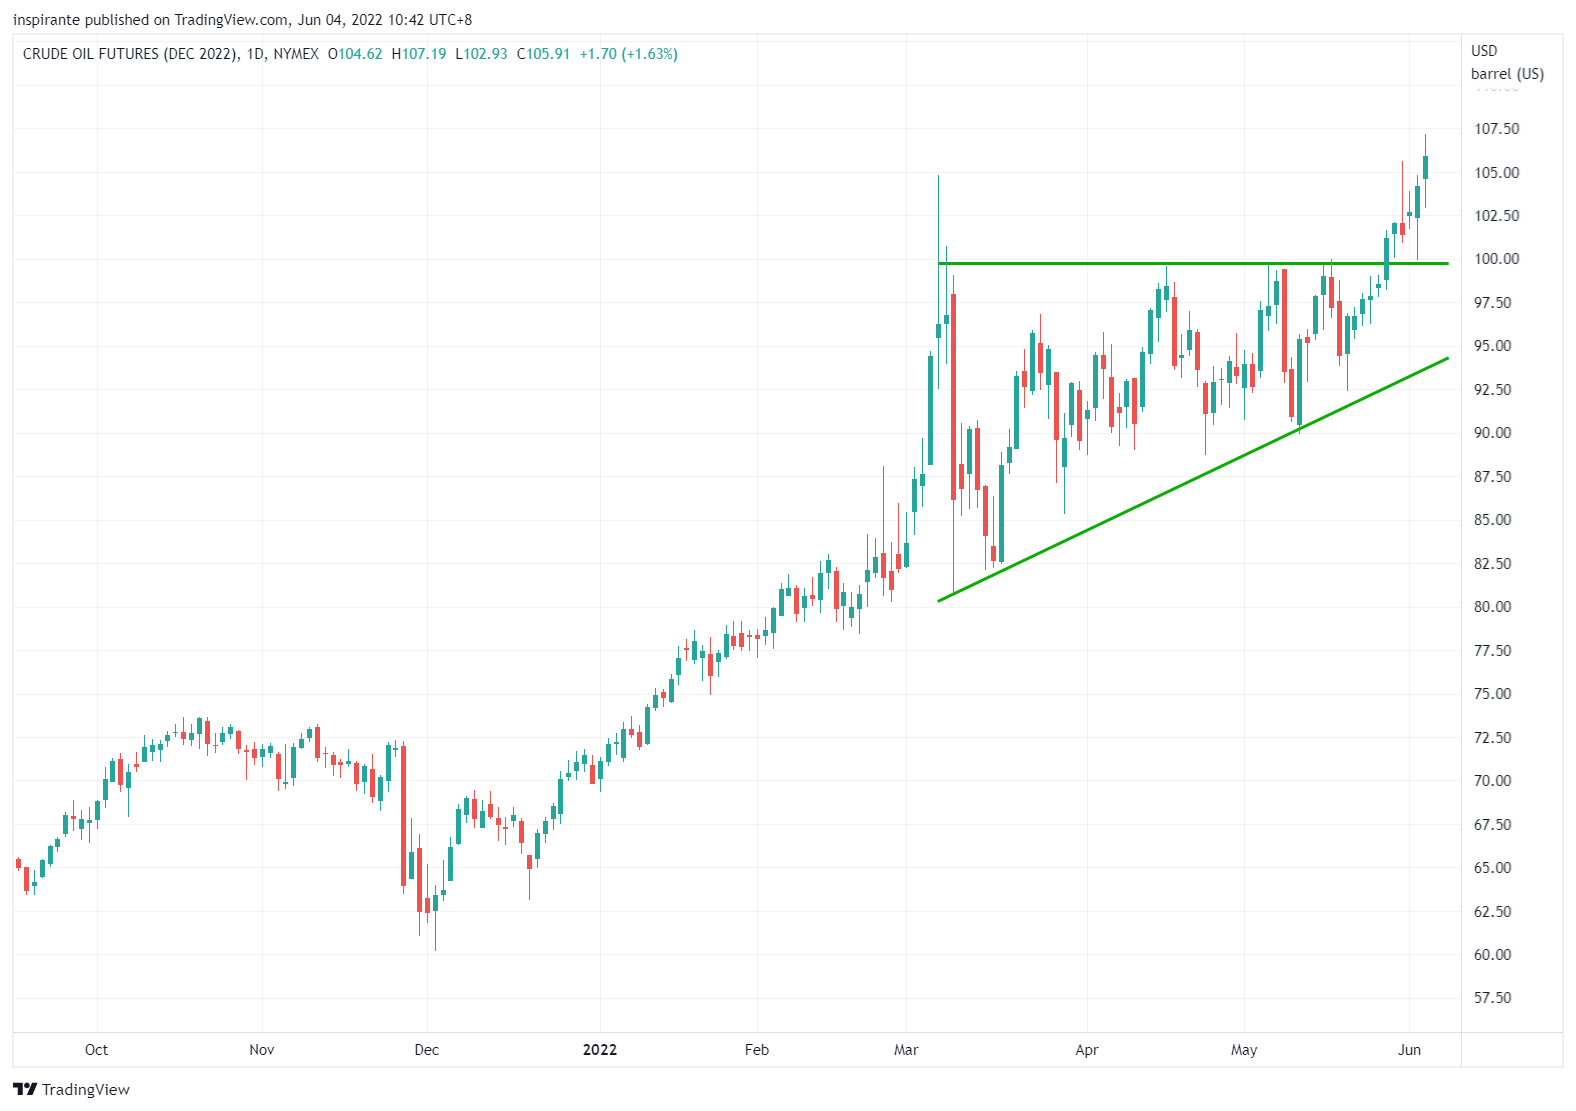
The Dec 2022 WTI Crude Oil contract has broken a well-defined ascending triangle. The resistance-turned-support level at 100 was retested on Thursday and successfully held. After three months of consolidation and the impact of short-term geopolitical news, the fundamentals of the energy shortage problem have once again become the dominant driver for crude oil’s next leg higher.
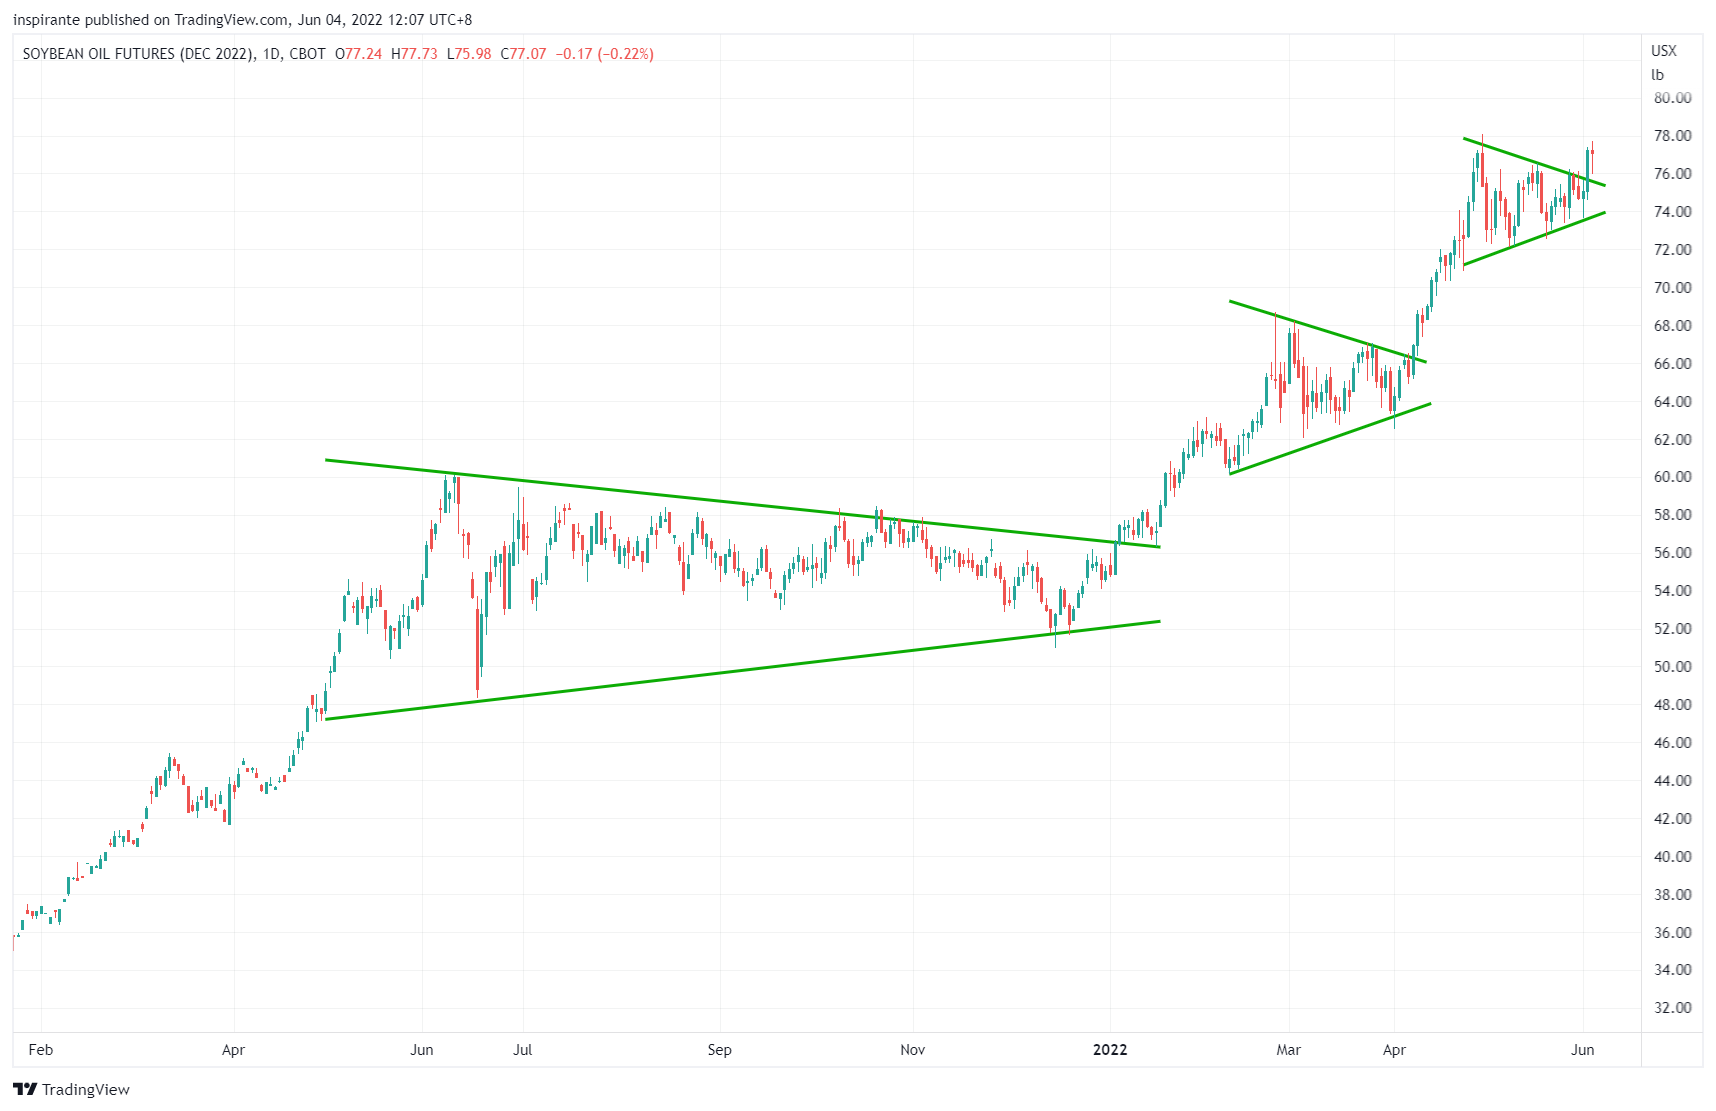
Like fossil fuels, edible oils have also been climbing higher, despite other soft commodities experiencing a significant retracement currently. The price action of soybean oil tends to break out from symmetrical triangles and resumes the rally after that, as seen on two previous occasions since 2021. The Dec 2022 Soybean Oil contract has broken yet another symmetrical triangle continuation pattern.

The Canadian Dollar has been closely correlated with crude oil since early 2000. It is because Canada earns most of its US Dollars from the sale of crude oil. Since the beginning of this year, we have seen a significant divergence between the two. General US Dollar strength due to a hawkish Fed could be the explanation. Still, we do expect the Loonie to catch up soon, especially if the Bank of Canada continues its rate hikes and quantitative tightening.
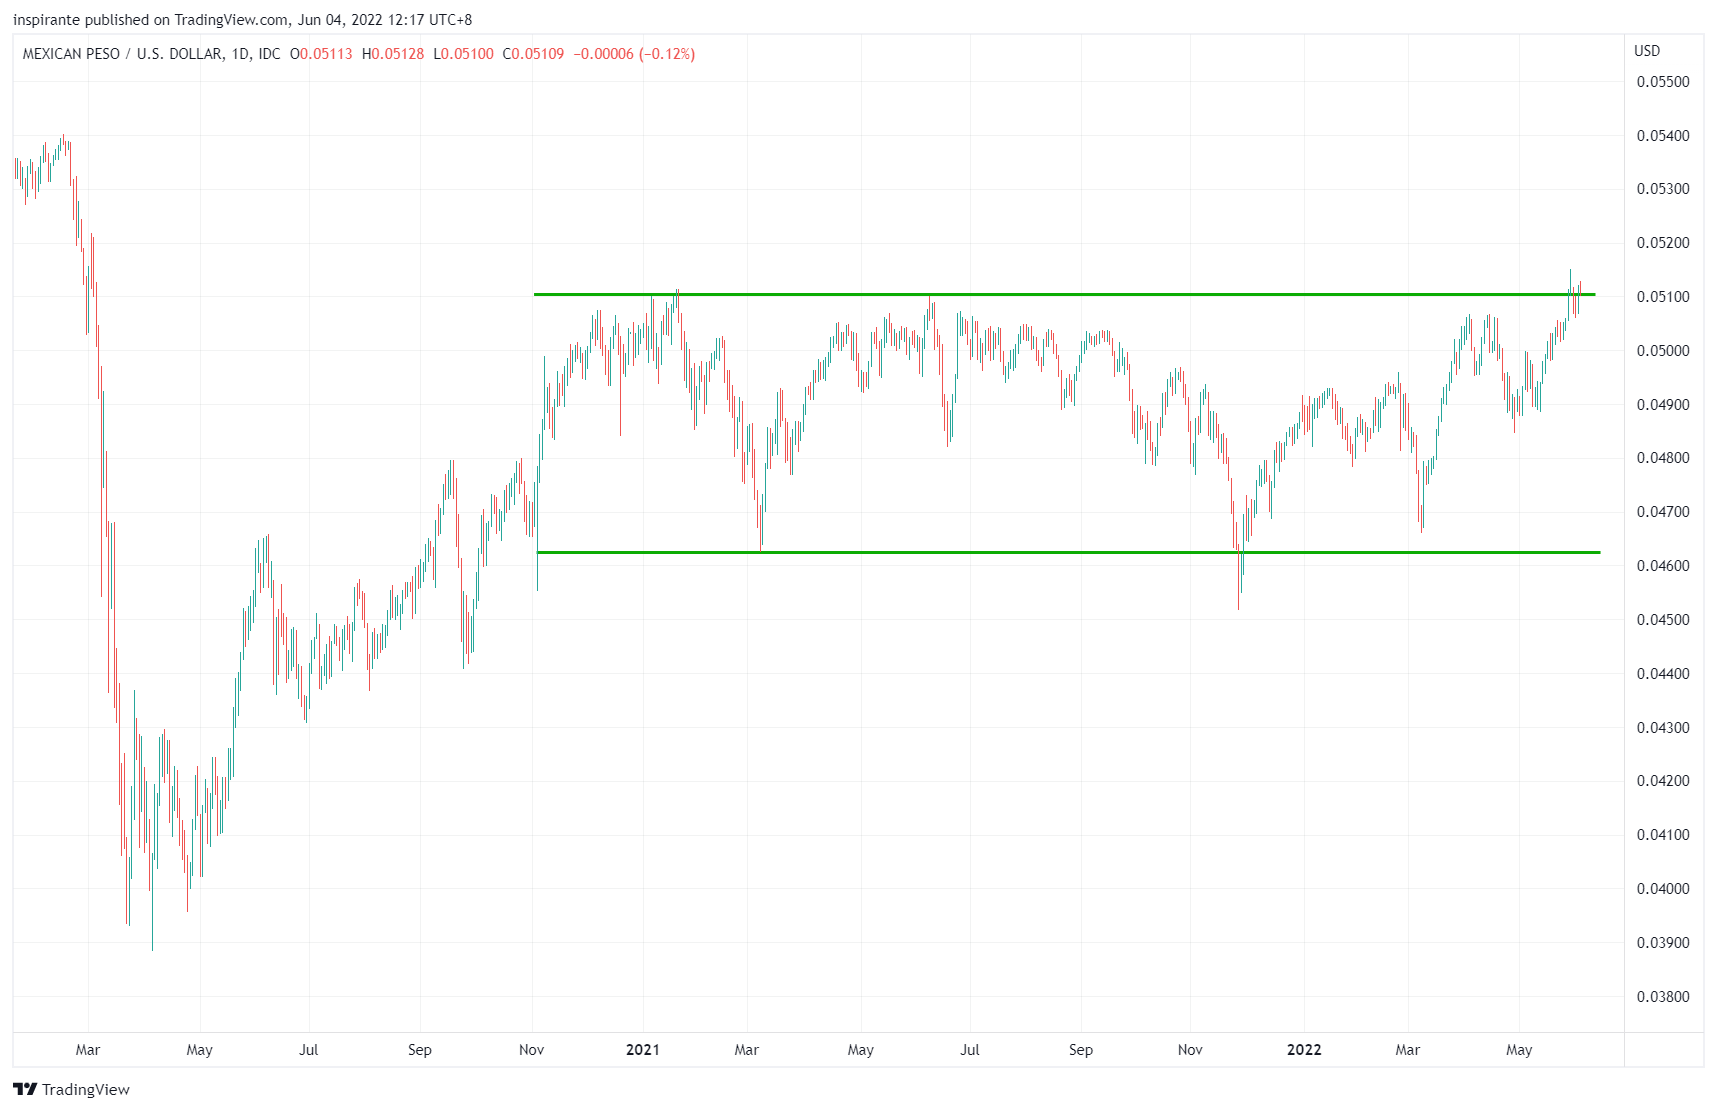
The Mexican Peso also moves with energy prices as Mexico is one of the largest petroleum producers globally. Its correlation with crude oil is also significant since 2008. Like the Canadian Dollar, the Mexican Peso’s strength against the US Dollar has lagged the oil move considerably. However, it is on the verge of breaking out from an 18-month rectangle range, which is very bullish for the Peso.
Market Views
While we have outlined the potential sharp reversals in many assets in the May 25th issue, the Nasdaq index rebounded more than 12% from the low registered on May 20th. With the Nasdaq index down more than 20% from the high, many investors wonder if it was the bottom for tech stocks and the more general equity market. Unfortunately, we find the probability for that scenario rather low.
From a fundamental perspective, as measured by the Goldman Sachs Financial Conditions Index, the tightness of financial conditions has only reached the pre-COVID level, despite inflation being the highest in 40 years. In other words, the Fed may still need to tighten the financial conditions further to cool down economic activities via a combination of tools, including rate hikes and quantitative tightening (QT). Low rates and quantitative easing (QE) have certainly contributed to the stellar equity market performance since the Great Financial Crisis in 2008. Many investors believe that the combination of low rates and QE may very well be the single largest driver. If so, it is more than reasonable to predict the tremendous pressure on risk assets given the drastic policy reversals.
The global energy and food shortage has been a recurring theme in our past commentaries since early 2021. We see some countries running out of fuel and others where filling the tank has become prohibitively expensive for the citizens. We also see countries banning various food exports, ensuring domestic demand is met first. Energy and food prices have skyrocketed, pushing inflation to levels that some people have never seen in their lifetime. Besides the economic implications that are not friendly to risk assets, humanitarian crises are also happening in many less developed countries.
From a technical perspective, the recent rebound in the equity market was merely a counter-trend rally. It does not alter the dominant downtrend until a higher high and higher low are registered, and a proper bottom is confirmed. Moreover, the VIX has been trending lower and closed at 24.8 for the week. It suggests that the equity market price actions have been orderly, and there is only limited buying of volatility and equity downside protections. Historically, bottoms seldom happened when VIX was at these low levels. In other words, the market is not panicky and certainly has not capitulated!
We have painted a bleak picture of the financial market for the next few months. There are so many cross currents in the macro environment that it is nigh on impossible to predict how all these will turn out eventually. It will not be easy for many people because the coming months and years will be nothing like the past decade. Therefore, it is time for investors to be discrete, defensive, and disciplined. Watch out for signs of FOMO (fear of missing out), herd mentality, and recency bias! Putting risk management and capital preservation as top priorities is crucial to getting through the uncertainty and challenges unscathed.
“Man looks in the abyss; there’s nothing staring back at him. At that moment, man finds his character. And that is what keeps him out of the abyss.” Wall Street (1987)
How to play the theme out
A hypothetical investor can consider the following trades1:
Case Study 1: Long Soybean Oil Future
If the investor were to long the Soybean Oil future (ZLZ2) at 77 and set the stop below 73.5, his maximum loss per contract would be (77 – 73.5) x 600 = 2100 USD. A measured target points to 90, resulting in (90 – 77) x 600 = 7800 USD.
Case Study 2: Long MXN/USD Future
If the investor were to long the MXN/USD future (6MU2) at 0.05 and set the stop below 0.048, his maximum loss per contract would be (0.05 – 0.048) x 500000 = 1000 USD. An initial target points to 0.055 and subsequently 0.058, resulting in (0.055 – 0.05) x 500000 = 2500 USD and (0.058 – 0.05) x 500000 = 4000 USD.
Original Link: https://www.cmegroup.com/newsletters/fresh-from-the-trading-room/files/fresh-from-the-trading-room-2022-06-08.pdf
Examples cited above are for illustration only and shall not be construed as investment recommendations or advice. They serve as an integral part of a case study to demonstrate fundamental concepts in risk management under given market scenarios.
 | A guest post by
|