
Navigating a sideways market
Navigating a sideways market
First published on 2023-05-31


Flipping through the markets
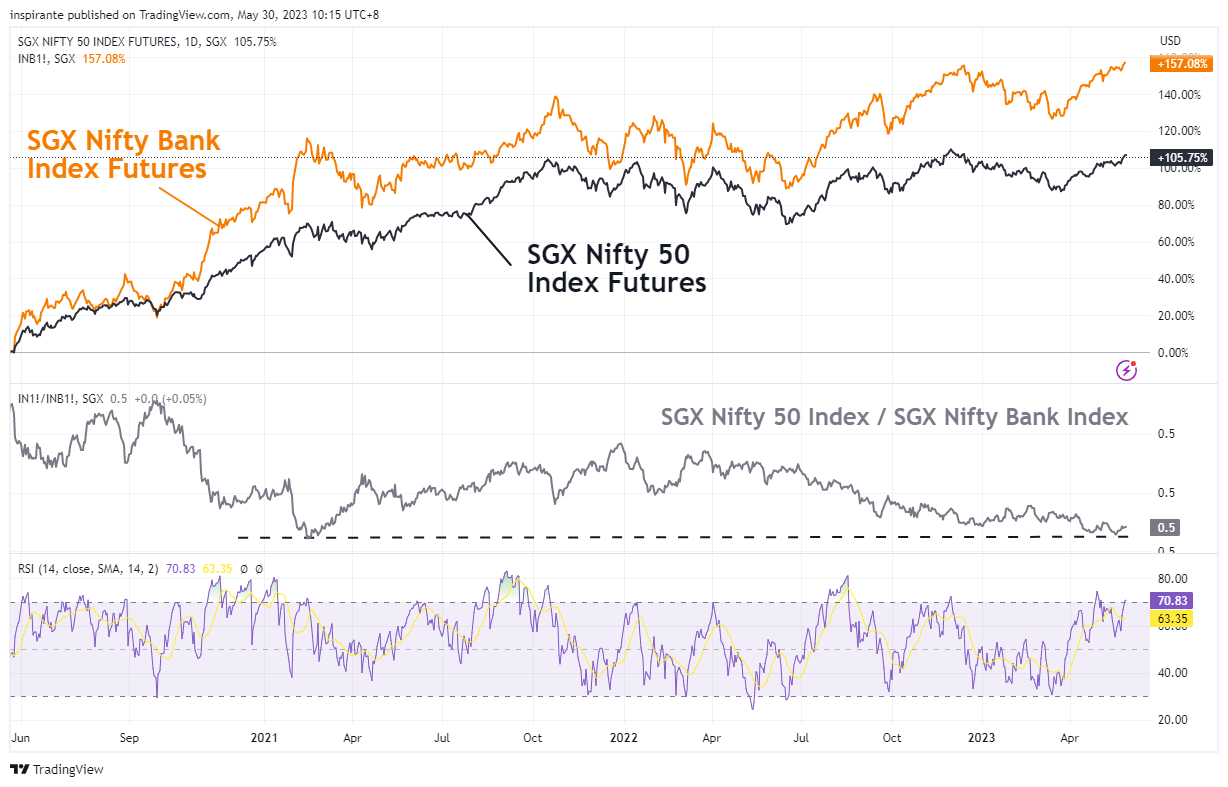
Nifty Bank Index has demonstrated significant outperformance, bucking the trend of the Nifty 50 Index. As a result, the ratio of the 2 index is now back to the 2021 lows. At 38.4% of the Nifty 50 Index, the Financial sector is the largest sector of the index.

Our March call to long this spread played out perfectly, with the FTSE Taiwan rallying higher. Now, however, we question if the rally has been overdone with the spread encroaching on all time highs. The bounce off the previous high seem to indicate some weakness for this spread, and we think the time to short the spread has come.
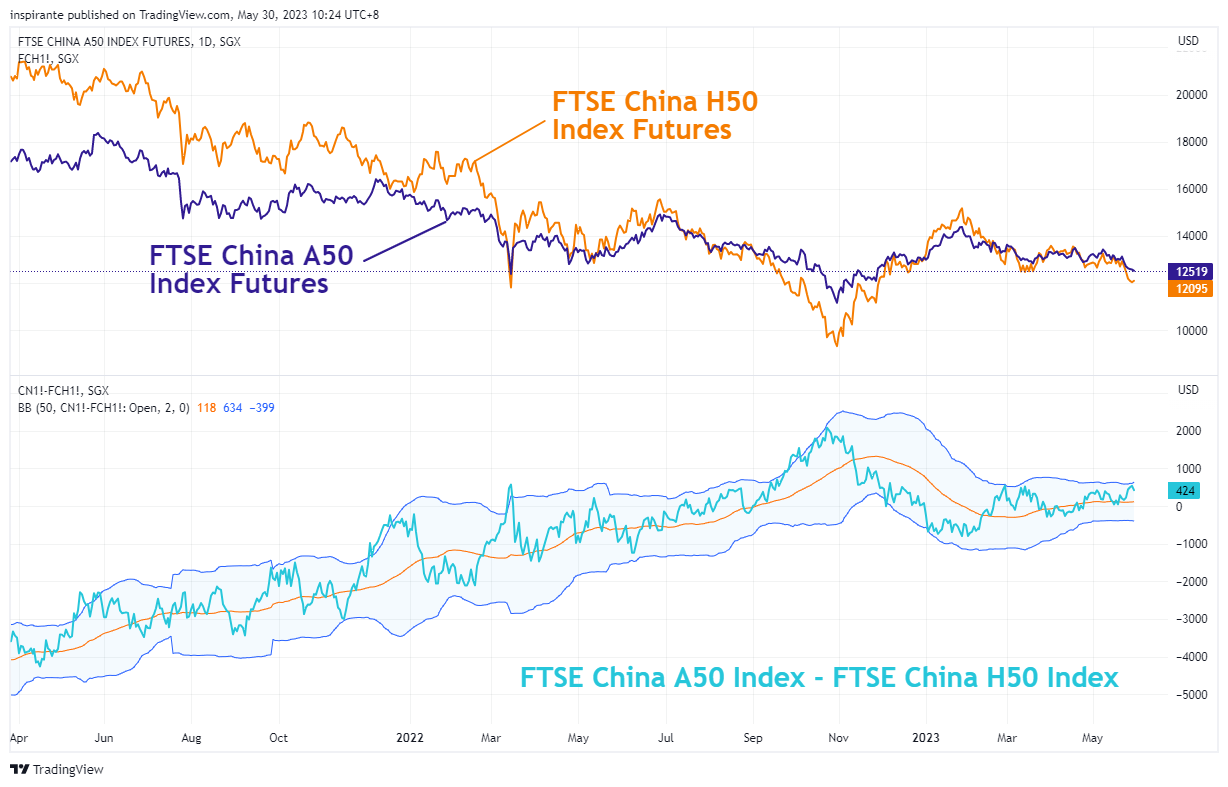
One way to look at the China market is through the lens of a pair trade. For example, the FTSE China A50 and H50 has similar names in both index and 74% correlation. Using a Bollinger Band to demarcate the variances shows a tradable range when the spread between the two indices trades out of the Bollinger Band. With the spread just breaking the upper band, we see a potential to short the spread here.
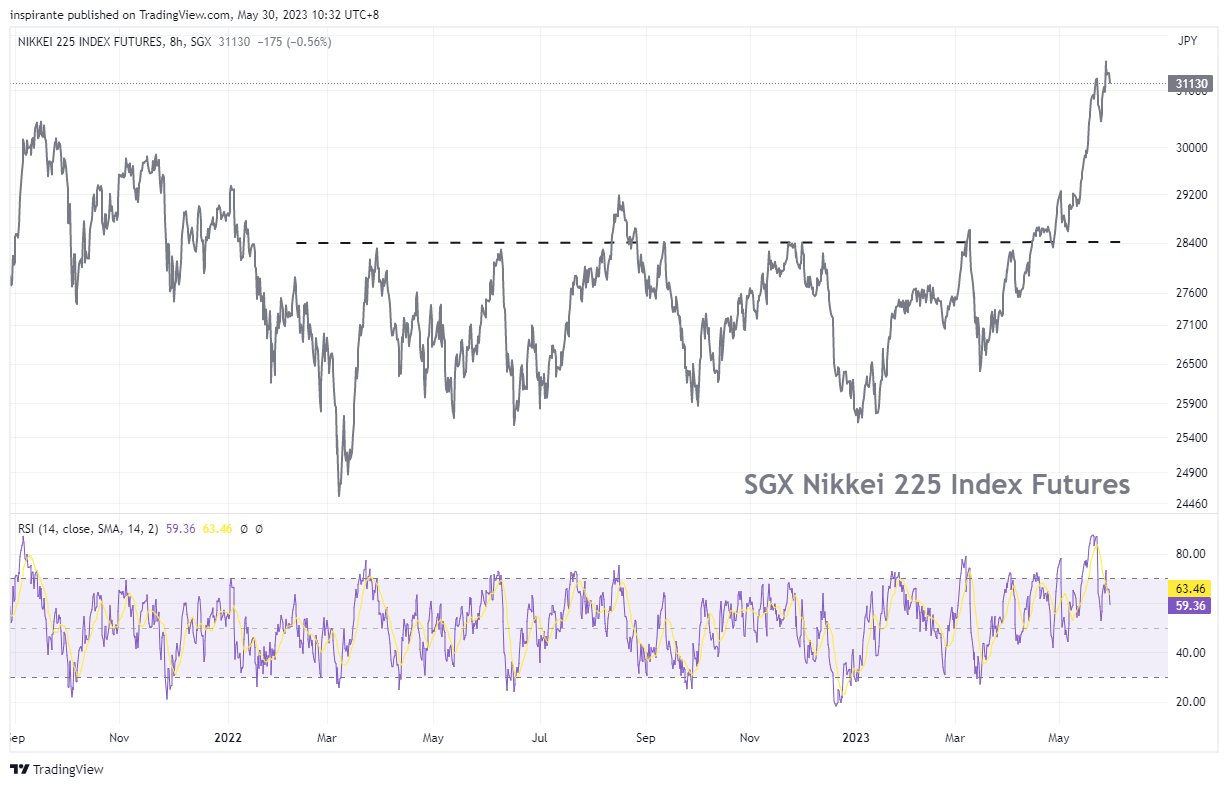
The last time the Nikkei 225 was at this level, the world was a vastly different place – text messaging was non-existent, George H.W. Bush was the president of the United States, and the Soviet Union was still intact. While we gaze in awe, we cautious readers to consider the upcoming BOJ meeting for any changes as inflation in Japan remains well above the 2% target, currently at 3.2%.
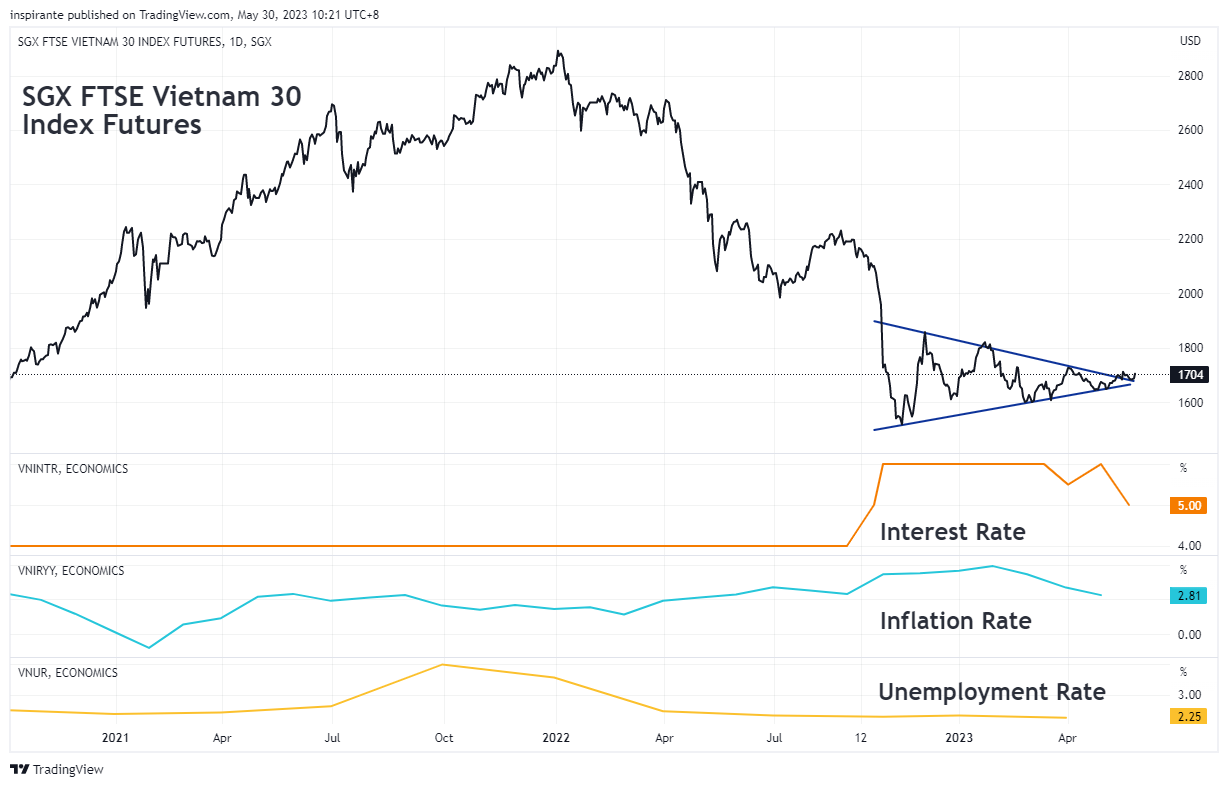
As pointed out in last month’s edition, we have been keeping an eye out for the Vietnam 30 Index. The recent move higher confirms a break of the symmetrical triangle to the upside, which generally signals a bullish continuation. With currently tepid inflation and low unemployment rates, the economic backdrop suggests potential for this market.
What’s inside our playbook?
Currently, it seems that the entire market is in anticipation mode, with major indexes trading within a range. Traders are keeping a close eye on several potential catalysts: the resolution of the ongoing debt ceiling saga, the possible unfolding of a much-anticipated recession, and the outcomes of upcoming central bank meetings in June.
However, for the astute trader, such range-bound markets can also present a wealth of opportunities when examined more closely. One strategy worth considering is the formation of ratio or absolute spreads by combining indexes. This approach allows us to mitigate the overall market trends' impact while capitalising on potential mispricing within individual indexes.
Consider equity indexes, for instance. Each index provides a composite snapshot of diverse sectoral influences, regional economic trends, and individual company performances. When strategically paired, these indexes can unveil intriguing trading opportunities, independent of broad market movements. Overexuberance in a particular sector, such as the current AI/Chips frenzy seen in Nvidia, might initially be driven by momentum traders riding the wave higher, but it could eventually revert to the trend mean as market realities take hold.
In this edition, we highlight three main types of spreads. First, we examine intra-market spreads, such as the Nifty 50 and Nifty Bank spread. This approach focuses on a single market, in this case, India, and leverages the sector variances within that market.
Second, we discuss a regulation or market access-related spread between the China A50 and H50. The H50 Index components differ due to their compliance with "US Executive Order-compliant names," leading to potential imbalances between the two indexes when capital flows are skewed and investors aim to express a general view on China.
Lastly, we delve into geographical spreads, specifically the MSCI Singapore vs FTSE Taiwan spread. These two indexes represent geographically distinct countries with different sectoral emphases - MSCI Singapore being heavily weighted towards financial services, and FTSE Taiwan gravitating towards the technology sector.
Through careful construction and understanding of the underlying themes at play, such spreads can provide additional opportunities in an otherwise sideways market.
Executing the plays
A hypothetical investor can consider the following two trades1:
Case Study 1: Short FTSE Taiwan Index Futures (TWN), Long MSCI Singapore Index Futures (SGP)
We would set up a spread trade by taking a short position on one FTSE Taiwan Index Futures (TWN) at the present level of 1429 and a long position on two MSCI Singapore Index Futures (SGP) at the present level of 288.9, which should give us a ratio entry level of 4.94. To match the notional value of both contracts, a 1 (TWN) : 2 (SGP) ratio is used in sizing the trade. Setting the stop at 5.10 and the take profit at 4.74 could bring us a hypothetical maximum loss of 0.16 spread points and profit of 0.20 spread points. Each 0.25 point move in the TWN contract is 10 USD while a 1 point move in SGP is 100 SGD.
Case Study 2: Short FTSE China A50 Index Futures (CN), Long FTSE China H50 Index Futures (FCH)
We would consider taking a short position on two FTSE China A50 Index Futures (CN) at the current level of 12455 and a long position on one FTSE China H50 Index Futures (FCH) at the current level of 12028. To match the notional value of both contract, 2 (CN) : 1 (FCH) ratio is used in sizing the trade. Setting the stop at 650 spread points and the take profit at 140 spread points could bring us a hypothetical maximum loss of 223 spread points and profit of 287 spread points. Each 1 point move in the CN contract is 1 USD while a 2.5 point move in the FCH contract is 5 USD.
Original Link: https://www.sgx.com/research-education/market-updates/20230531-sgx-traders-playbook-navigating-sideways-market
Examples cited above are for illustration only and shall not be construed as investment recommendations or advice. They serve as an integral part of a case study to demonstrate fundamental concepts in risk management under given market scenarios.
 | A guest post by
|