
Nothing moves in a straight line
Nothing moves in a straight line
First published on 2022-05-25


Markets in Focus
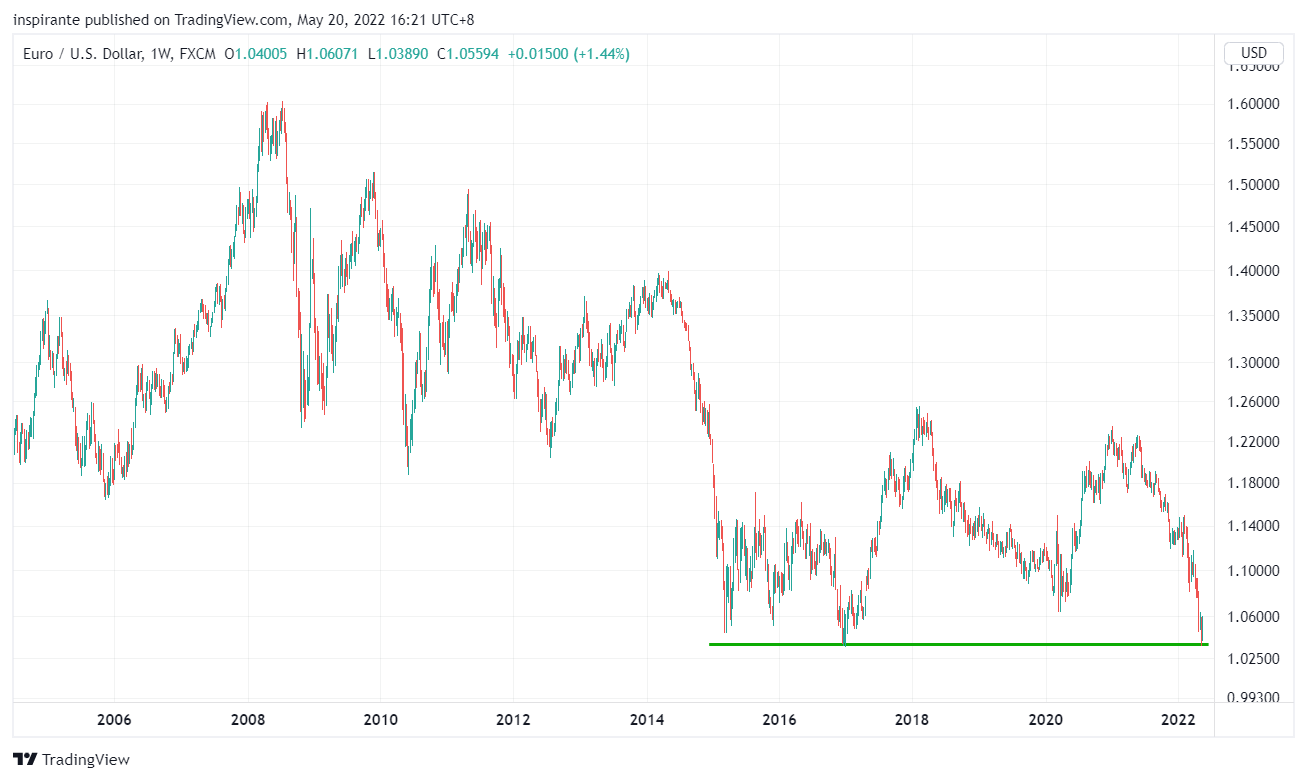
The EUR/USD pair sits on its seven-year support at around 1.03. The US Dollar strengthened substantially against other major currencies in recent weeks’ risk-off events. Across the forex land, we find many pairs running into multi-year support levels. A consolidation or a short-term reversal is the likely outcome in the following weeks.
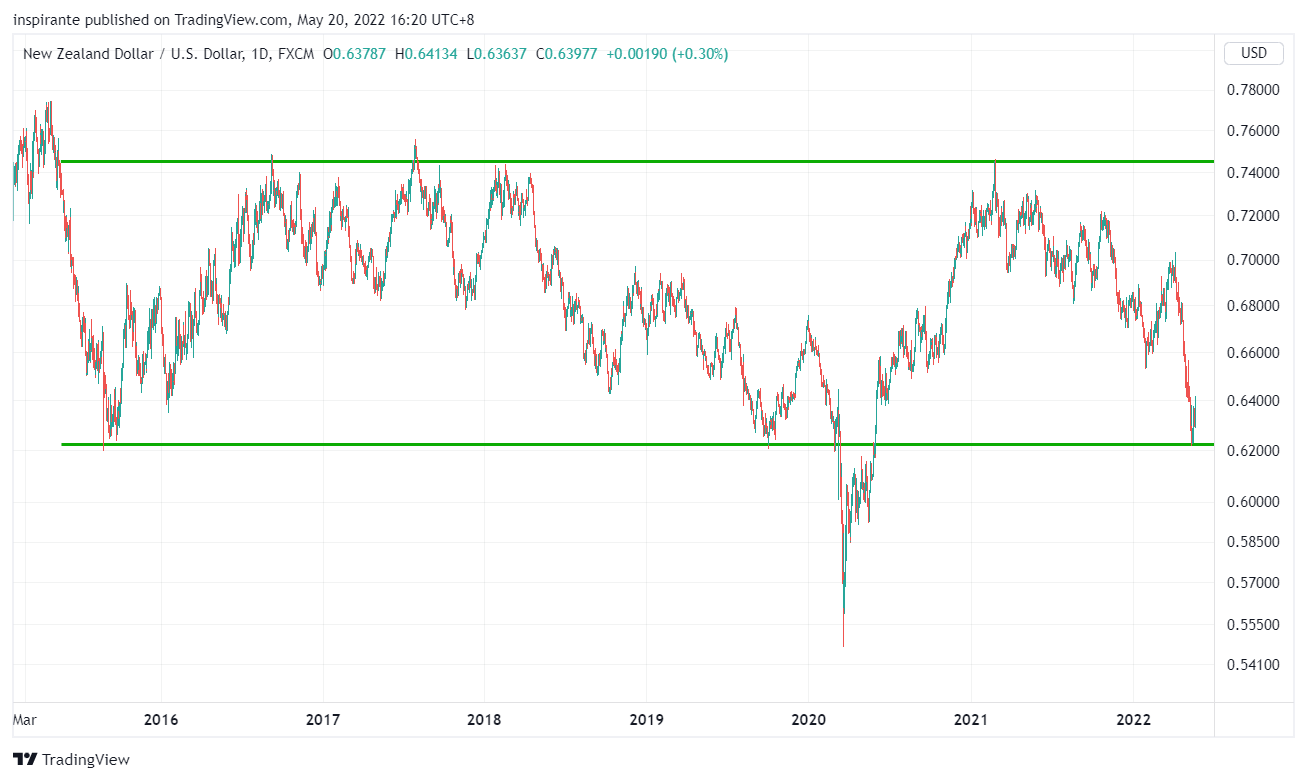
Similarly, the NZD/USD pair also touched the seven-year support at 0.62 and quickly turned around. As the market is consensually positioned on the long side of the US Dollar, profit-taking at such important technical levels could lead to very sharp reversals.

Gold is trading at the four-year trendline. Arguably, the dip below 1800 last week has already broken the trendline. Nevertheless, it remains to be seen if it was a false break. If the Dollar strength starts to reverse as expected, we could see Gold regaining 1900 and above. Otherwise, it could fall to 1700 before finding the next support.
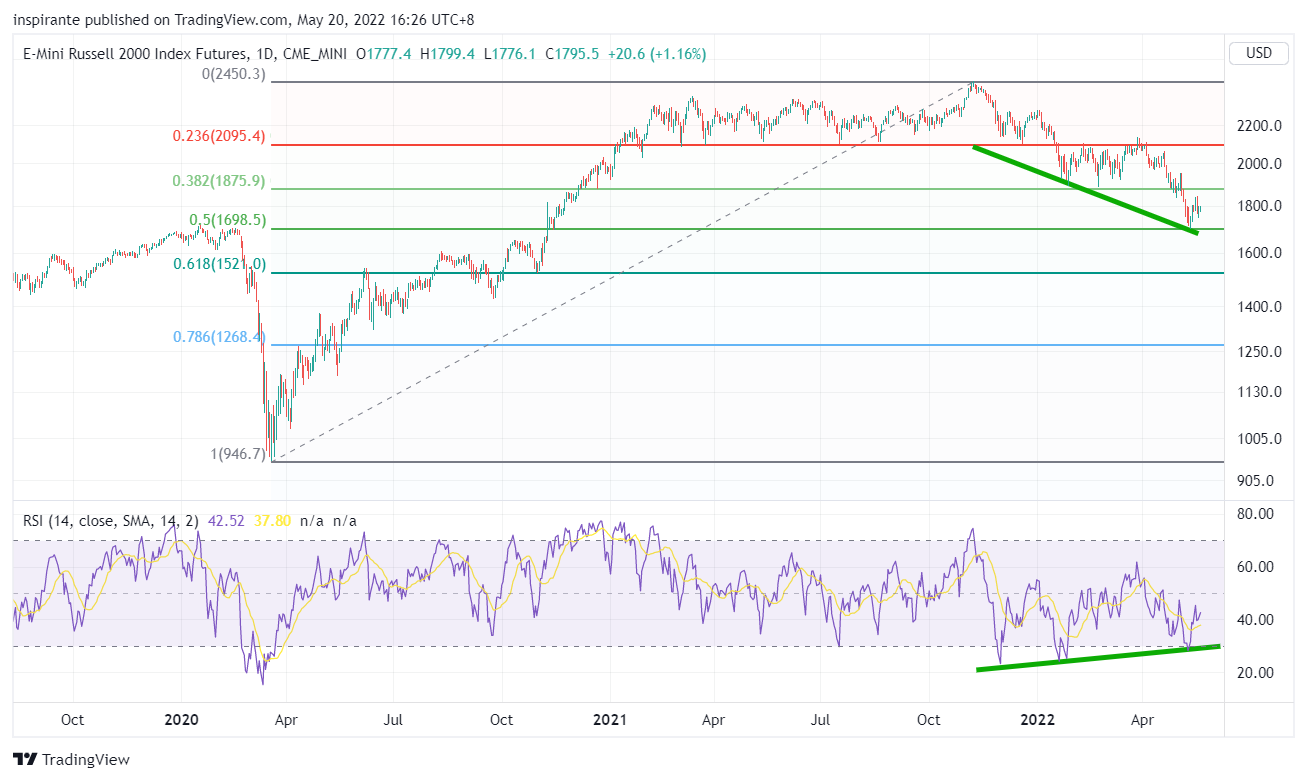
The Russell 2000 index has bounced right at the 50% Fibonacci retracement level near 1700. We also observed bullish RSI Divergence where price made lower lows, but RSI showed higher lows, suggesting the bearish momentum is waning and at the cusp of a reversal.
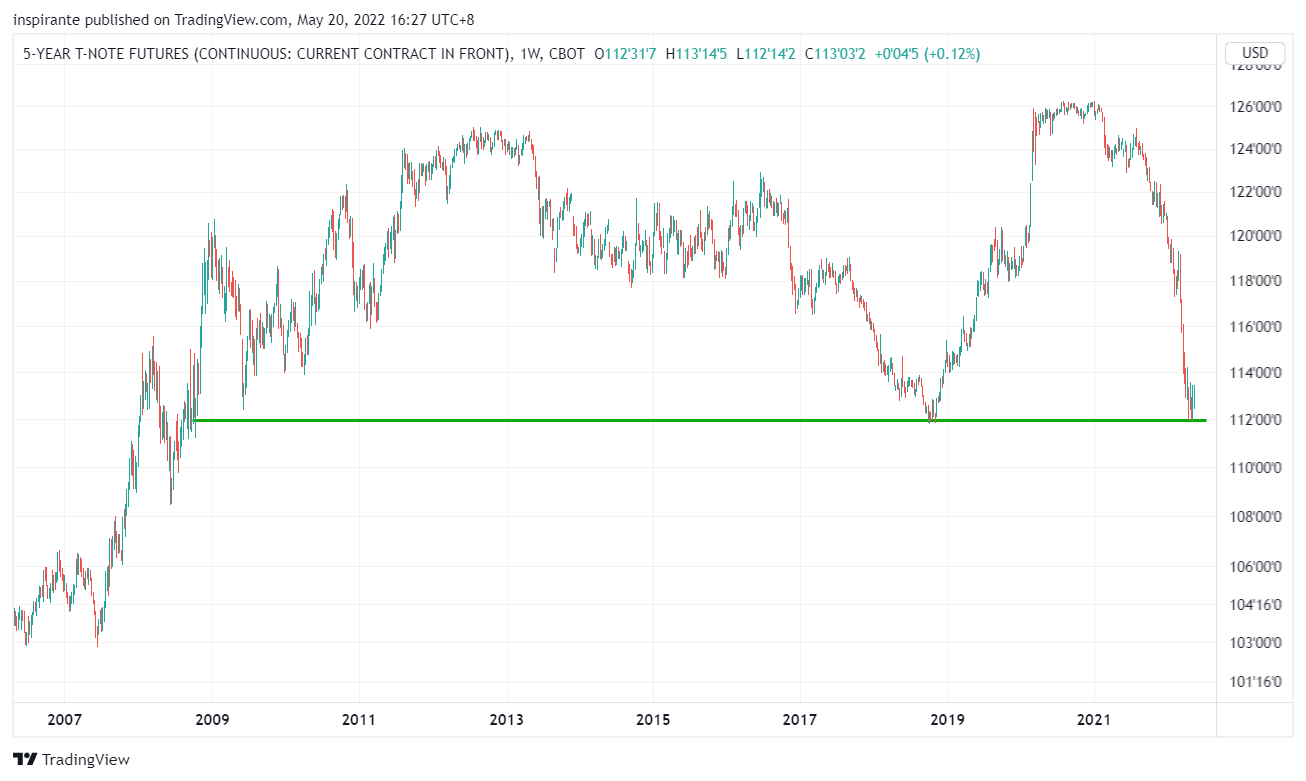
The US treasury market also suggests the rather extended selloff in bonds, and a relief rally is long overdue. As exemplified by the 5-year T-Note future, after having experienced one of the sharpest declines in history, it stopped and rebounded at 112, which is also the exact low of the 2018 cycle.
Market Views
The S&P 500 index is officially down over 20% since its all-time high on Jan 3, 2022, technically entering a bear market. For the first time since 2001, the S&P 500 index has logged seven consecutive lower weekly closes. In the latest Bank of America (BofA) Fund Manager Survey, cash levels among the clients hit the highest since 2001. Considering the long losing streak and “cash on the sidelines,” the BofA concluded that it was “extremely bearish” for the equity market due to risks such as hawkish central banks, global recession, and stagflation.
While we agree those risks put considerable pressure on the market, such extreme sentiments tend to mark at least the interim bottom. We want to find opportunities from the potential short-term rebounds of many assets. After all, nothing moves in a straight line in the financial market. Here we highlight a few in different asset classes.
The small-cap Russell 2000 Index’s post-pandemic rally halted in early 2021, and subsequently, it went sideways for more than a year without making new highs. After being down almost 30% from the high, the index is at a significant technical support level that a meaningful rebound will likely ensue.
The US Dollar Index has strengthened a whopping 11% since the beginning of the year. The dominating risk-off sentiment and interest rate differentials continue to favor the US Dollar. However, many currency pairs, such as AUD/USD, NZD/USD, EUR/USD, and GBP/USD, are at multi-year support levels. Historically, sharp reversals are likely to happen when the market is at such critical junctures and positioning is lopsided.
The treasury bond market experienced one of the most severe selloffs in history. In the face of some truly eye-watering inflation numbers, the bond market has already priced in the most hawkish path for the Fed, as shown by the T-Note futures completely falling off the cliff since the middle of last year. They are also at a critical support level now, precisely the previous cycle’s low in 2018.
Finally, with the strengthening of the US Dollar and rising real yield, Gold has struggled to hold its ground. If the US Dollar and US treasury bonds do reverse, both could be tailwinds for Gold to climb higher again.
How to play the theme out
A hypothetical investor can consider the following trades1:
Case Study 1: Long NZD/USD Future
If the investor were to long the NZD/USD future (6NU2) at 0.64 and set the stop below 0.61, his maximum loss per contract would be (0.64 – 0.61) x 100000 = 3000 USD. An initial target points to 0.68 and subsequently 0.74, resulting in (0.68 – 0.64) x 100000 = 4000 USD and (0.74 – 0.61) x 100000 = 10000 USD.
Case Study 2: Long 5-Year T-Note Future
If the investor were to long the 5-year T-Note future (ZFU2) at 112’290 and set the stop below 111’100, his maximum loss per contract would be (112’190 – 111’110) x 1000 = 1250 USD. An initial target points to 116 and subsequently 120, resulting in (116 – 112’290) x 1000 = 3093.75 USD and (120 – 112’290) x 1000 = 7093.75 USD.
Original Link: https://www.cmegroup.com/newsletters/fresh-from-the-trading-room/files/fresh-from-the-trading-room-2022-05-25.pdf
Examples cited above are for illustration only and shall not be construed as investment recommendations or advice. They serve as an integral part of a case study to demonstrate fundamental concepts in risk management under given market scenarios.
 | A guest post by
|