
Optimistic pessimism
Optimistic pessimism
Written on 2023-03-24, first published on 2023-03-29


Markets in focus
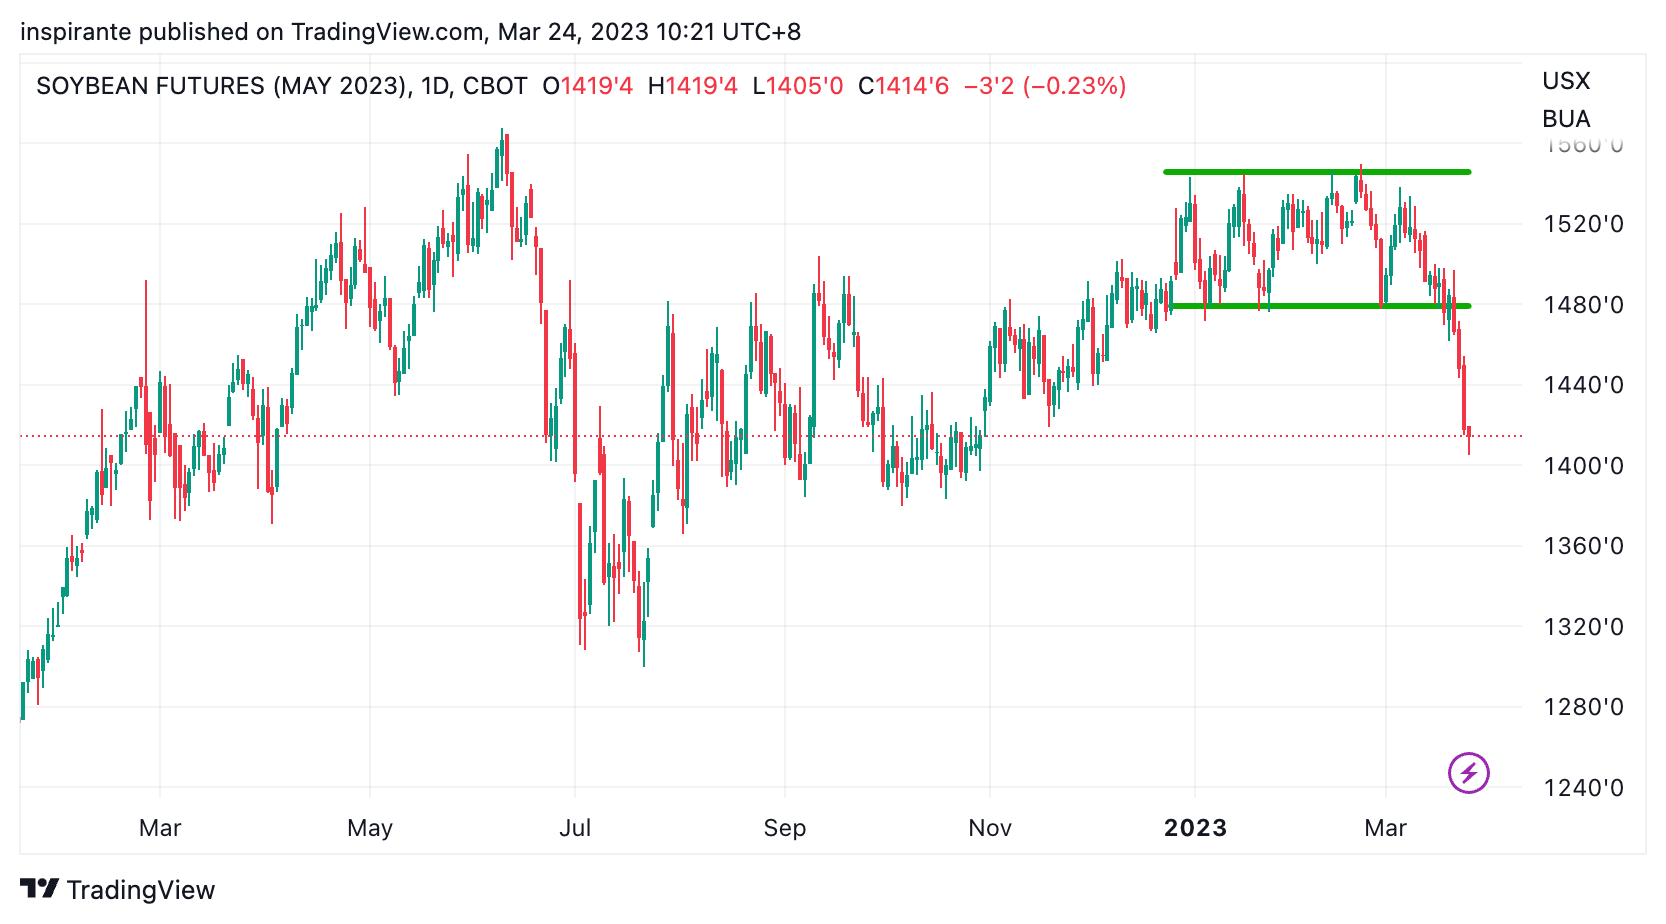
The soybean market took quite a hit recently when the three-month rectangle top was broken. Within a week, prices nosedived by over 6%. The 1400 level is a crucial support. We may see prices consolidate around this point for a bit.
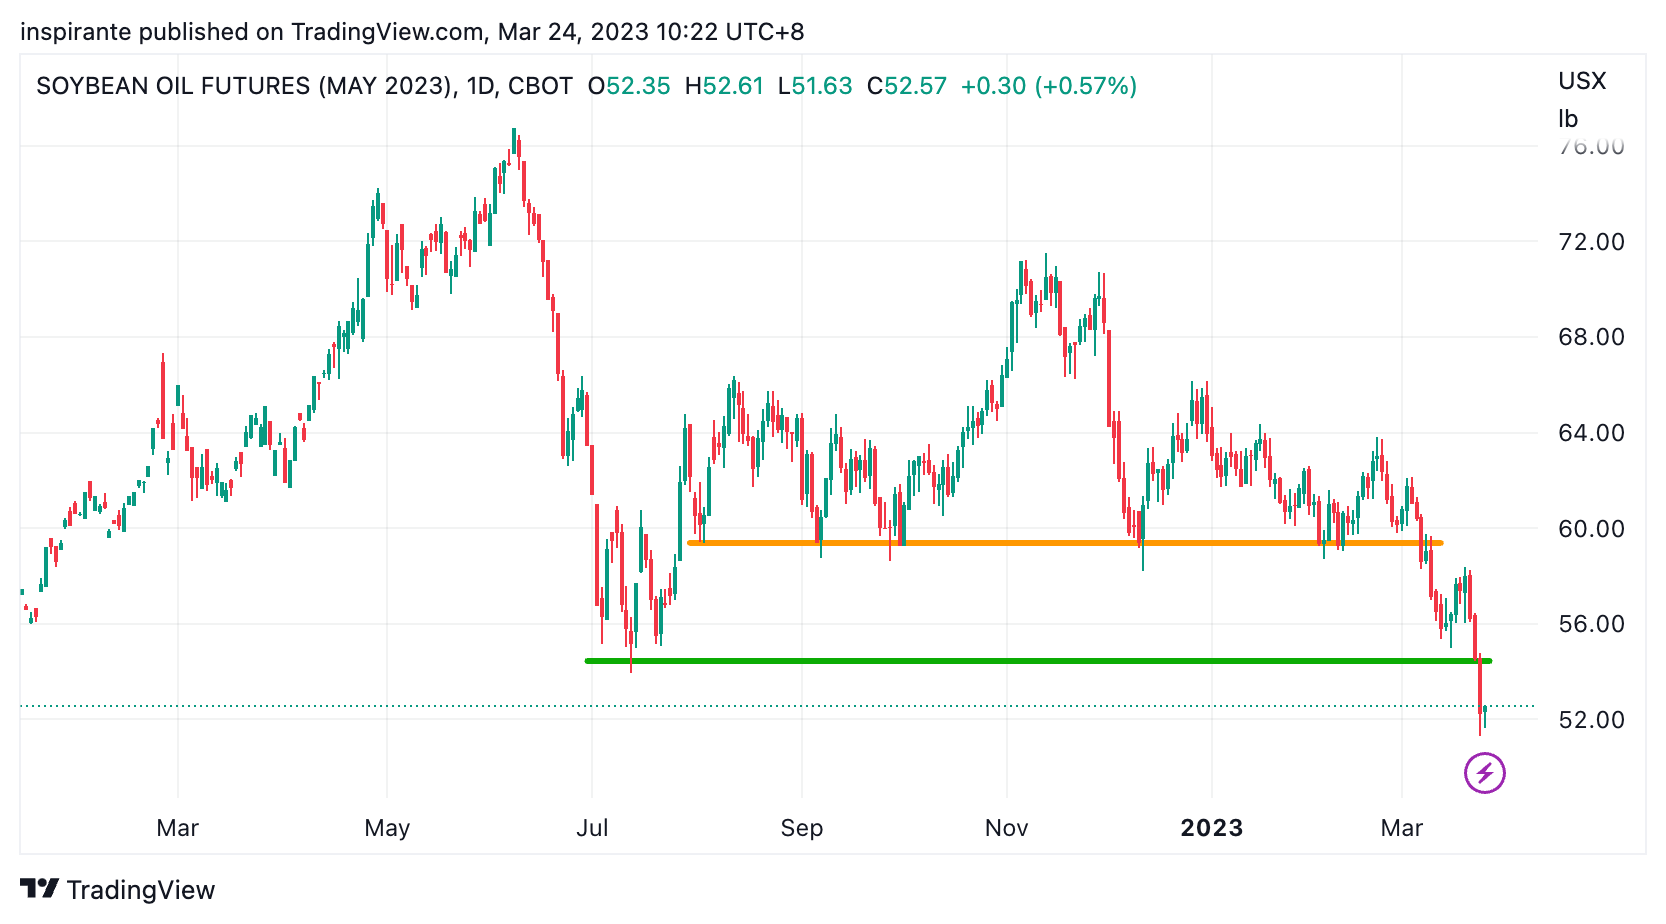
As we noted in our previous issue, soybean oil continued to drop lower after breaking the significant support at around 60. It went through last year’s low like a hot knife through butter.
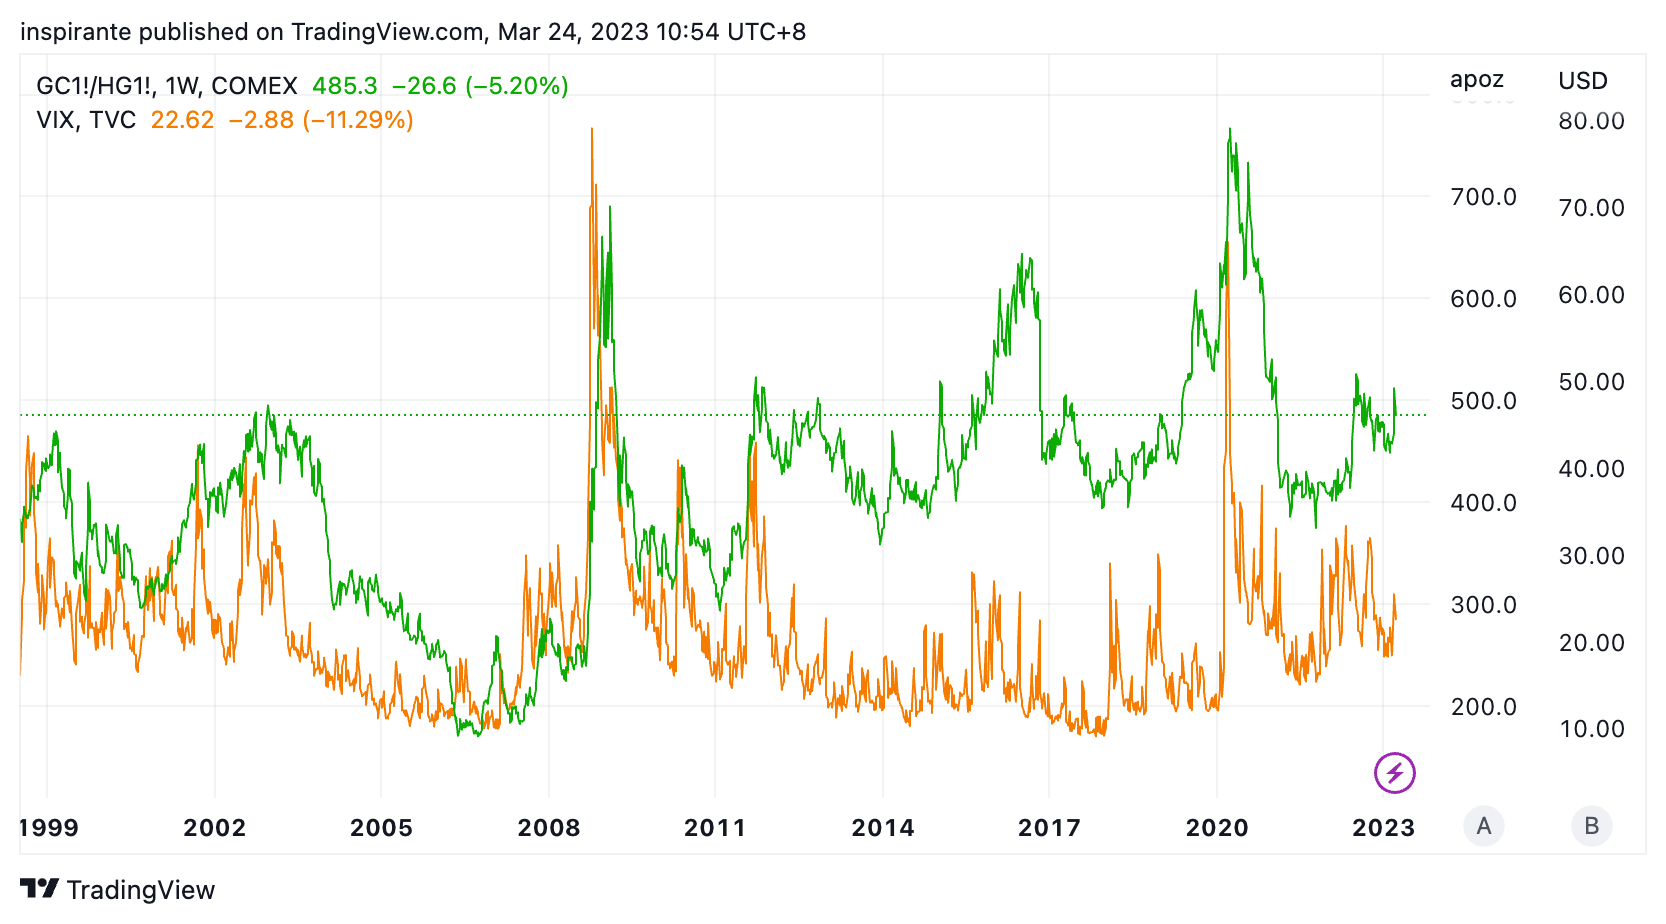
Historically, the gold-to-copper ratio has shown a strong correlation with general market stress and uncertainty, as illustrated by the VIX (S&P 500 Volatility Index). Given the recent events, we may be heading into a period of heightened volatility. As a result, investors could lean towards safe-haven precious metals over industrial base metals in the coming days.
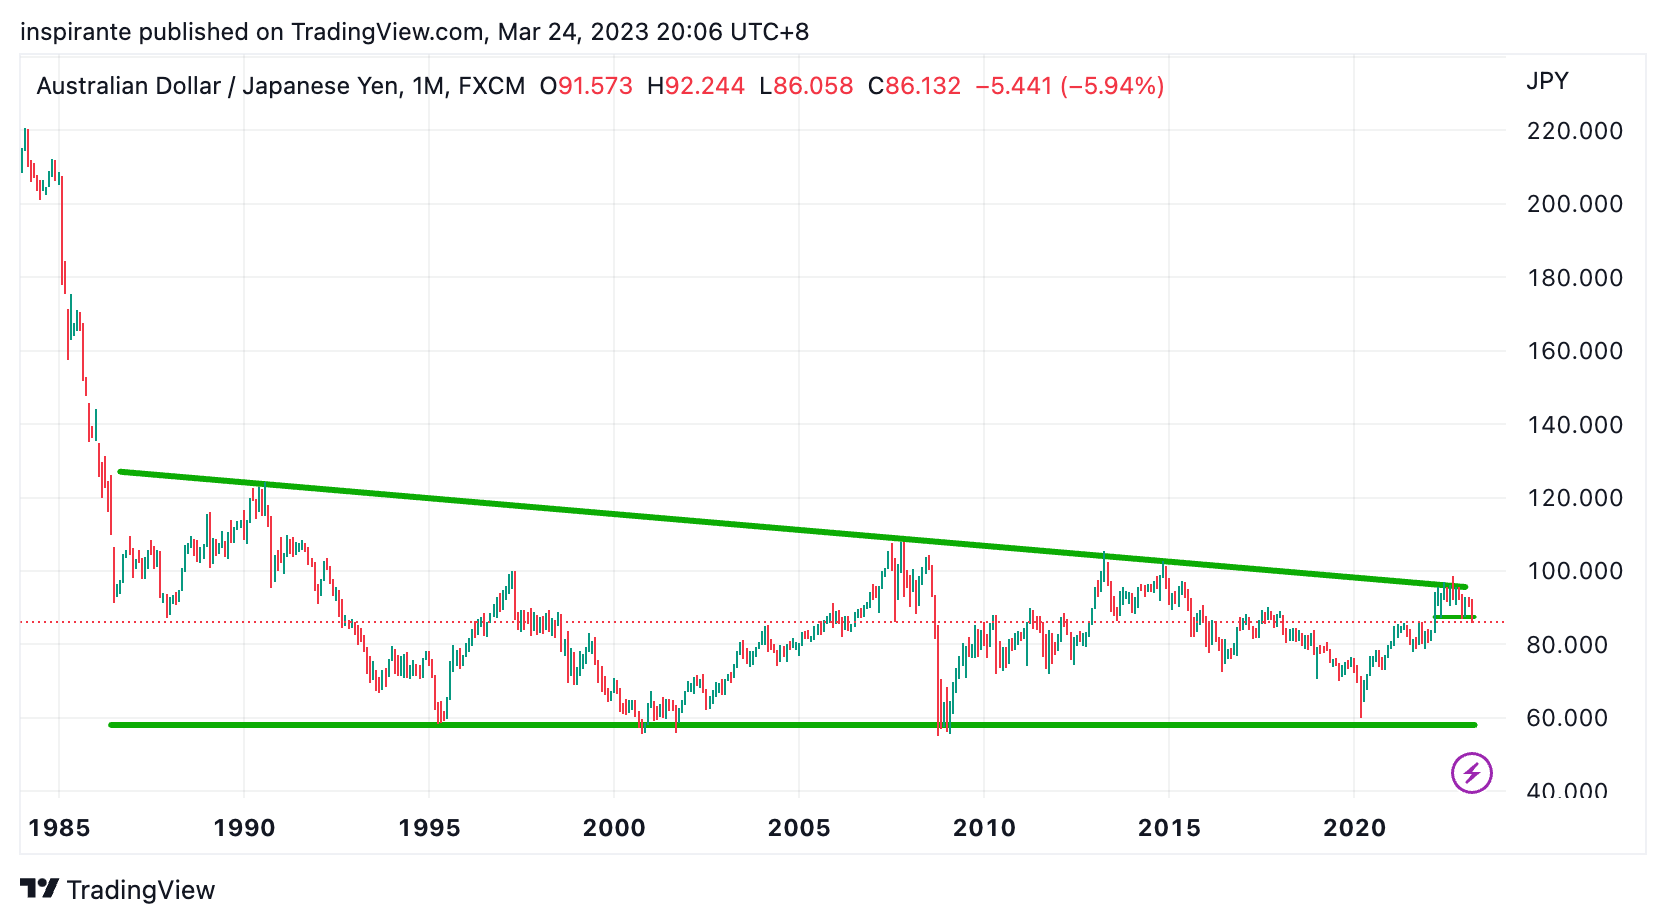
As we noted in early January, AUDJPY has long served as a global risk indicator, thanks to AUD’s status as a commodity-driven “risk-on” currency and JPY’s role as a safe-haven “risk-off” currency. This currency pair has been trading within a descending triangle for almost four decades. Over the past few months, AUDJPY has consolidated near the upper resistance level, but it has not managed to break through.
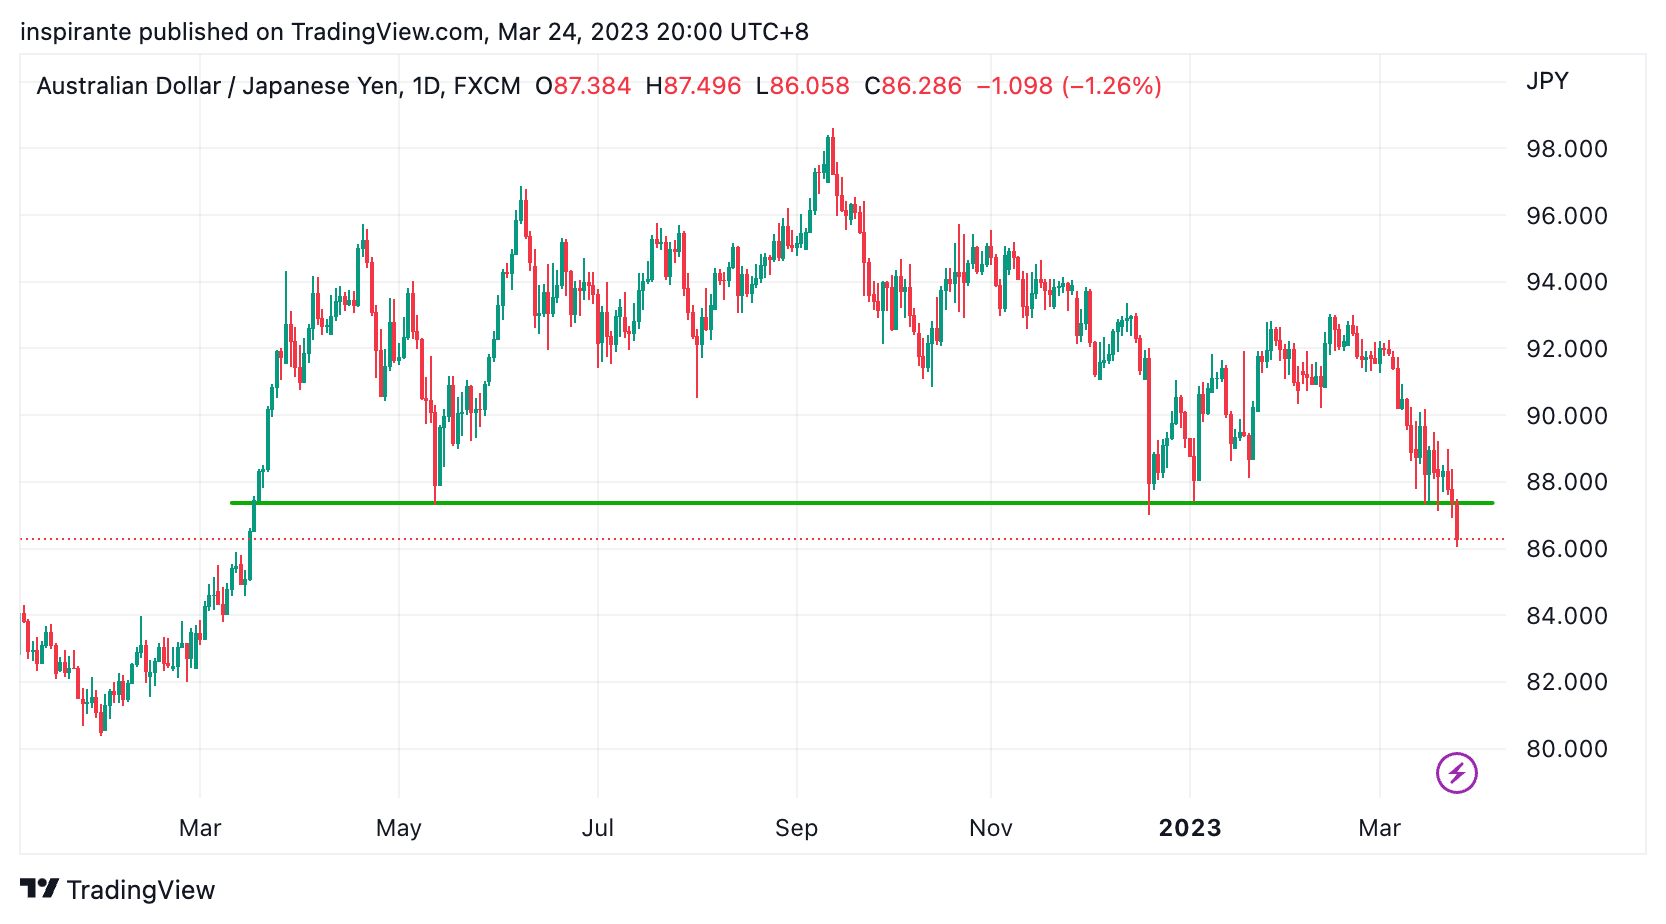
On the daily timeframe, AUDJPY has evidently broken down from a twelve-month rounding top. The support level, which was around 87, was breached on Friday. Considering inflation in Japan has just hit a 40-year high, the pressure on BoJ to act would undoubtedly be more than other central banks, leading to a potential strengthening of the Yen.
Our market views
The past two weeks have been remarkably eventful. The rapid collapse of Silicon Valley Bank (SVB), the second-largest bank failure in US history, sparked a chain reaction. Several other regional banks soon faced trouble, with three mid-sized US banks collapsing to date. In Europe, Credit Suisse was acquired by UBS, while Deutsche Bank’s stock price fell 8.5% on Friday as investors worried about potential issues. Events are unfolding rapidly.
What’s the market reaction? We’d describe it as “overly optimistic pessimism.” This may sound like an oxymoron, but let us strive to explain this bag of mixed reactions. Many market historians believe the Fed usually hikes interest rates until something breaks, as evidenced in the early 80s and 2006-2007. The Fed has raised interest rates from 0 to 4.5% within a year in the current cycle. The market seems to think that the regional banks, led by SVB, are the “something” that broke this time. Memories of the 2008 Great Financial Crisis are still fresh, along with growing concerns about the banking sector, systemic risk, and fear of contagion. Many worry that SVB is not an isolated event but the tip of an iceberg. The Cockroach Theory suggests that when you see one problem, many more are usually hidden. That’s the pessimistic side.
On the other hand, the market seems to see the end of the current tightening cycle - the 25bps hike in the March FOMC meeting was probably one of the last hikes. In addition, the interest rate market is pricing in an almost 100bps rate CUT this year, and some influential voices on Twitter are calling for a return to quantitative easing (QE). The recent SVB crisis seems to have only accelerated the “Fed Pivot” that some investors have been expecting for months. The equity market appears to be shrugging off the impact, with technology stocks leading the rally. It’s as if the inflation story is old news, and we’ll soon return to a zero-rate and QE environment. This is what we mean by “overly optimistic.”
Neither extreme pessimism nor the optimism that stems from it seems convincing, mainly because the Fed has made it clear they do not want to repeat the mistakes of the 1970s. Premature easing could lead to inflation returning more fiercely, persistently, and more challenging to tackle. We see a high probability of heightened volatility on the horizon. It’s time to position for the upcoming volatility.
How do we express our views?
We consider expressing our views via the following hypothetical trades1:
Case study 1: long gold/copper ratio
We would consider taking a long position on the gold/copper ratio by simultaneously buying one June 2023 gold future (GCM3) at the present level of 2000, and selling two May 2023 copper futures (HGK3) at the present level of 4.073, at a price ratio of 491. The 1:2 quantity ratio approximately equates the notional dollar amount for both sides of the trade. We would have a stop-loss below 430, which could bring us a hypothetical maximum loss of 61 points. Looking at Figure 3, if market stress and volatility do increase, the price ratio has the potential to rally to 600, a hypothetical gain of 109 points. Each point move in the gold future contract is USD 100, and each point move in the copper future contract is USD 25000.
Case study 2: short AUD/JPY future
We would consider taking a short position on the AUD/JPY future (AJYM3) at the present level of 86.1, with a stop-loss above 94, which could bring us a hypothetical maximum loss of 7.9 points. Looking at Figure 5, if the rounding top breakout is confirmed and the decline continues, AUD/JPY has the potential to reach 70, a hypothetical gain of 16.1 points. Each point move in the AUD/JPY future contract is JPY 200000.
Original Link: https://www.cmegroup.com/newsletters/fresh-from-the-trading-room/2023-03-29.html
Examples cited above are for illustration only and shall not be construed as investment recommendations or advice. They serve as an integral part of a case study to demonstrate fundamental concepts in risk management under given market scenarios. Please refer to full disclaimers at the end of the commentary.
 | A guest post by
|