

Peak inflation… or peak optimism?
First published on 2022-08-17


Markets in Focus

Over the two past decades since 2002, tech stocks have massively outperformed traditional large-cap value stocks, as shown by the ratio of Nasdaq vs. Dow Jones Industrial Average reaching the high of the dot-com bubble before correcting sharply this year. This ratio has rebounded recently as the equity market pared some losses. However, in such an environment marked by high inflation and monetary tightening, tech stocks will likely underperform substantially further.
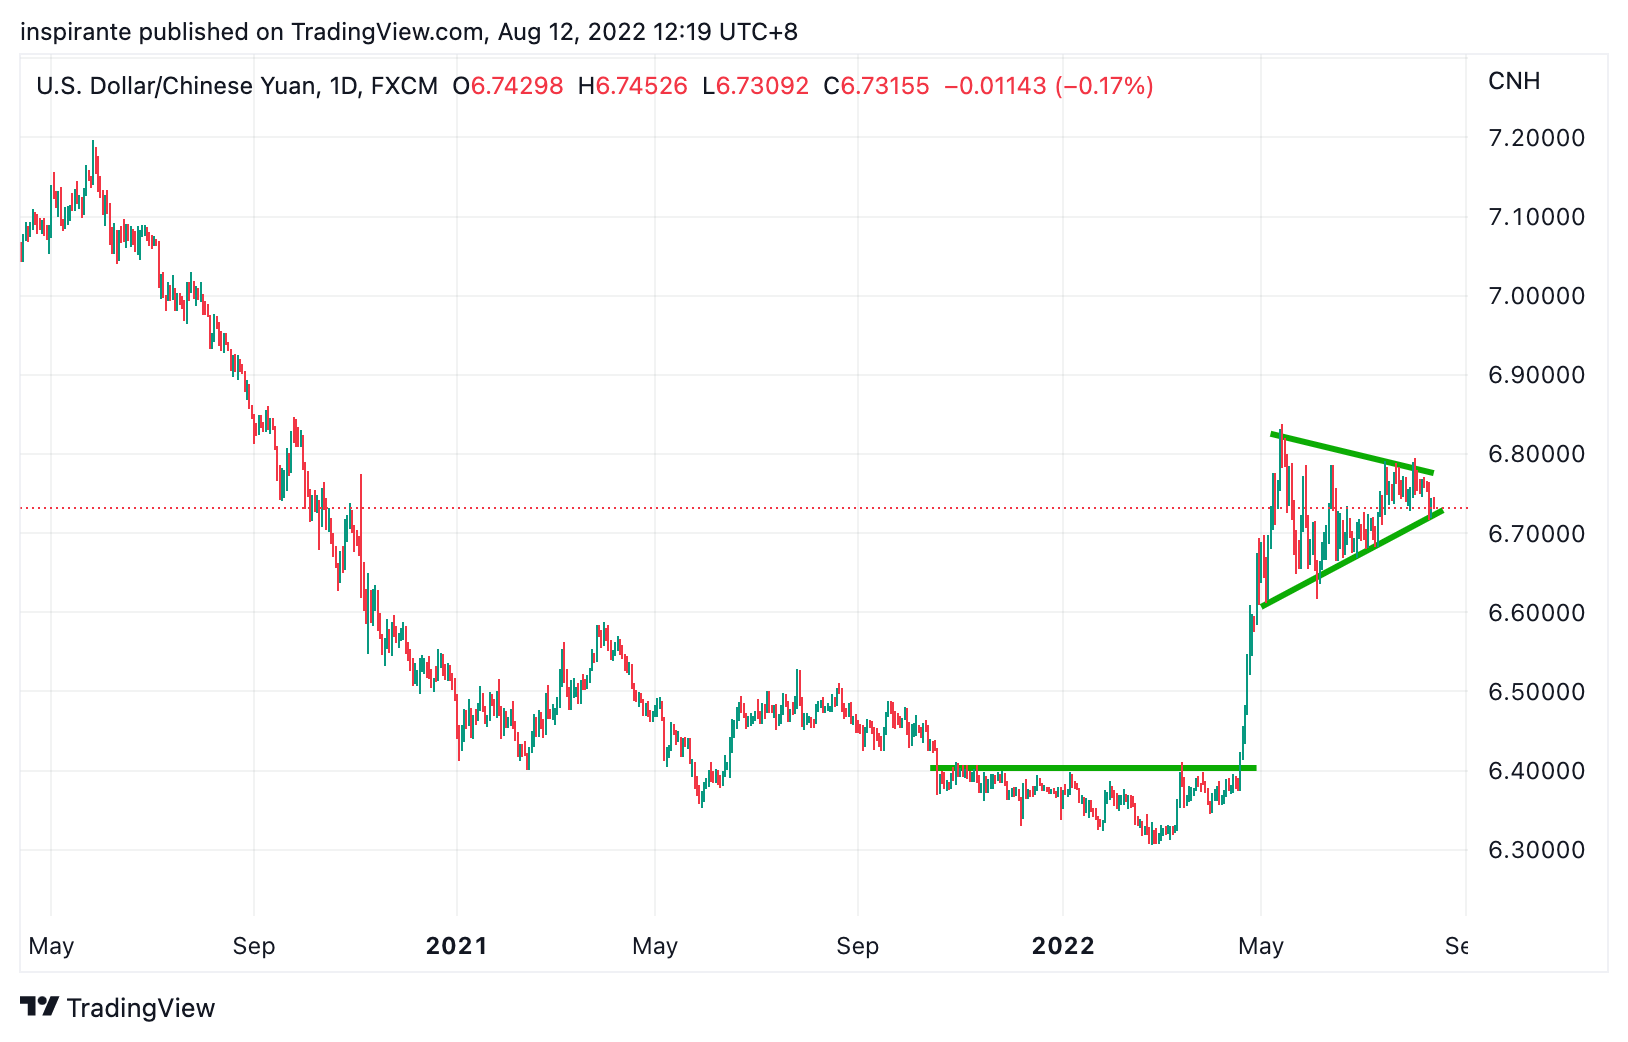
USD/CNY has been consolidating in a symmetrical triangle for over three months. As the price moves towards the triangle apex, the next leg higher (i.e., stronger USD against the CNY) is the more probable outcome as the policy divergence widens further between the US and China.
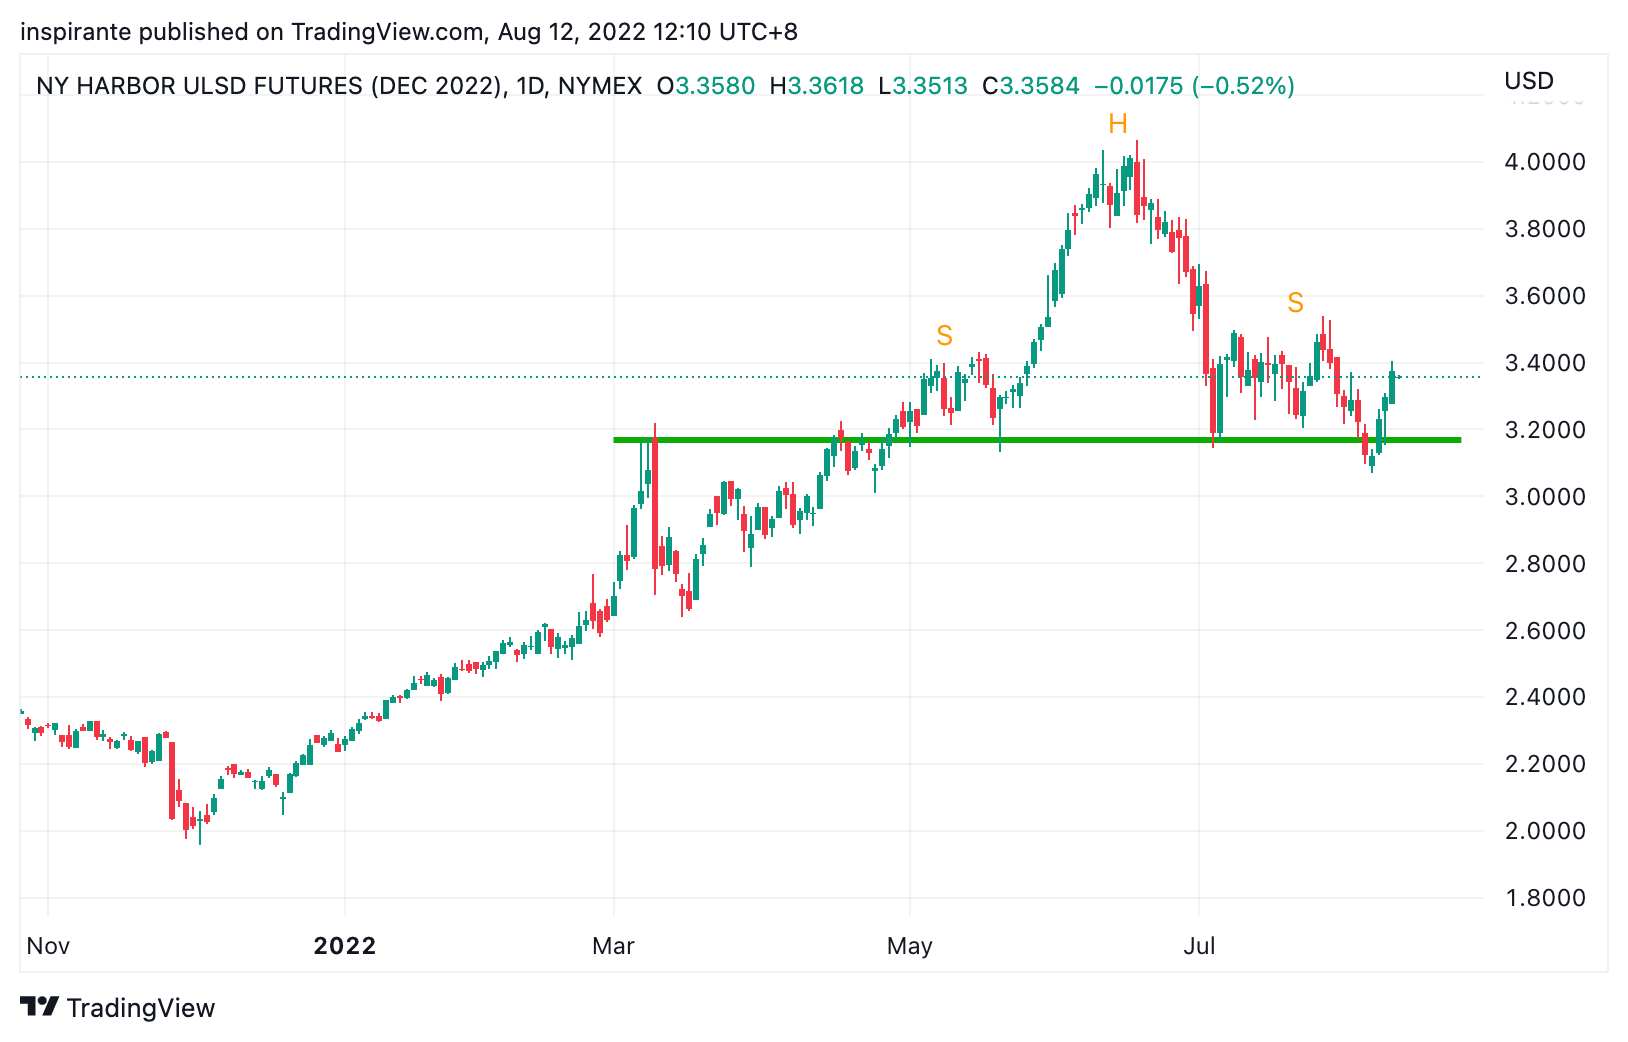
Heating oil’s current bull run was threatened when the Head-and-Shoulder’s neckline was breached temporarily. It turned out to be a false breakout as the price rebounded sharply. If heating oil prices break above the right shoulder high, it will result in a proper Head-and-Shoulder failure, likely starting the next leg higher.
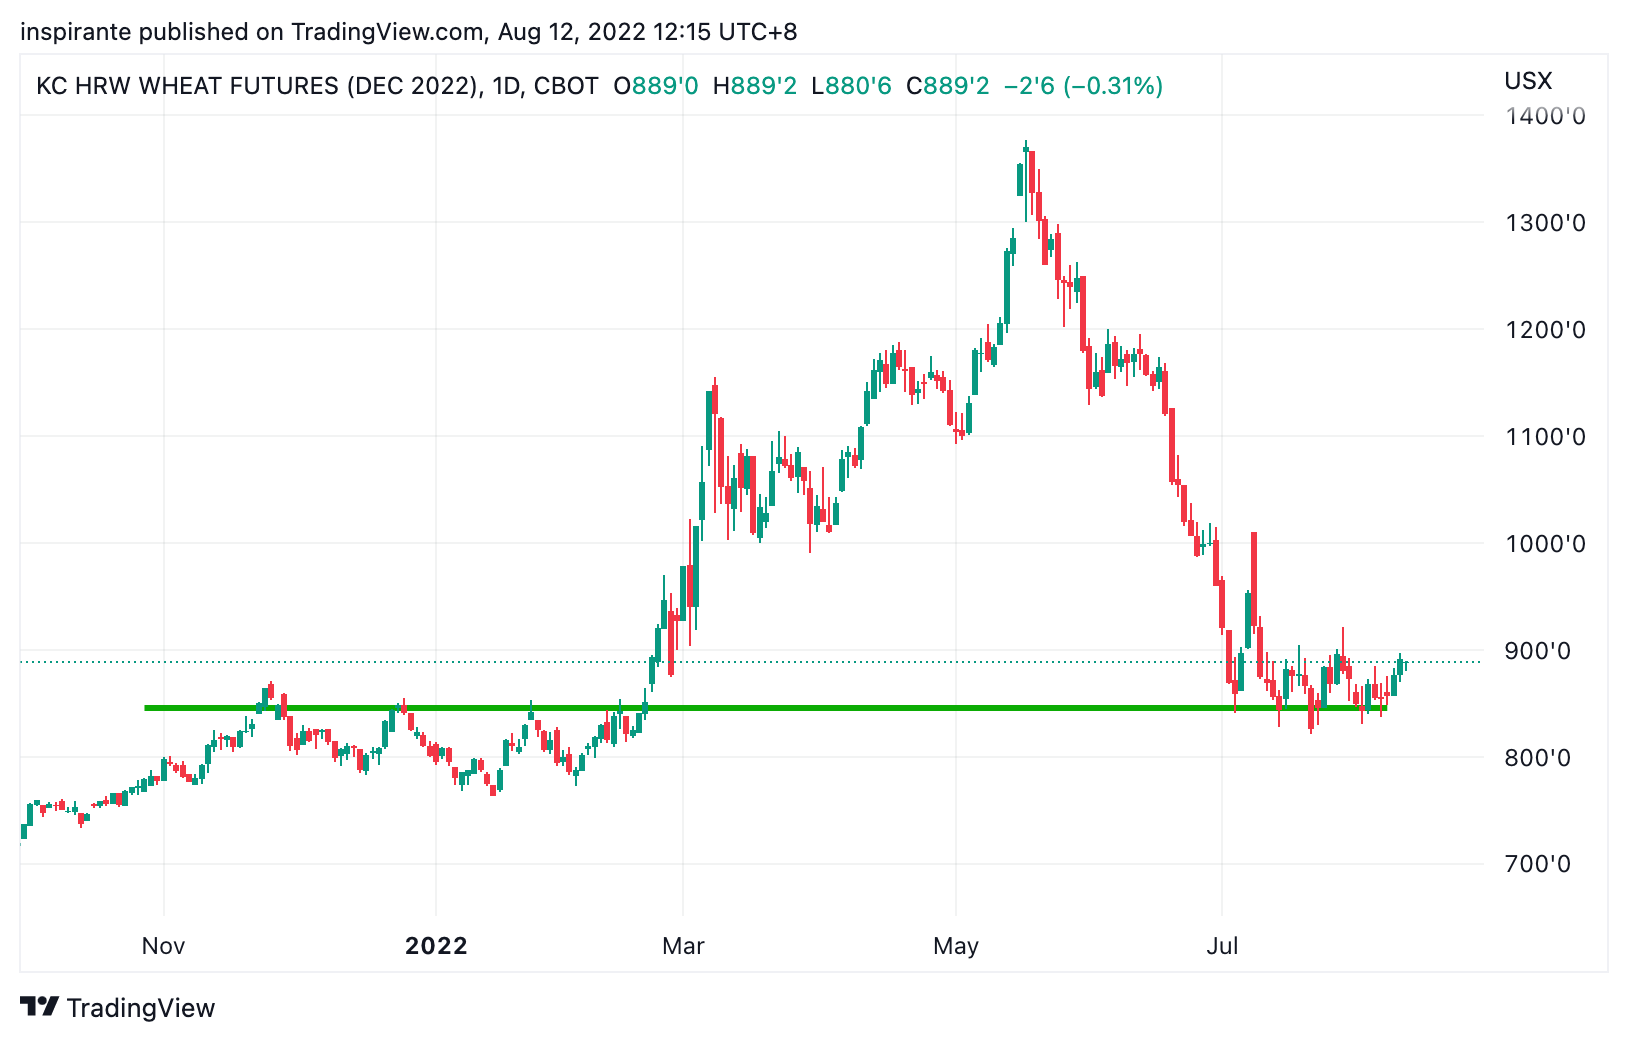
The Kansas City Hard Red Wheat respected the 840 region as a significant support. Its short-term consolidation seems to have been completed by the five-week rounding bottom. Once the price decisively breaks 900, the next immediate resistance is at 1000.

The Short-Term Interest Rate (STIR) market is pricing in two full 25bps rate cuts in 2023, as suggested by the Eurodollar December 2022 and December 2023 spread. If the “Fed Pivot” does not materialize, we could see this spread exploding much higher.
Market Views
August’s headline Consumer Price Index (CPI) number came in cooler than expected, finally pulling back from the high in July. It is, however, not the time to celebrate, as it is still a whopping 8.5%! The second derivative, i.e., the deceleration, matters much less when the absolute level is this high. The economy is still in a rough spot as central banks have vowed to tackle rampant inflation, even in the face of a potential recession. To put in some historical context, the last time we saw CPI at this level was in 1982, and the Fed Funds rate was above 12%. Today the Fed Funds rate is at a measly 2.5%, and the market is already pricing in rate cuts in a few months. It is not hard to see why we are bewildered and deeply concerned.
“That’s quite a bit more than what’s priced into the markets today,” former New York Fed president William Dudley said in an interview recently. “My view is that similarly-sized increases should be on the table until we see inflation declining in a consistent, meaningful, and lasting way,” said Fed Governor Michelle Bowman last Saturday. When Fed officials speak these things, we should pay attention.
The market, especially equities and the front end of the yield curve, seems to have gotten way ahead of itself, discrediting how adamant the Fed is. The Nasdaq index has rallied more than 22% since the low registered mid-June. The rally in tech stocks might reflect a certain market consensus that inflation and bond yield have peaked, and soon the Fed will restart easing policies; hence, growth will again outperform value. The Eurodollar market says the terminal rate will be around 3.5-3.75% by year-end and that the Fed will cut interest rates shortly after.
We, however, feel it is time to take the other side of the market consensus in both equities and interest rate markets. We believe inflation is here to stay; it will probably remain high for much longer than expected. What else is running very high, other than inflation, is investors’ optimism about the “Fed Pivot” and the questionable belief that “Bad news is good again.” Meanwhile, we would like to reiterate that soft commodities are likely to do well as the global food shortage will not be solved overnight by rate hikes.
How to play the theme out
A hypothetical investor can consider the following trades1:
Case Study 1: Long KC HRW Wheat
If the investor were to long the KC HRW Wheat future (KEZ2) at 890 and set the stop below 810, his maximum loss per contract would be (890 – 810) x 50 = 4000 USD. An initial target points to 1000 and subsequently 1150, resulting in (1000 – 890) x 50 = 5500 USD and (1150 - 890) x 50 = 13000 USD.
Case Study 2: Long Eurodollar December 2022 – December 2023 Spread
If the investor were to long the Eurodollar spread (GEZ2 – GEZ3) at -0.52, and set the stop below -0.8, his maximum loss per contract would be (-0.52 + 0.8) x 2500 = 700 USD. An initial target points to 0 and subsequently 0.25, resulting in (0 + 0.52) x 2500 = 1300 USD and (0.25 + 0.52) x 2500 = 1925 USD.
Original link: https://www.cmegroup.com/newsletters/fresh-from-the-trading-room/files/fresh-from-the-trading-room-2022-08-15.pdf
Examples cited above are for illustration only and shall not be construed as investment recommendations or advice. They serve as an integral part of a case study to demonstrate fundamental concepts in risk management under given market scenarios.
 | A guest post by
|