

The golden age
Written on 2025-01-22, first published on 2025-01-27


Market snapshots

The Nasdaq has broken out of a bull flag pattern, confirming the continuation of its uptrend as bullish sentiment strengthens.

Gold has broken out of a three-month symmetrical triangle, signalling a resumption of its rally.

Corn has rallied sharply to above 490 after breaking out of an ascending triangle bottom at the start of the year.
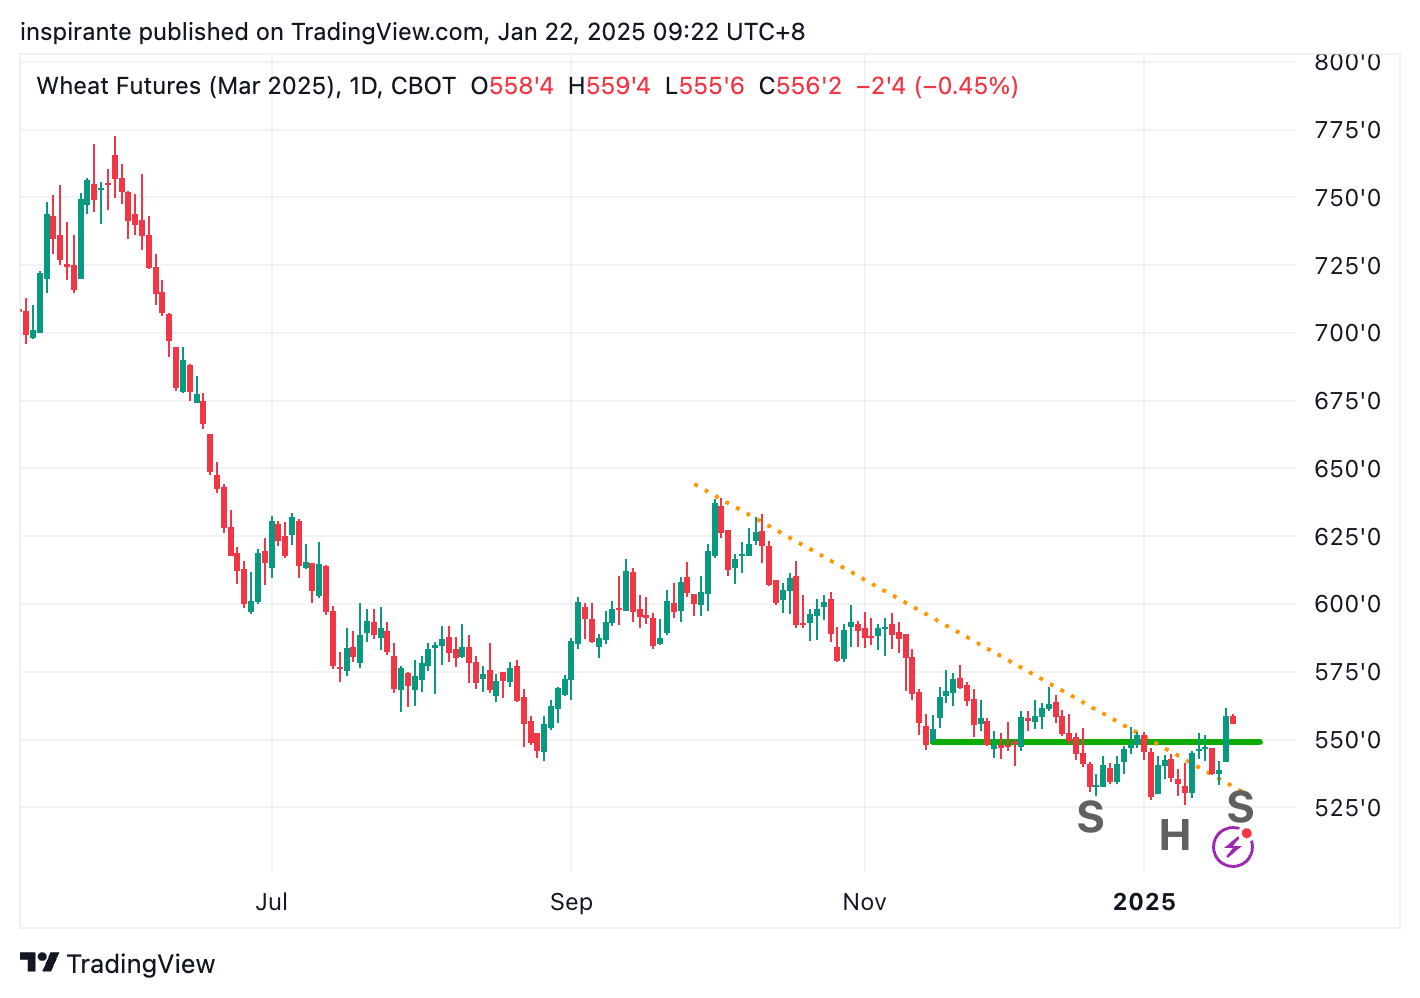
Wheat, previously lagging behind other agricultural commodities, has completed an inverse Head-and-Shoulders (H&S) bottom and appears positioned for a significant upward move.
Beyond the charts
“Our golden age has just begun,” declared the United States’ 47th President Donald Trump in his second inauguration address. This sentiment was echoed during a White House press conference on Tuesday by Masayoshi Son, CEO of Japanese tech giant SoftBank Group Corp., who also remarked that “this is the beginning of a golden age for America.” In partnership with Oracle and OpenAI, SoftBank announced significant investments in Artificial Intelligence within the U.S. The term “Golden Age,” originating from Greek mythology, traditionally symbolizes a period of peace, harmony, stability, and prosperity. However, juxtaposed with the President’s tariffs and protectionist policies, which have introduced heightened uncertainty in global financial markets, this optimism warrants a closer examination for us to identify opportunities ahead.
Today, we focus on the U.S. dollar, challenging the conventional wisdom that tariffs will necessarily bolster the greenback. Treasury Secretary Scott Bessent, during his tenure as a hedge fund manager (prior to his current appointment) diverged from market consensus, suggesting that a weaker dollar early in Trump’s second administration could enhance U.S. manufacturing competitiveness. He argued that “a weaker dollar and plentiful, cheap energy” could fuel significant economic growth. These remarks, made before his political role, carry notable weight and deserve careful consideration.
Historically, this view aligns with trends observed during Trump’s first term, when the U.S. dollar weakened by nearly 15% from peak to trough between 2017 and 2018. A softer dollar paired with robust economic expansion fosters what Keynes famously described as “animal spirits,” driving enthusiasm across markets. This dynamic has already been reflected in the resilience of technology stocks and a broad-based recovery in commodities. While we acknowledge the strength of the tech sector, we see greater potential for risk-adjusted returns in commodities, given the prevailing weaker-dollar, pro-growth macro environment.
In our previous commentary, we flagged potential bullish reversals in agricultural products driven by macroeconomic factors and weather conditions, and these markets have seen significant gains over the past two weeks. Right now, we continue to favour gold as a strategic play amid geopolitical uncertainties and a weakening dollar. Often considered a hedge in turbulent times, gold seems poised to reclaim its lustre in this “golden age.” Perhaps, then, this golden age is not only about innovation and economic optimism but also about the enduring value of commodities like gold—a time for them to shine anew.
From ideas to actions
We conclude with the following hypothetical trades1:
Case Study 1: Long Gold Futures
We would consider taking a long position in the gold futures (GCJ5) at the current price of 2,780, with a stop-loss below 2,700, a hypothetical maximum loss of 2,780 – 2,700 = 80 points. Looking at Figure 2, if the Continuation Triangle pattern is confirmed, gold has the potential to rise to 3,030, resulting in 3,030 – 2,780 = 250 points. Each gold futures contract represents 100 troy ounces of gold, and each point move is 100 USD. Micro gold futures contracts are also available at 1/10th of the standard size. In addition, there is a newly launched 1-Ounce gold futures contract which could be used to express the same bullish view but at 1/100th of the standard size.
Case Study 2: Long Wheat Futures
We would consider taking a long position in wheat futures (ZWH5) at the current price of 560, with a stop-loss below 530, a hypothetical maximum loss of 560 – 530 = 30 points. Looking at Figure 4, if the Head-and-Shoulder bottom reversal is confirmed, wheat prices have the potential to reach 620, resulting in 620 – 560 = 60 points. Each wheat futures contract represents 5,000 bushels, and each point move is 50 USD. Mini wheat futures contracts are also available at 1/5th of the standard size.
Original link here.
EXAMPLES CITED ABOVE ARE FOR ILLUSTRATION ONLY AND SHALL NOT BE CONSTRUED AS INVESTMENT RECOMMENDATIONS OR ADVICE. THEY SERVE AS AN INTEGRAL PART OF A CASE STUDY TO DEMONSTRATE FUNDAMENTAL CONCEPTS IN RISK MANAGEMENT UNDER GIVEN MARKET SCENARIOS. PLEASE REFER TO FULL DISCLAIMERS AT THE END OF THE COMMENTARY.
 | A guest post by
|