
The Great Rotation


Markets in Focus
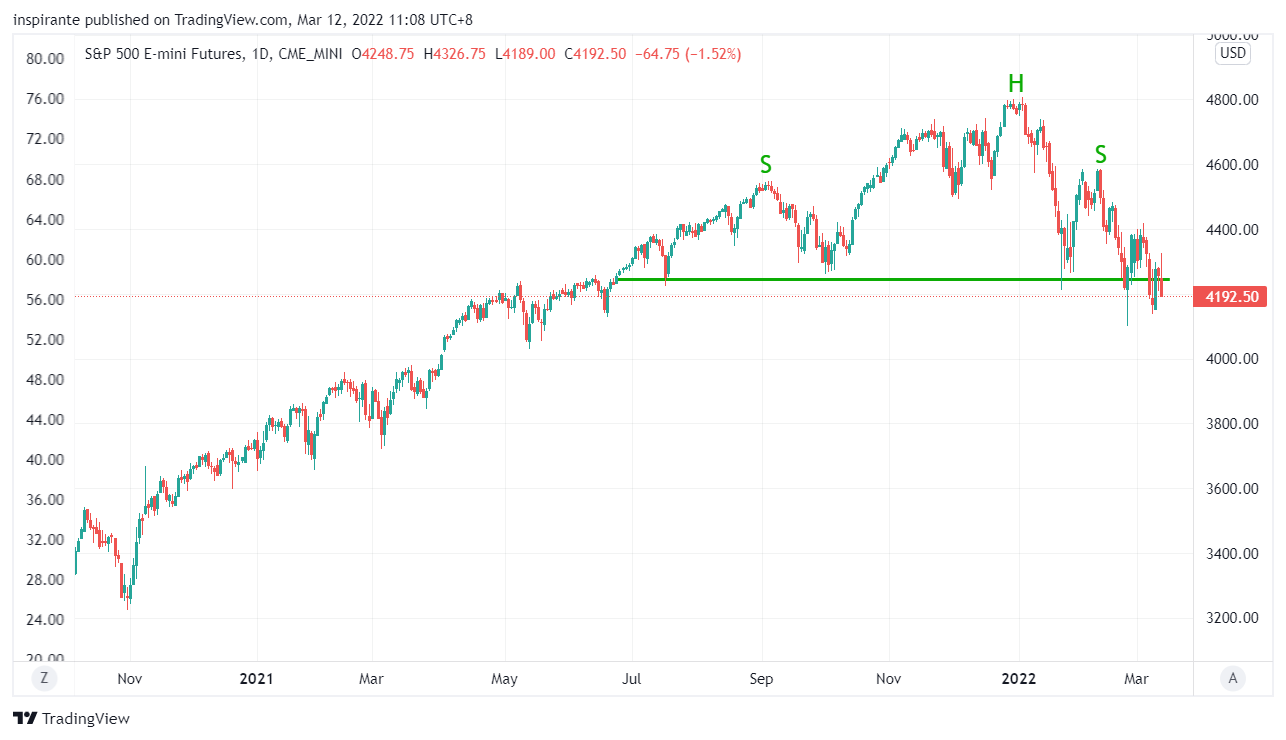
The S&P 500 index spent the last two weeks making consecutive lower highs and lower lows, confirming our observation in the Feb 15th issue that “Sell the Rally” is the new sheriff in town given the current macro and geopolitical situations. Gone are the days when buying every dip of the US equities was a high probability investment strategy.
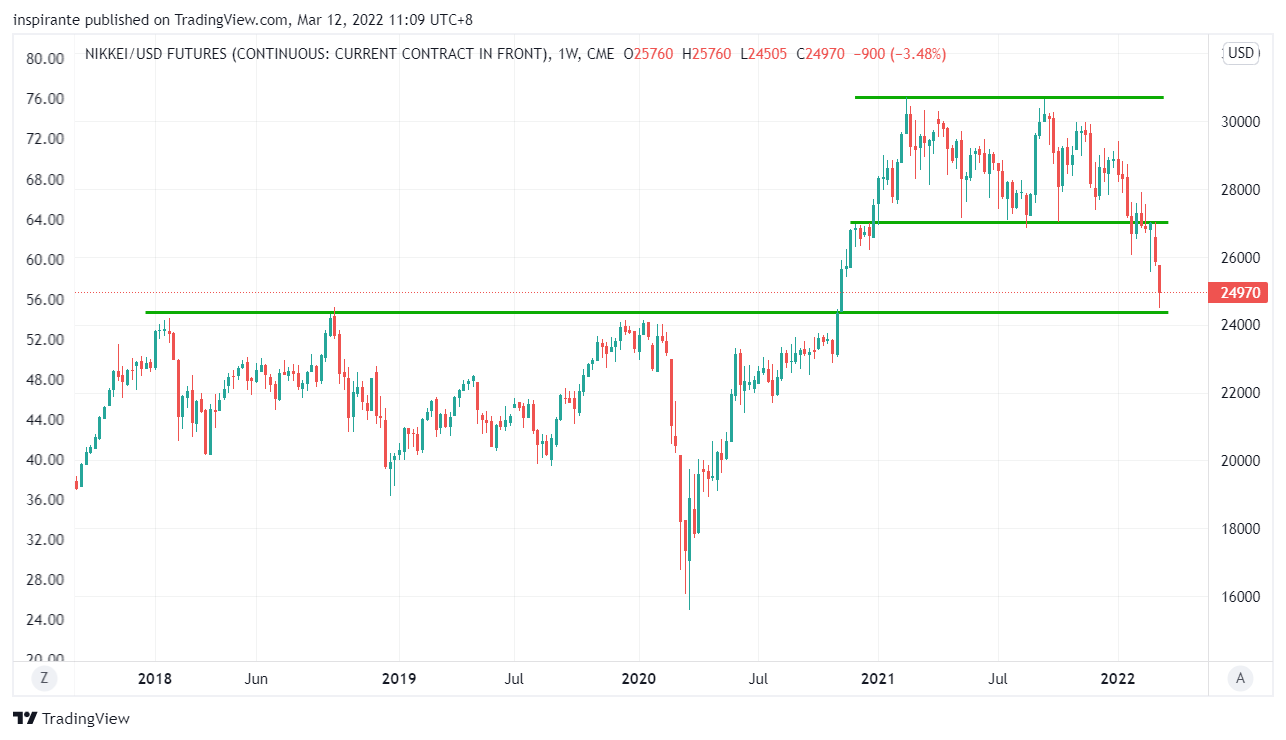
The Japanese Nikkei 225 Index also fell out of its 2021 trading range and is quickly approaching the 24000 level, which used to be a strong resistance that rejected the index’s advance multiple times since 2018. After successfully breaking out in late 2020, the index will now find this region a critical support.
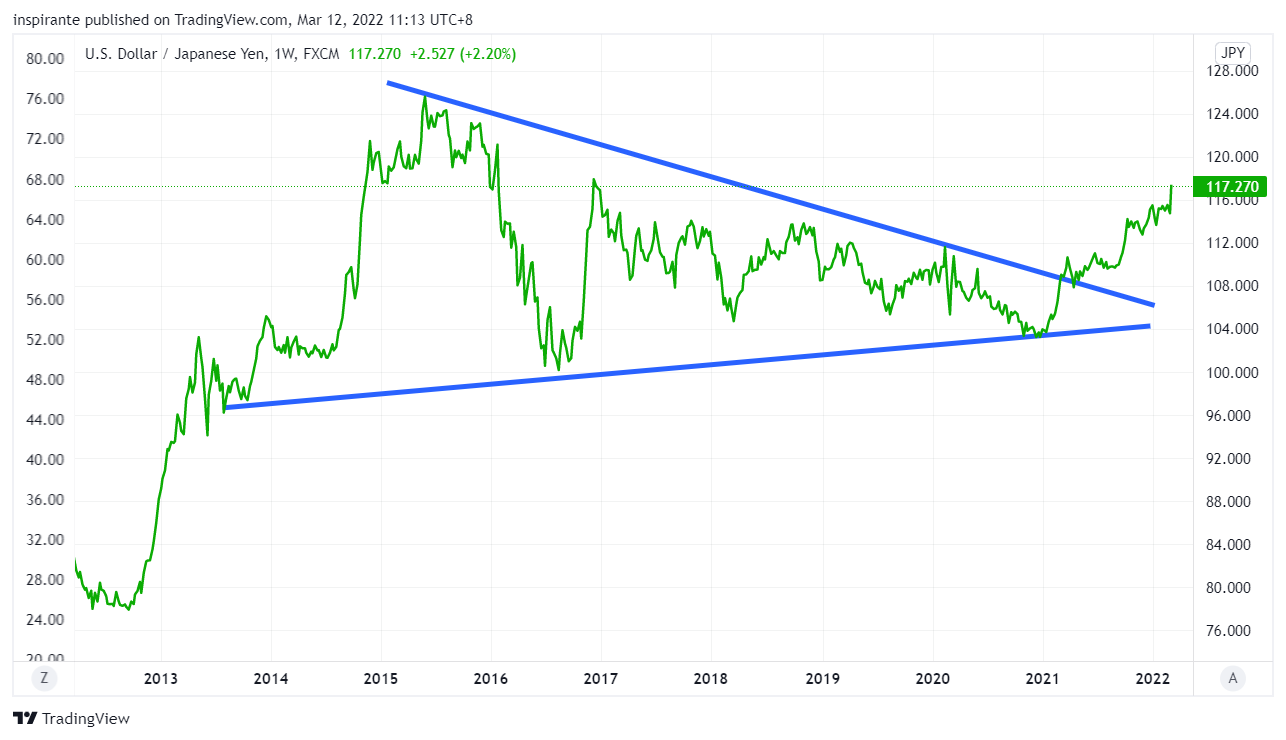
After breaking out from a massive long-term triangle, the Japanese Yen continued to weaken against the US Dollar, mainly due to the divergence in central banks’ policies. What is the path of the least resistance for this pair? Heading up. A weaker Yen is also a tailwind for the Japanese equities.
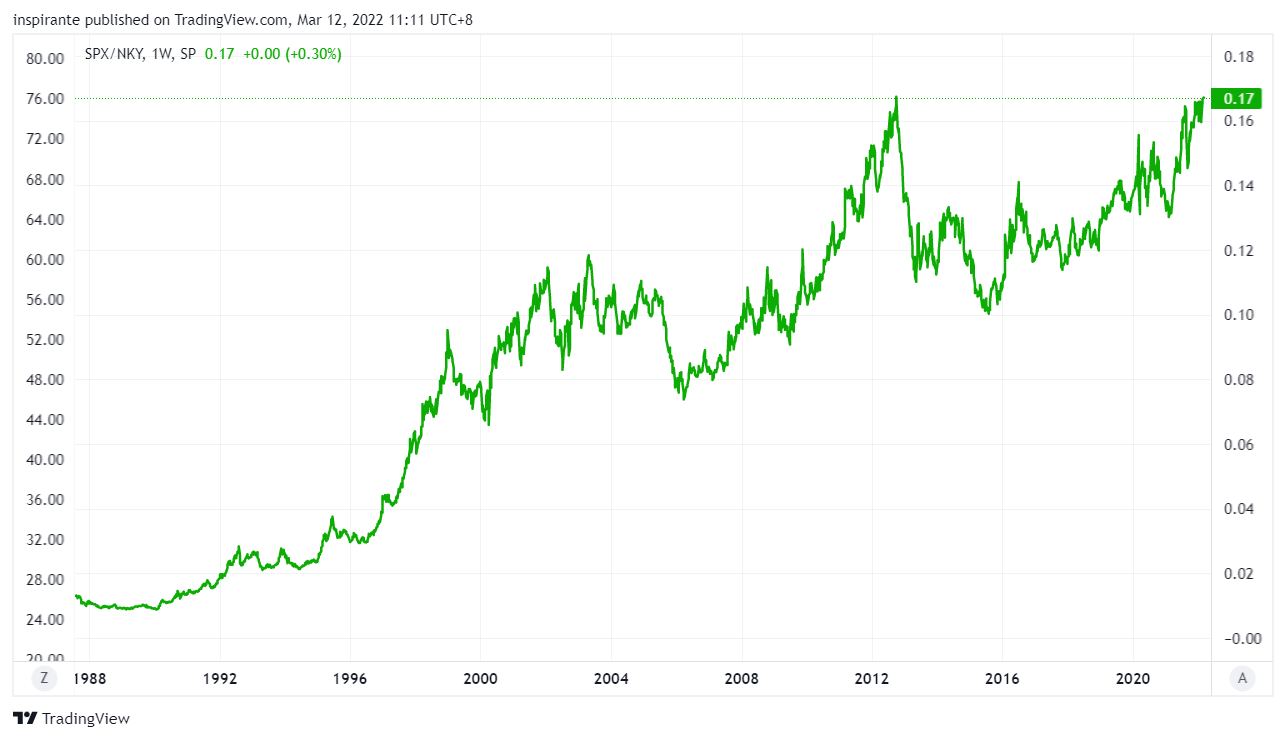
On a relative basis, the S&P 500 index has outperformed the Nikkei 225 index by the most in history, reaching the previous high in 2012. We couldn’t help but wonder if global investors will start rotating out from a decade-long US-heavy allocation into other under-allocated countries, including Japan.
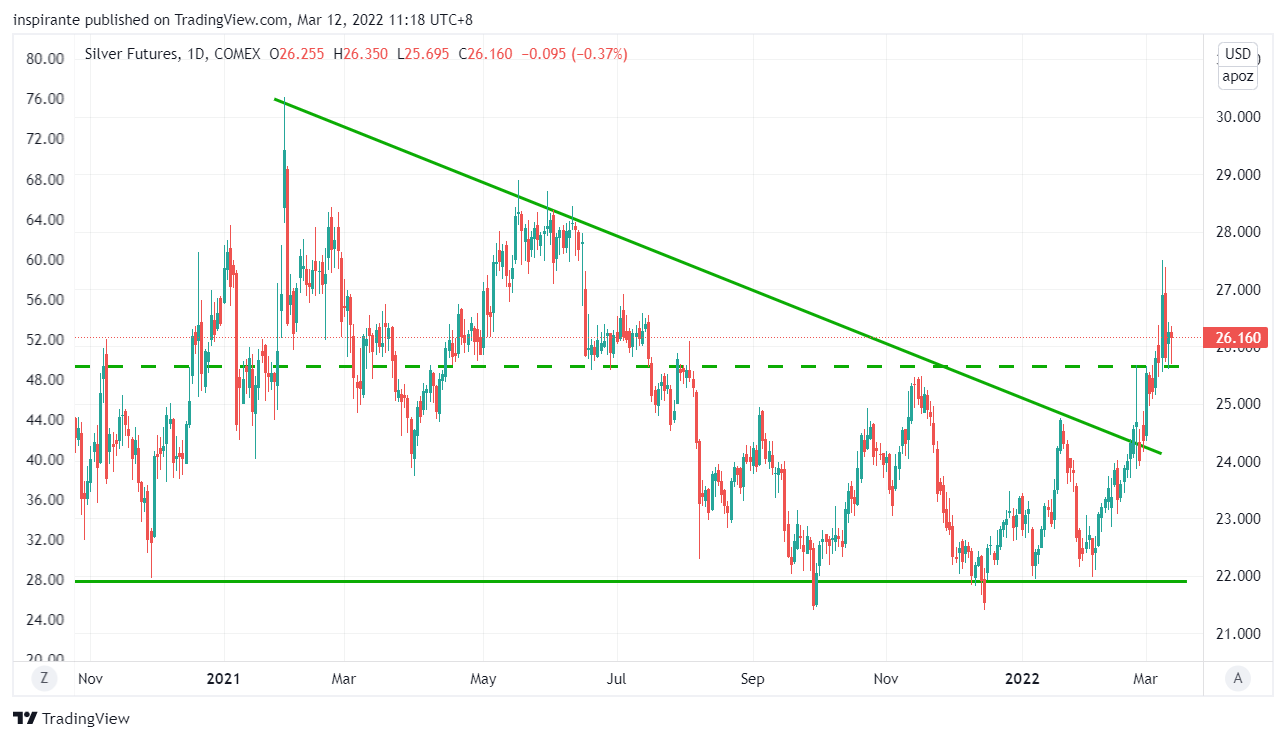
Silver broke out from the 15-month descending triangle in early March and reached as high as 27.5 last week. It has sharply retraced back, but the former resistance near 25.5 has become the new support. If Silver can find its footing around this level, chances are it will launch higher soon.
Market Views
In these perilous times, with so many cross-currents in the global financial market, we saw heightened volatility in all asset classes, notably in the commodity space. Looking beyond the headline events, we know that volatility is mean-reverting, and inevitably, it will subside once the uncertainty is removed. Subside to what level is another debate.
In our Feb 15th issue, we have already preluded a potentially seismic change in macro and market regimes. After all, inflation is something the developed world has not had for almost half a century, as suggested by the latest US CPI numbers reaching levels only seen in the 1970s. Therefore, it is reasonable to start questioning many of the financial market’s status quos, which might have been deeply ingrained in investors’ minds.
Over the past decade, the US enjoyed a continuous inflow of funds from global investors, most of which went into the mega-cap tech stocks. It created a virtuous cycle for the outperformance of US assets, leading more inflows into the US equity market and pushing the latter to record high valuation by any metrics imaginable.
However, the tide might be turning. We have witnessed an unwavering Fed getting very serious and worried about inflation and seemingly quite adamant about the rate hike and tightening moves, even when the Nasdaq has already fallen more than 20% from the recent high, technically entering into a bear market. The “Fed Put,” to many people’s surprise, could still be far away.
What do we have under the radar? Japan was one of the places underloved by international investors for the past decade. The BoJ, unlike the Fed, is most likely continuing its current easy monetary policies and ready to support the equity market whenever needed. The inflationary pressure is also considerably less in Japan than in the US or Eurozone. We can foresee a further divergence of the central banks’ policies which could mark the beginning of a long-term US underperformance. Meanwhile, another potential rotation is from technology into the “real-stuff” commodities, including Silver, as the world suddenly finds itself short of many such things like energy, food, and metals.
How to play the theme out
A hypothetical investor can consider the following trades1:
Case Study 1: Short S&P 500 vs. Nikkei 225 Ratio
The investor could construct a notionally neutral spread by selling 6 Micro E-mini S&P 500 futures (MESM2) at 4200 and buying 1 Nikkei 225 USD future (NKDM2) at 25000 at an implied ratio of 0.168. Both legs have a notional value of around 125000 USD. The target is for this ratio to drop back to 0.14 and potentially 0.11. Stop-loss would be when the ratio breaks above 0.175.
Case Study 2: Long Micro Silver Future
If the investor were to long the Micro Silver future (SILK2) at around 26.16 and set the stop below 24.4, his maximum loss per contract would be (26.16 – 24.4) x 1000 = 1760 USD. An initial target points to 28.5 and subsequently 30, resulting in (28.5 – 26.16) x 1000 = 2340 USD and (30 – 26.16) x 1000 = 3840 USD.
Original Link: https://www.cmegroup.com/newsletters/fresh-from-the-trading-room/files/fresh-from-the-trading-room-2022-03-16.pdf
Examples cited above are for illustration only and shall not be construed as investment recommendations or advice. They serve as an integral part of a case study to demonstrate fundamental concepts in risk management under given market scenarios.
 | A guest post by
|