
The reminiscence of the 2000s
The reminiscence of the 2000s
Written on 2023-07-14, first published on 2023-07-18


Markets in focus
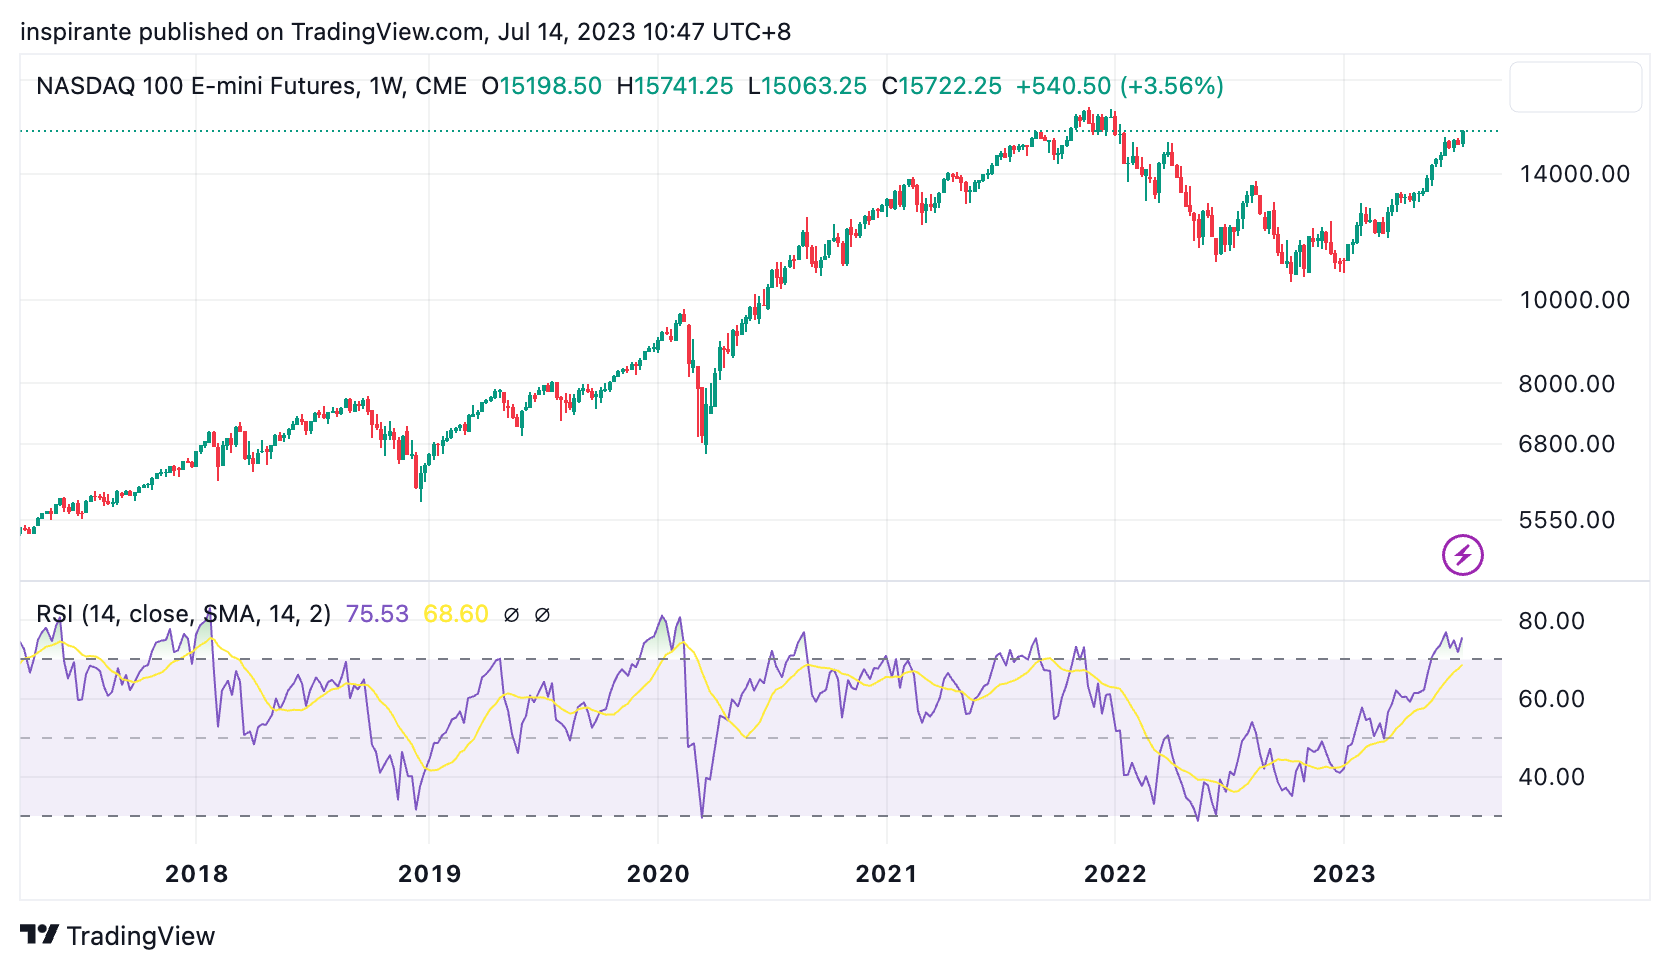
Looking from a longer timeframe, the Nasdaq is just a hair’s breadth away from its all-time high (ATH) registered in late 2021. The momentum behind the current rally, as indicated by the weekly Relative Strength Index (RSI), appears to be nearly on par with the initial rebound from the lows of the 2020 pandemic.

However, the stock market rally did not stem from broad participation, as we see the ratio between Nasdaq and Russell surpassing the 2020 high at 7.87 and reaching levels reminiscent of the Dotcom era, up to 7.98. Back in 2000, following a sharp divergence between tech-heavy Nasdaq and small-cap Russell, a stunning reversal took place.
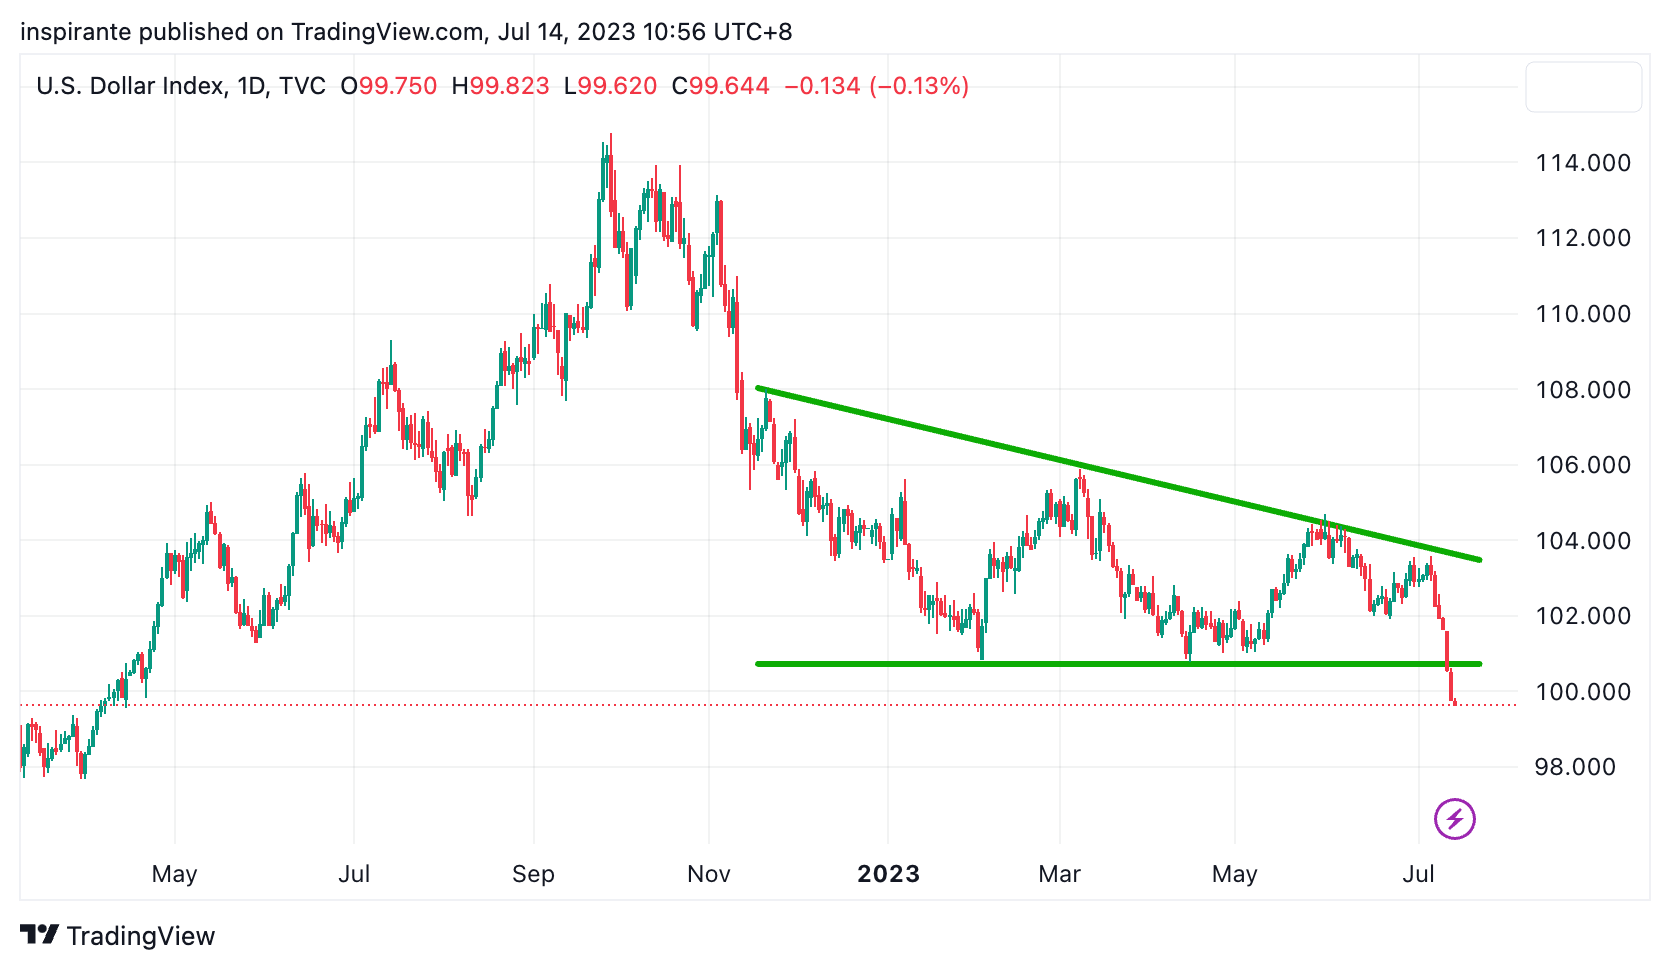
After coiling for eight months inside a descending triangle, the US dollar finally broke the support and 100 mark.
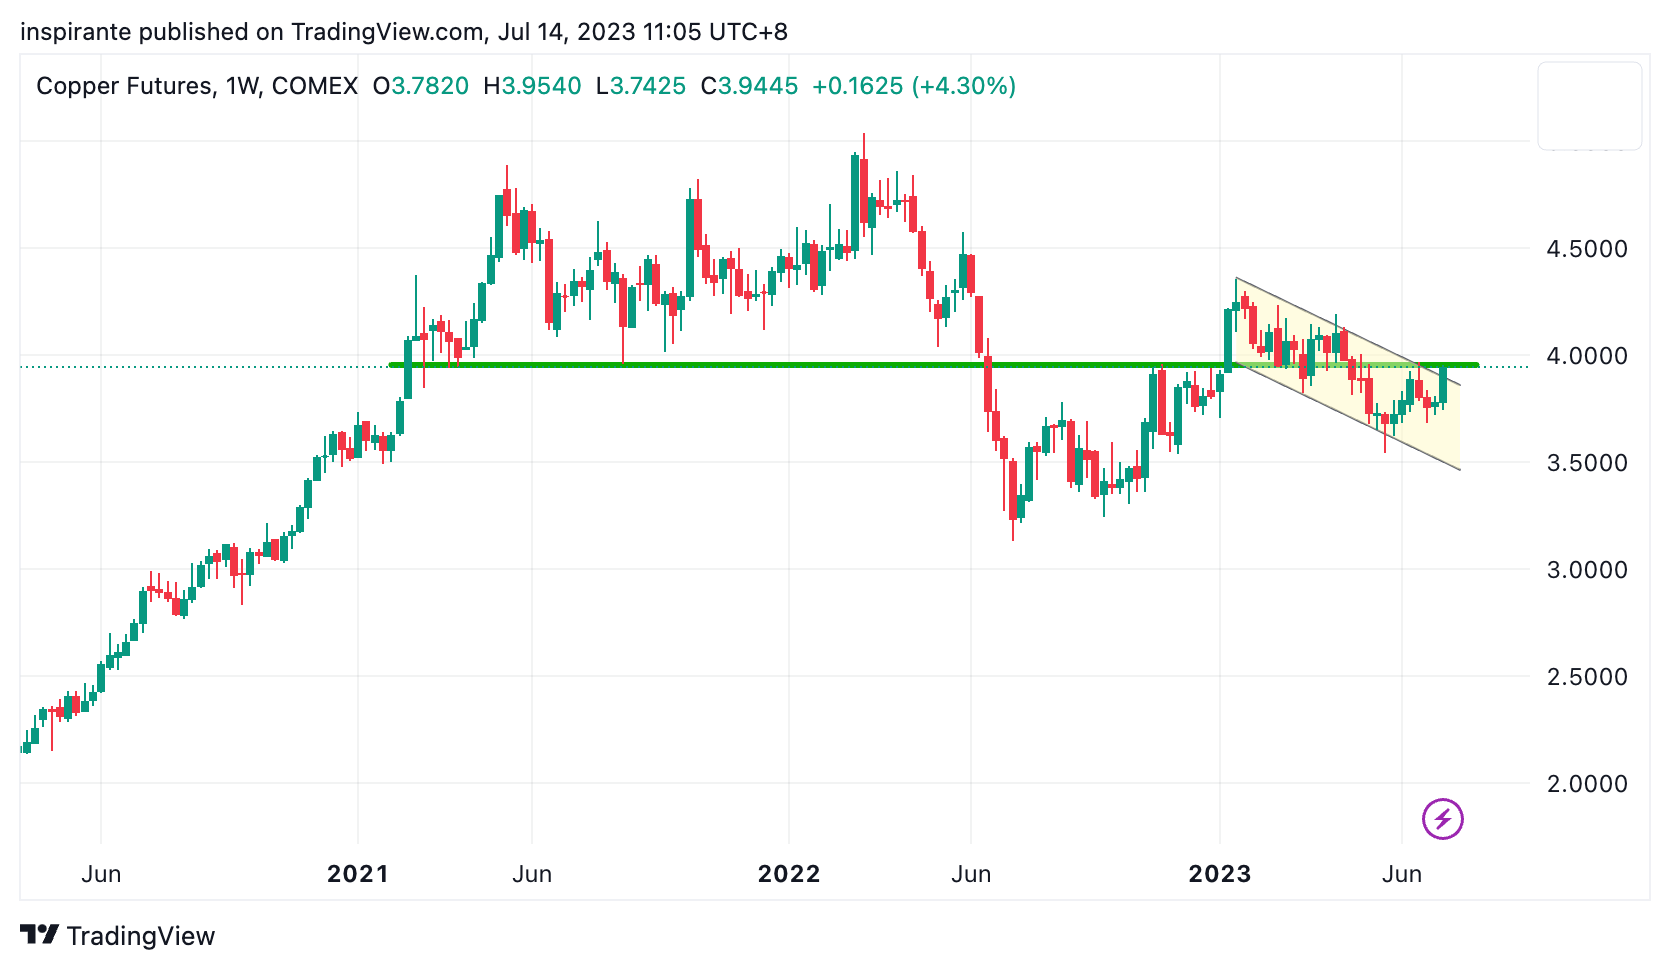
Copper has broken out from a seven-month bull flag on the US dollar weakness. However, all is not clear yet, as the 4.0 level is a strong overhead resistance that put the recent breakout in question.

Soybean oil has exhibited a textbook example of a Head-and-Shoulder (H&S) failure pattern. Following a false breakout, the price quickly rallied above the neckline with sustained momentum. Based on classical charting principles, it has the potential to climb at least to the shoulder level.
Our market views
What an unusual market environment we are witnessing right now! Based on the CME FedWatch Tool, we would see another 25bps rate hike for the upcoming July FOMC meeting, marking the end of this tightening cycle. Interestingly, the Fed Funds Futures market suggests the probability distribution for some substantial rate cuts by the end of 2024.
June’s Non-farm Payroll data revealed an addition of 209k jobs, falling short of expectations, accompanied by a downward revision of May’s figures. The red-hot labor market, one of the Fed’s top concerns, is showing signs of cooling off. The recent US inflation data reinforces this trend. Both headline and core CPIs have been weaker than expected, signaling a cooling of consumer prices. After two challenging years, it seems the US central bank has finally succeeded in reining in inflation. The market response has been a mix of relief and optimism.
Technology and growth stocks, which typically thrive in an accommodative policy environment, have been front-running this for quite some time. The Nasdaq has surged by over 46% since the beginning of the year, nearing its record high. Even more notable is their outperformance compared to other sectors, harking back to the heights of late 2021 (Nasdaq vs. Dow) and the Dotcom era (Nasdaq vs. Russell). Market euphoria, indeed!
The cooler-than-expected CPI print has arguably dealt a blow to the US dollar, catalyzing some impressive short-term moves in the commodities, particularly precious metals. We hear more voices calling for an all-time high for gold. Surprisingly, even base metals like copper, whose demand is closely tied to global macroeconomic activities, are riding this upward wave.
Fresh from the Trading Room’s readers should be aware of this. Recognizing when the market gets too ahead of itself has been a recurrent theme of this content series. We believe we’re witnessing another such instance. Logically, the path from where we are to where the market anchors its optimism – an aggressive unwinding of the rate hikes by the Fed – has to be fraught with economic turbulence. Why would the Fed hurry to cut if the economy and stock market are flourishing and the labor market remains robust? Isn’t a severe recession or similar adverse event a necessary precursor for such drastic policy reversals? This spurs us to reflect on the recent moves in various asset classes. Perhaps, the anticipated new all-time highs could turn out to be mere mirages in the desert – tantalizingly close yet frustratingly out of reach.
How do we express our views?
We consider expressing our views via the following hypothetical trades1:
Case study 1: short Nasdaq 100 to Russell 2000 ratio
We would consider taking a short position on the Nasdaq to Russell ratio. This strategy would bear fruit in two scenarios: if the Nasdaq retracts comparatively more than the Russell during an equity market downturn, or if the Russell outpaces the Nasdaq during an equity market upturn. We would short one micro E-mini Nasdaq 100 index future (MNQU3) at 15,700 and simultaneously long three micro E-mini Russell 2000 index future (M2KU3) at 1,960, at the current ratio of 8.01 and approximately equivalent notional amount. Each point in the micro E-mini Nasdaq 100 index future contract is USD 2, giving the short leg a notional value USD 31,400; in the micro E-mini Russell 2000 contract, it is USD 5, giving the long leg a notional value of USD 29,400. Looking at Figure 2, if the ratio reverses from the current level, it has the potential to fall back to 6.0 and lower.
Case study 2: short copper future
We would consider taking a short position on the copper future (HGU3) at the present level of 3.92, with a stop-loss above 4.08, which could bring us a hypothetical maximum loss of 0.16 points. Looking at Figure 4, if the overhead resistance holds and the recent breakout is rejected, the copper price has the potential to fall back to 3.5, a hypothetical gain of 0.42 points. A copper future contract represents 25,000 pounds of copper. Each point move in the copper future contract is USD 25,000.
EXAMPLES CITED ABOVE ARE FOR ILLUSTRATION ONLY AND SHALL NOT BE CONSTRUED AS INVESTMENT RECOMMENDATIONS OR ADVICE. THEY SERVE AS AN INTEGRAL PART OF A CASE STUDY TO DEMONSTRATE FUNDAMENTAL CONCEPTS IN RISK MANAGEMENT UNDER GIVEN MARKET SCENARIOS. PLEASE REFER TO FULL DISCLAIMERS AT THE END OF THE COMMENTARY.
 | A guest post by
|