The tale of two yields
Written on 2024-02-25, first published on 2024-02-28
Markets in focus
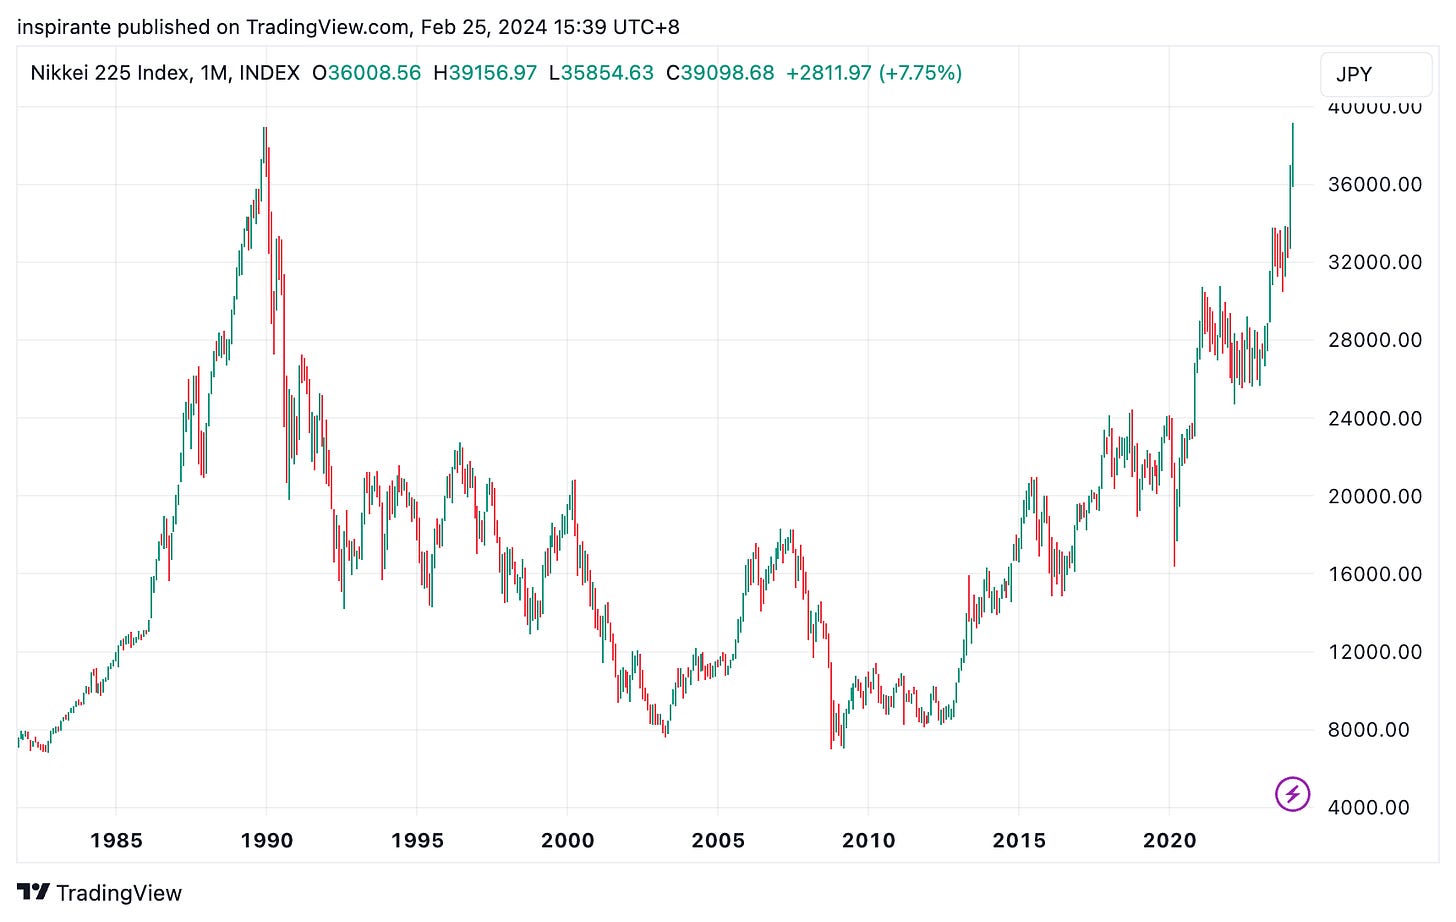
After over three decades, the Japanese Nikkei 225 index has finally surpassed the previous peak. This significant milestone was achieved through a combination of attractive valuations, a weakening Yen, and a rebound in global equity markets.
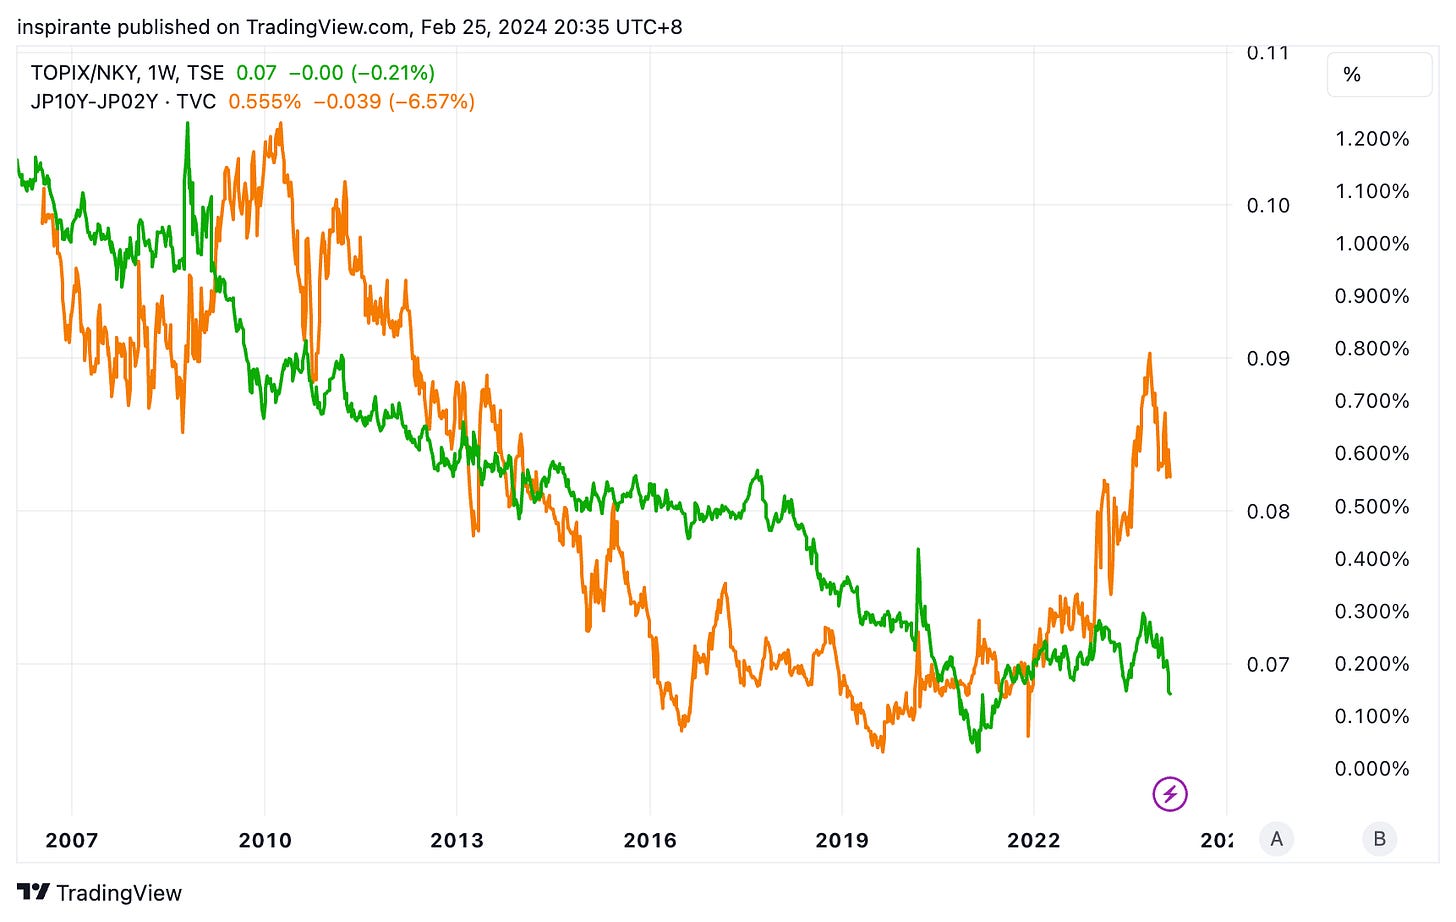
The TOPIX and Nikkei 225 ratio closely mirrors the spread between Japan's 10-year and 2-year yields. Historically, a flattening yield curve sees the TOPIX underperform relative to the Nikkei 225. Despite a recent notable yield curve steepening, the ratio remains lagging.
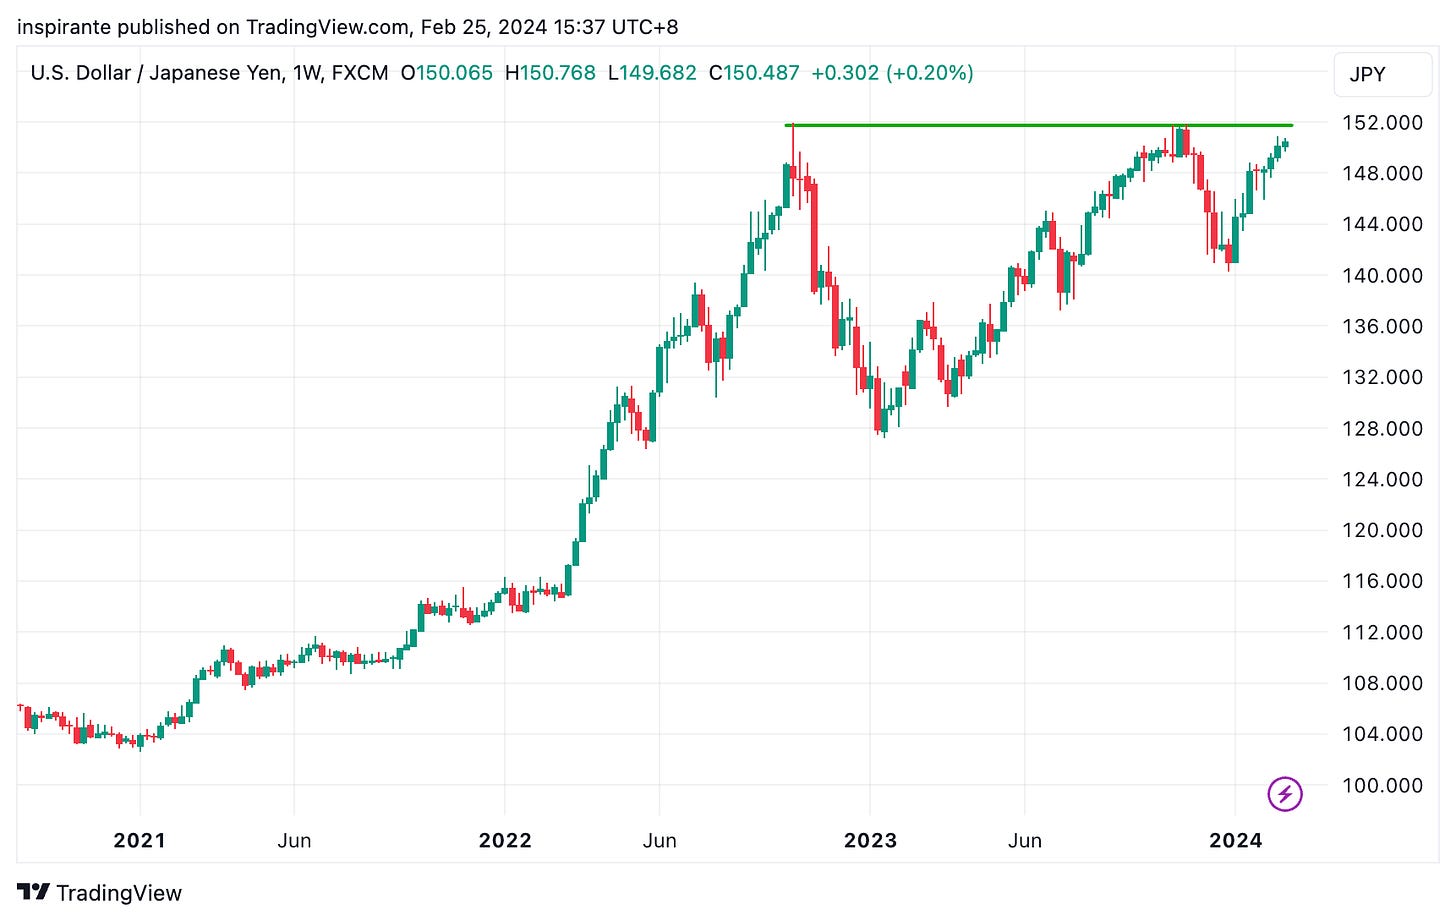
The USD/JPY pair has breached the 150 level, forming a distinct Cup-and-Handle continuation pattern. The 152 level represents a significant resistance point; failure to maintain this could signal a further weakening of the Japanese Yen against the U.S. dollar.
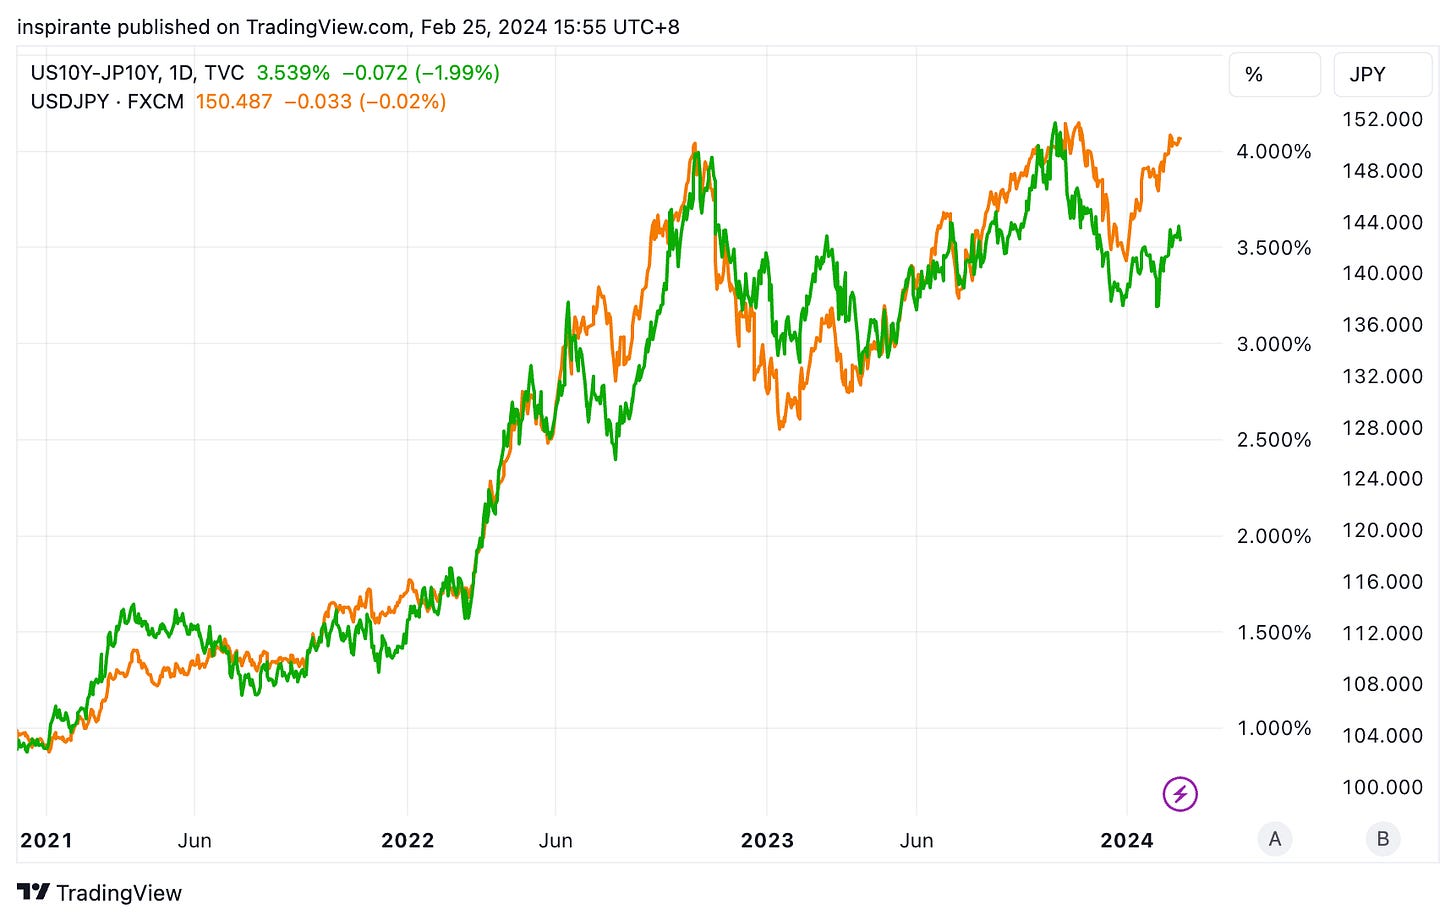
Since 2020, the USD/JPY and the U.S. 10-year yield have moved in tandem, primarily driven by U.S. bond yield dynamics influencing the yield differentials between the U.S. and Japan. Recently, a divergence has emerged, with the USD/JPY experiencing a much sharper rise compared to the modest bounce in the U.S. 10-year yield since the end of last year.
Our market views
In our very first piece of 2023, published precisely a year ago, we posited that Japan, the land of the Rising Sun, could be among the top macroeconomic events to watch. This assessment was grounded in the inflationary pressures beginning to manifest within Japan, alongside increasing yield differentials exerting pressure on the Japanese Yen. The Yen weakened as global bond yields rose, while Japanese yields remained suppressed. In response to these dynamics, we anticipated that the Bank of Japan (BoJ) would eventually move away from its Negative Interest Rate Policy (NIRP) and adjust its Yield Curve Control policy to permit a rise in bond yields, particularly at the longer end of the curve.
Despite minor policy adjustments by the BoJ, the anticipated "major event" did not materialize in 2023. Observing the movements of USD/JPY, which closely tracks the yield differential between the U.S. and Japan, it becomes apparent that U.S. bond yields remain the primary driver of the differential. Notably, there have been two key divergences recently. Firstly, the U.S. 10-year yield has moderately recovered from a recent low of 3.8% to 4.3%, still significantly below the previous year's peak of 5%. However, the USD/JPY has once again surpassed the 150 mark, approaching last year's peak.
The second divergence involves the Japanese yield curve—the difference between the yields on 10-year and 2-year government bonds—and the TOPIX/Nikkei 225 ratio. The yield curve's shape significantly influences the relative performance of these indices, with TOPIX having a greater sector weightage on financials than the technology and consumer goods-focused Nikkei 225. Despite the Japanese yield curve steepening significantly since 2023, which typically benefits the financials, TOPIX has continued to underperform the Nikkei 225, barring short-term gains driven by market anticipation of BoJ policy shifts that ultimately did not occur. Nonetheless, we maintain that Japan's monetary policy will eventually converge with the rest of the world's. Additionally, the ongoing fundraising scandal within the ruling Liberal Democratic Party (LDP) suggests political instability that may delay BoJ's policy normalization efforts until the latter half of the year.
Turning our attention back to the U.S., the much-anticipated "Fed Pivot" has been a pivotal factor in recent asset class movements, including record highs in the U.S. equity market and lower bond yields as investors piled into duration since October last year, coinciding with equities' V-shaped recovery. However, recent strength in U.S. economic data (both inflation and the labor market) has reignited concerns about a potential secondary inflationary wave and a possibly delayed or diminished Fed pivot. This apprehension has led to a rebound in the U.S. 10-year yield in recent weeks. Historically, the equity market tends to be the last to respond to macroeconomic regime shifts, compared to the fixed income or foreign exchange markets, largely due to higher retail participation. The current situation may be no exception, with the USD/JPY as the canary in the coal mine, indicating that wider yield differentials could persist in the short term. It's possible that U.S. bond yields may experience one final surge before the Fed ultimately intervenes.
How do we express our views?
We consider expressing our views via the following hypothetical trades1:
Case study 1: Long TOPIX/Nikkei 225 ratio
We would consider taking a long position on the synthetic TOPIX/Nikkei 225 ratio by buying 3 TOPIX March 2024 future (TPYH4) at 2,660 and selling 2 Nikkei 225 March 2024 future (NIYH4) at 39,470, with the price ratio at 2,660 / 39,470 = 0.0674. We would put a stop-loss below 0.064, which could bring us a hypothetical maximum loss of 0.0034 points. Each point move in the TOPIX futures contract is 5,000 Yen, and each point movein the Nikkei 225 futures contract is 500 Yen. Both legs have similar notional values (TOPIX: 2,660 x 5,000 x 3 = 39,900,000 Yen and Nikkei 225: 39,470 x 500 x 2 = 39,470,000 Yen). We can look at two hypothetical scenarios to understand the approximate amount of a 0.001 point move in the ratio. Assuming the TOPIX stays unchanged, and the Nikkei 225 drops to 38,888, the ratio becomes 2,660 / 38,888 = 0.0684. The overall profit, which only comes from the Nikkei 225 position in this case, is (39,470 – 38,888) x 500 x 2 = 582,000 Yen. Assuming the Nikkei 225 stays unchanged, and the TOPIX drops to 2,621, the ratio becomes 2,621 / 39,470 = 0.0664. The overall loss, which comes from the TOPIX position in this case, is (2,660 – 2,621) x 5,000 x 3 = 585,000 Yen. There is margin offset for TOPIX/Nikkei 225 ratio spreads.
Case study 2: Long 10-year yield futures
We would consider taking a long position on the 10-year yield futures (10YH4) at the current level of 4.255, with a stop-loss below the recent low of 3.9, which could bring us a hypothetical maximum loss of 4.255 – 3.9 = 0.355 points. Looking at Figure 4, if the U.S. 10-year yield "catches up" with the USD/JPY, it has the potential to rise to 5.0, a hypothetical gain of 5.0 – 4.255 = 0.745 points. Each point move in the 10-year yield futures contract is 1,000 USD.
Original link here.
EXAMPLES CITED ABOVE ARE FOR ILLUSTRATION ONLY AND SHALL NOT BE CONSTRUED AS INVESTMENT RECOMMENDATIONS OR ADVICE. THEY SERVE AS AN INTEGRAL PART OF A CASE STUDY TO DEMONSTRATE FUNDAMENTAL CONCEPTS IN RISK MANAGEMENT UNDER GIVEN MARKET SCENARIOS. PLEASE REFER TO FULL DISCLAIMERS AT THE END OF THE COMMENTARY.


