

The threat of tariffs
Written on 2024-11-30

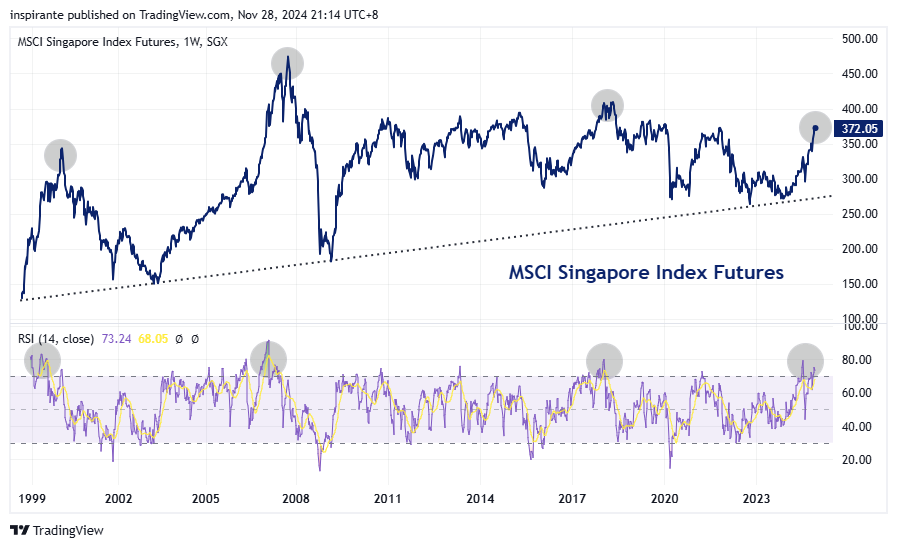
The recent rally in MSCI Singapore Index (SIMSCI) pushes the index close to overbought levels again. Historically, elevated RSI levels have often coincided with significant tops, with the index retreating soon after. Could history be repeating itself?

As we highlighted in September, the MSCI Singapore Index is sensitive to the interest rate cycle, largely due to its heavy weighting in financials.

The USD/CNH is approaching the upper end of its two-year range near the 7.3 level—a key resistance point that has held firm multiple times during this period.

A look back to 2018, when President Trump first introduced tariffs against China, reveals a significant 11% spike in USD/CNH.
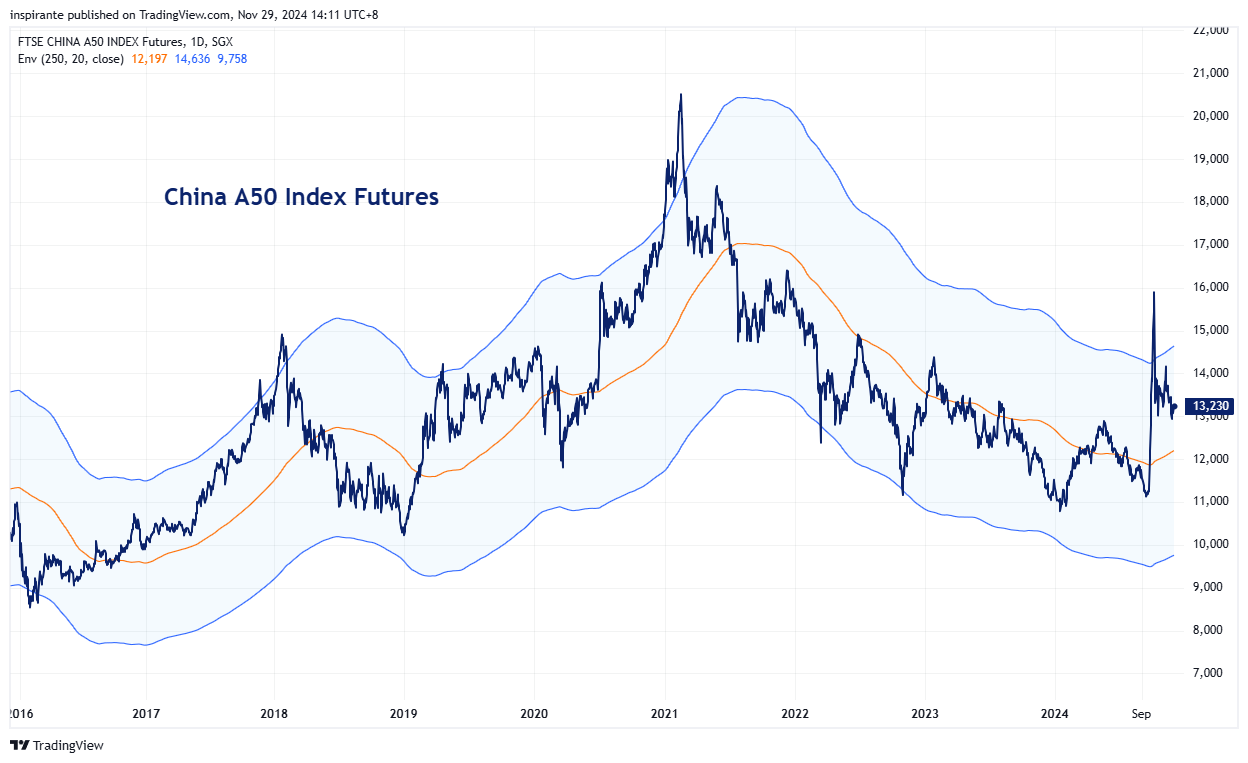
Over the past decade, a 20% rally above its one-year moving average has often marked a short-term peak for Chinese stocks, with subsequent corrections bringing the index back in line with the moving average.
What’s inside our playbook?
The recent rally in the MSCI Singapore Index has brought it to levels that historically signal overbought conditions. As seen in Figure 1, elevated RSI readings have been reliable indicators of market tops over the past two decades. With the index nearing these critical levels, the likelihood of a pullback grows increasingly pronounced.
Adding to the bearish narrative, the SIMSCI's significant exposure to financials—an interest rate-sensitive sector—renders it highly vulnerable to changes in monetary policy. As shown in Figure 2, the index’s historical performance has been closely tied to the Federal Reserve's interest rate cycle. With at least two additional rate cuts priced in for the coming year, lower net interest margins could weigh on the profitability of financial stocks, curbing the SIMSCI’s upside potential. The current rally, in light of these factors, appears overstretched and primed for correction.
The USD/CNH currency pair is also at a critical juncture, trading near the upper end of its two-year range at 7.3. As shown in Figure 3, this level has repeatedly served as a key resistance point. However, this time, the context is different. With president Donald Trump returning to office and the potential for new or expanded tariffs on Chinese goods, the yuan faces significant downside risks.
Reviewing the 2018 Tariff Impact:
A look back at 2018, when former President Trump first implemented tariffs on Chinese imports, highlights the significant impact of trade tensions on the USD/CNH exchange rate.
In March 2018, Trump announced tariffs on $50 billion worth of Chinese goods, citing intellectual property concerns. By July 6, 2018, a 25% tariff on $34 billion in imports was implemented, followed by an additional $16 billion in August. The USD/CNH exchange rate reacted sharply, with the yuan depreciating as markets anticipated higher export costs for China and potential retaliatory measures.
As the trade war escalated, Trump proposed a 10% tariff on $200 billion worth of Chinese goods in July 2018. This further exacerbated concerns over China's economic stability, contributing to the yuan's decline.
Historical data suggests that every $10 billion in tariffs imposed during this period corresponded to an average increase of approximately 1.7% in the USD/CNH exchange rate. By the end of 2018, the yuan had depreciated significantly, reflecting investor sentiment favoring the USD as a safe-haven asset amid trade uncertainty.
Whats next?
In his upcoming term, Donald Trump has proposed significant new tariffs on Chinese imports, aimed at addressing trade imbalances and encouraging re-shoring efforts. This policy marks a continuation of his previous administration’s protectionist stance, but with even greater potential ramifications.
Trump has outlined plans for a 10% tariff on all Chinese imports, which would be applied in addition to existing tariffs. Even more striking is the possibility of escalating these tariffs to 60% on select Chinese goods, reflecting his aggressive approach toward what he perceives as unfair trade practices. This marks a significant increase compared to the 7.5%-25% range implemented during the 2018 tariff cycle.
As outlined earlier, the USD/CNH exchange rate has historically been sensitive to tariff announcements. In 2018, tariff escalations led to an 11% rise in USD/CNH, reflecting market expectations of economic strain on China and increased demand for the U.S. dollar as a safe-haven asset.
Given the proposed scope of these new tariffs, the potential for another significant move in USD/CNH is high. As shown in Figure 4, the current level of 7.23 represents a critical resistance point. A move above this level could open the gate for further weakness as market participants revisit the 2018 scenario.
Over the weekend, Trump escalated his rhetoric further, threatening 100% tariffs on goods from BRICS countries, including China. This threat introduces a new layer of urgency, as such measures would have far-reaching implications for global trade and intensify pressure on the yuan.
Executing the plays
A hypothetical investor can consider the following two trade1:
Case Study 1: Long SGX USD/CNH Futures
We would consider taking a long position in the SGX USD/CNH futures contract given the potential impact of tariffs on the yuan as President Trump’s new term approaches. The previous tariff cycle demonstrated asymmetric upside in USD/CNH, making this an attractive opportunity if tariffs are implemented.
At the current price level of 7.2347, setting a stop loss at 7.1249 and take profit at 7.4700 offers an approximate 2:1 risk to reward ratio.
Each UC contract has a notional exposure of 100,000 USD, with a 0.0001 move representing 10 CNH.
Case Study 2: Short SGX MSCI Singapore Index Futures (SGP)
As shown in Figure 1, the SGX MSCI Singapore Index Futures appear overbought from a long-term perspective. Historically, such elevated levels, coupled with a turning point in interest rates, have marked trend reversals for the index.
A short position in the MSCI Singapore Index will allow us to capture this potential correction, with an entry at the current level of 372.05, stop at 398 and take profit at 322.
A 1 point move in SGP is 100 SGD.
Original Link: https://www.sgx.com/research-education/market-updates/20241130-derivatives-traders-playbook-threat-tariffs
Examples cited above are for illustration only and shall not be construed as investment recommendations or advice. They serve as an integral part of a case study to demonstrate fundamental concepts in risk management under given market scenarios.