
The Worst January?


Markets in Focus
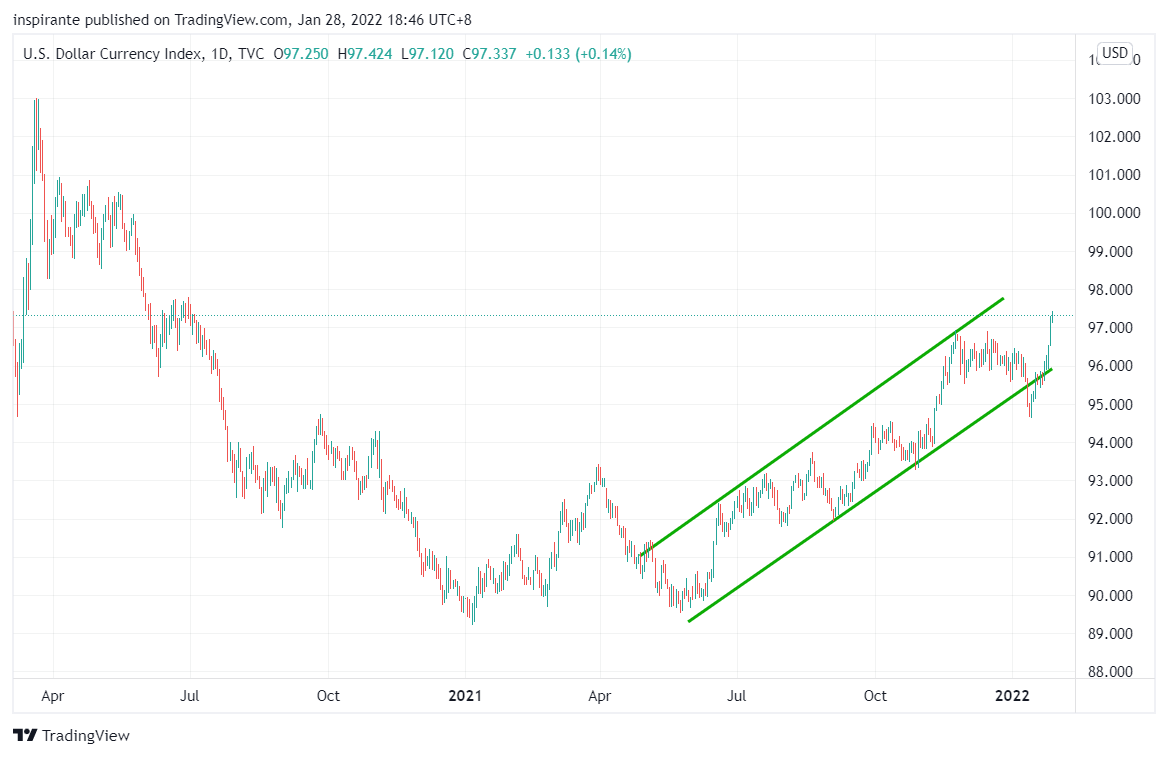
The breakout of the US Dollar from the seven-month uptrend channel turned out to be a false break as the greenback quickly rallied back. It is now challenging the 97 level, the highest since Q3 2020. Risk-off sentiments in the market, especially the equity selloffs, have certainly contributed to the Dollar’s strength. It remains to be seen if the US Dollar can have a meaningful follow-through on the upside.
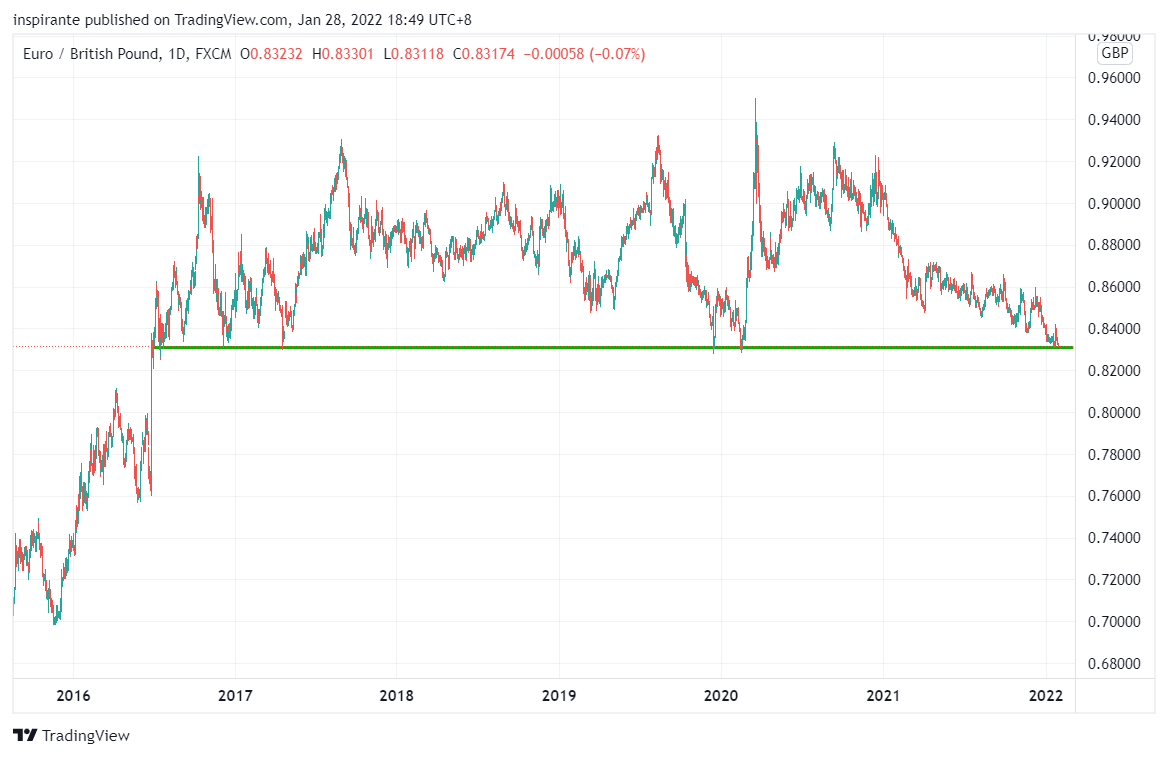
The Euro/GBP pair is currently sitting at the six-year support of around 0.83. Since the beginning of 2021, the Euro has substantially weakened against its British neighbor, partially due to the BoE adopting a much more hawkish stance on the monetary policies than the ECB.

The Russian Ruble is trading near the all-time weakest level against the US Dollar. The recent geopolitical tension between Russia and Ukraine has certainly spooked the financial market, adding more headwinds to the RUB/USD pair as uncertainties mount.
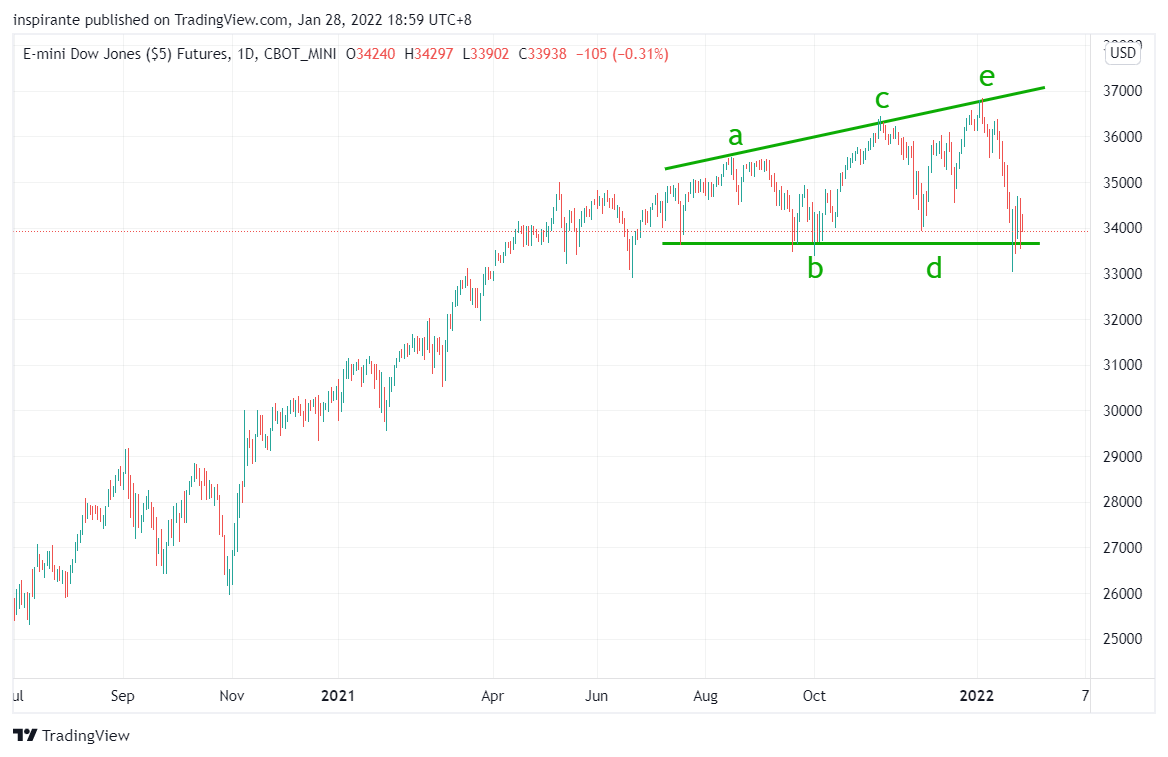
The Dow Jones Industrial Average index has completed a textbook five-point broadening top. If the index cannot rebound meaningfully above 34000 to negate the pattern, there might be much more pain on the downside going forward.
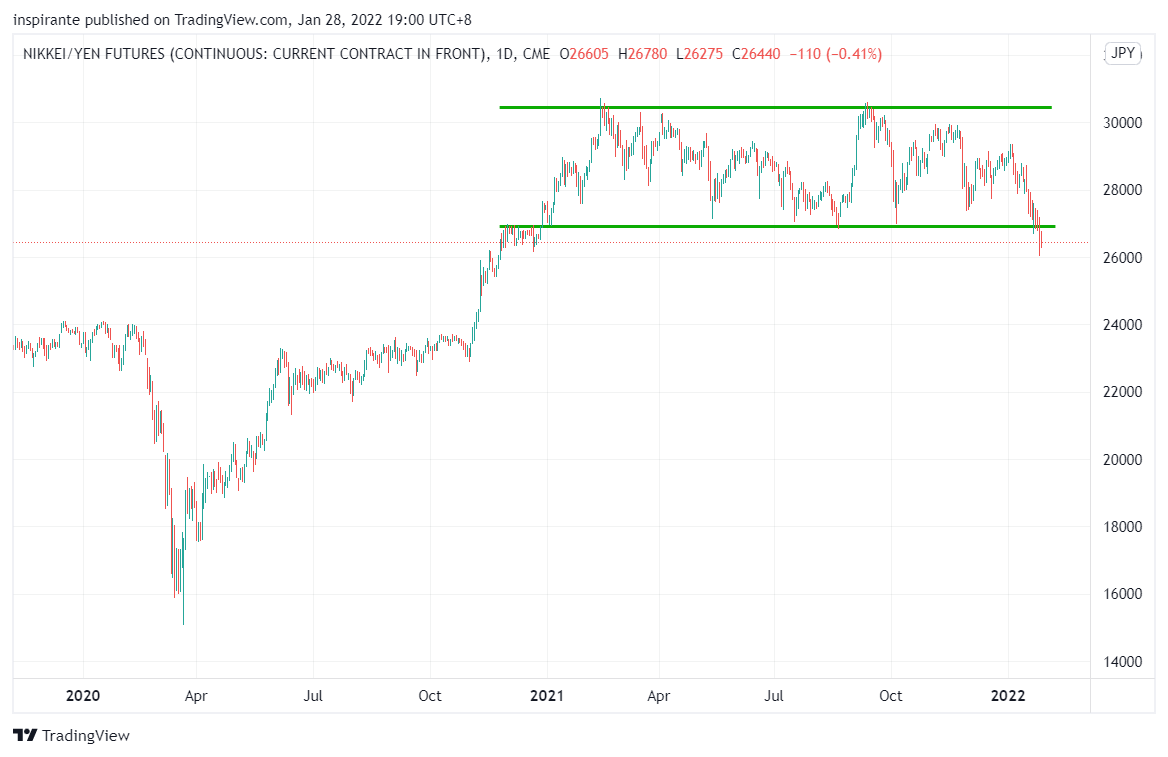
The Nikkei 225 Index has broken its 2021 rectangle trading range. There is little support below until the 24000 level, which used to be a formidable resistance since 2017.
Market Views
Although we still have a few more trading days left in the month at the time of writing, Nasdaq and S&P500 indices are both on track to head for their worst January ever. So far, the percentage decline of these indices is even greater than that of the Januarys of 2008 and 1990.
The extended selloff of the equity market has manifold reasons. Most notably, the recent hawkish pivot by the Fed has the market aggressively priced in more than four 25bps rate hikes by 2022 and some more in 2023. The Fed signals that tapering will conclude in March 2022, and subsequently, rate hikes are on the table. The entire US yield curve is already above pre-March 2020 levels at the end of January. Understandably, the tech-heavy US stock market, which is ultra-sensitive to duration risks, experienced tremendous selling pressure. Other equity markets such as the Japanese Nikkei 225 also get dragged down, although the decline is less painful than the US tech companies.
The risk-off sentiment has been a tailwind for the US Dollar as it is still a safe haven asset for global investors. As we have noted in the previous issue, we could not get more confirmation on the early January trend breakdown of the Dollar. It turned out to be a short-lived false break, and the Dollar is now back to the uptrend channel. Still, there is no clear indication of either direction for the Dollar at this moment.
When the US Dollar continues to get stuck in a range, we want to shift our focus and find opportunities in other cross-currency pairs without Dollar exposure. EUR/GBP is an interesting one among such pairs. It is currently at a significant multi-year support level from a technical perspective. Fundamentally, as the Fed finally turned hawkish in an attempt to tackle rampant inflation, ECB might have to respond soon to the severe inflation pressures in the Eurozone too. If that happens, we could see the Euro/ GBP pair sharply rebound.
How to play the theme out
A hypothetical investor can consider the following trades1:
Case Study 1: Short Micro E-mini Dow Index Future
If the investor were to short the Micro E-mini Dow Index future (MYMH2) at around 34200 and set the stop above 35000, his maximum loss per contract would be (35000 – 34200) x 0.5 = 400 USD. A measured target points to 31000, resulting in (34200 – 31000) x 0.5 = 1600 USD.
Case Study 2: Long EUR/GBP Future
If the investor were to long the EUR/GBP future (RPH2) at around 0.834 and set the stop below 0.82, his maximum loss per contract would be (0.834 – 0.82) x 125000 = 1750 GBP. An initial target points to 0.88 and subsequently 0.92, resulting in (0.88 – 0.834) x 125000 = 5750 GBP and (0.92 – 0.834) x 125000 = 10750 GBP.
Examples cited above are for illustration only and shall not be construed as investment recommendations or advice. They serve as an integral part of a case study to demonstrate fundamental concepts in risk management under given market scenarios.
 | A guest post by
|