Markets in Focus
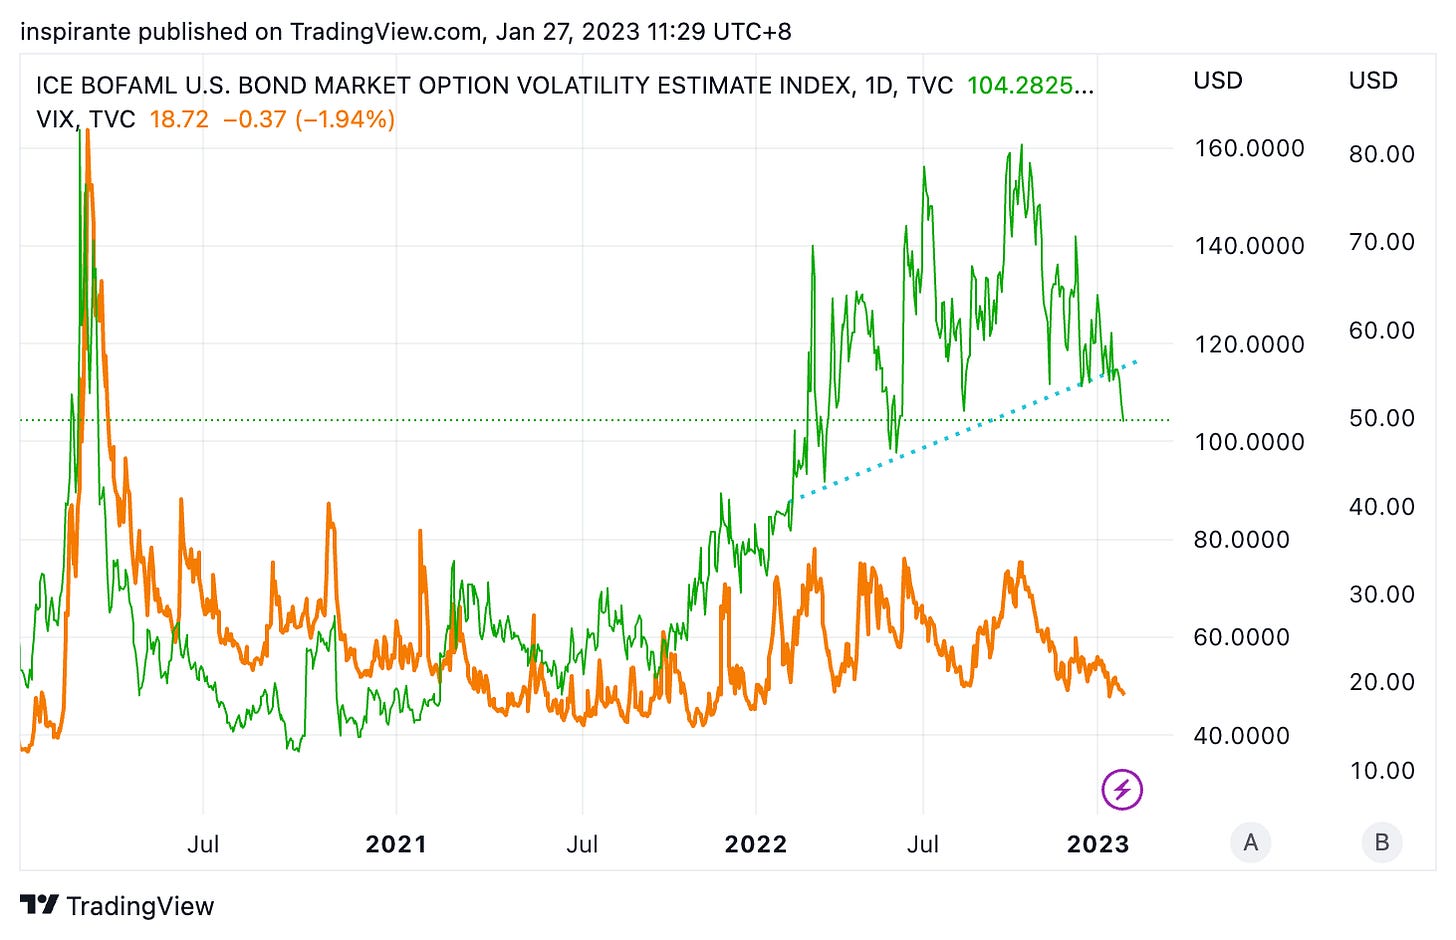
The MOVE Index (which measures the bond market’s volatility) and the VIX (which measures the stock market’s volatility) have diverged significantly since 2022. The MOVE collapsed from the extreme high of 160 but remained elevated. On the other hand, the VIX has fallen below 20 since the beginning of the year.
In October 2022, the end of the 20th National People’s Congress marked the equity market low for China. Since then, with rapid reopening and renewed optimism from investors, the FTSE China 50 Index has climbed more than 60%. However, the index is in the overbought zone and at a strong overhead resistance level.
Soybean oil has formed a gigantic Head-and-Shoulder (H&S) top. If the neckline is broken around 60, the soybean oil price has the potential to fall to 40.
Soybean oil and palm oil are close substitutes; therefore, their prices have been highly correlated in the past decade. Since 2022, however, a notable divergence has seen palm oil substantially underperforming soybean oil. The gap seems to have begun narrowing.
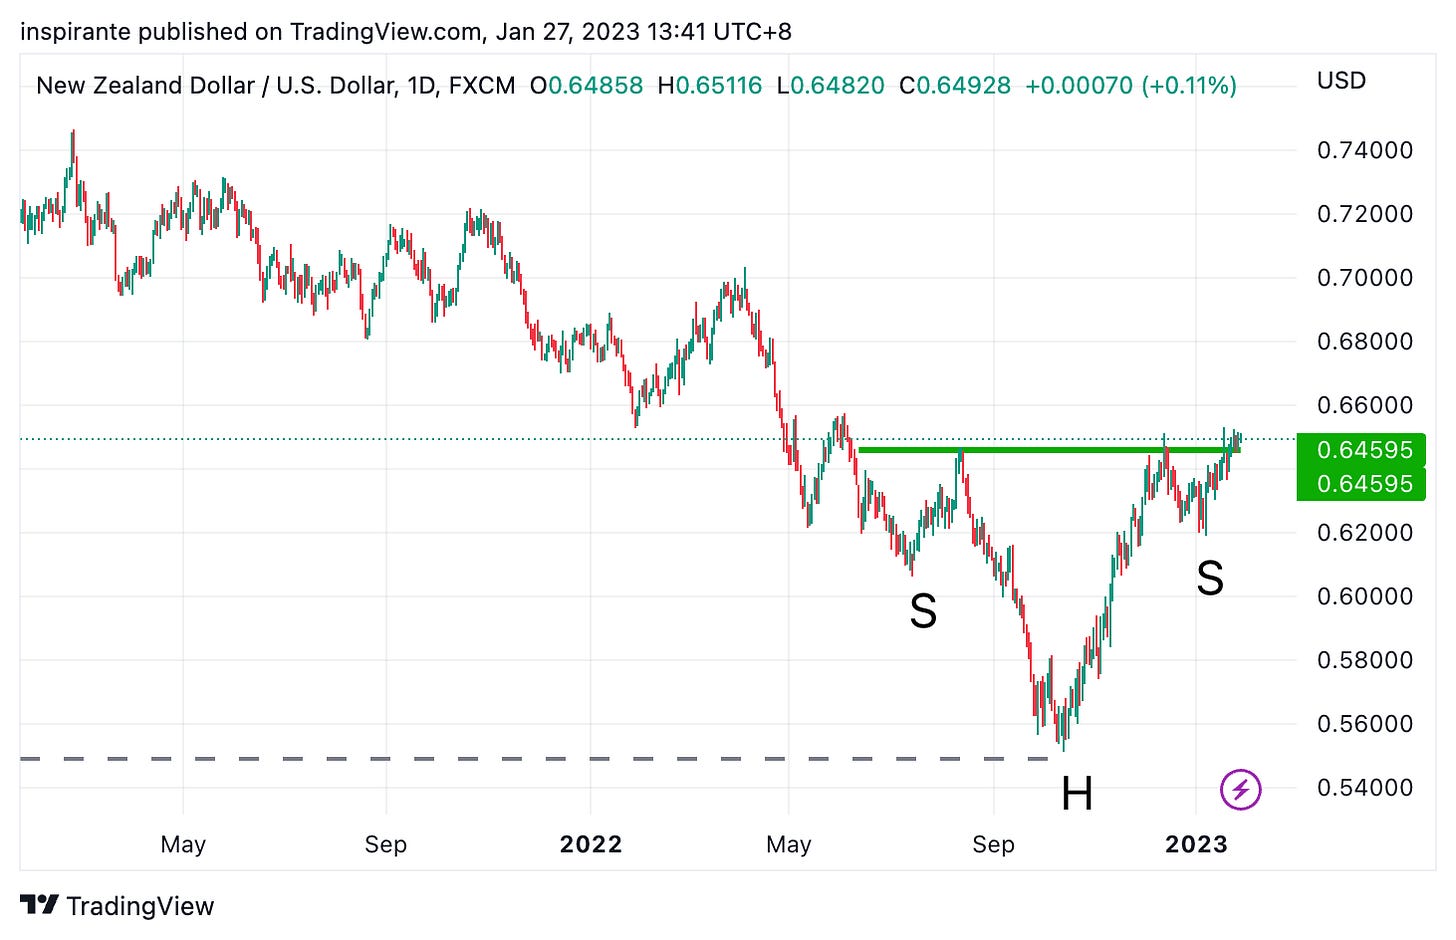
With the general weakness of the greenback, the reopening of China, and a new prime minister who emphasized that China is “incredibly important economically” to New Zealand, the Kiwi has strengthened substantially and broken out from a symmetrical H&S bottom.
Our Market Views
Most of our readers must be pretty familiar with the Volatility Index, a.k.a. VIX, which measures the stock market’s expectation of volatility based on the S&P 500 Index options. The VIX also has a nickname called the “Fear Index,” as its move tends to correlate inversely with the equity market, i.e., the VIX rises when the market is under heightened stress and uncertainties.
The MOVE Index, also a very important volatility index, is perhaps lesser known to those who do not deal with Fixed Income. Without getting into the technicalities, the MOVE index can be considered very similar to the VIX, except it measures the expectation of the bond market’s volatility.
Historically, these two indices move in tandem because risk and uncertainty (therefore implied volatility) usually permeate through the entire financial market, rather than being isolated in a single asset class. However, there were also very notable occasions where these two indices diverged. The past twelve months were one of such, as shown in Figure 1. The VIX has been trading sideways in the 20s since late 2020. On the other hand, the MOVE Index has stayed at an extremely elevated level (120 – 160) for the entire 2022! The reason behind this giant alligator jaw is not mystical. H2 2021 was when inflation meaningfully picked up and was shown in the headline numbers. The Fed did its first post-pandemic rate hike in March 2022. Since then, the market has been obsessed with inflation and the potential rate hike paths. Both expectations have led to a breathtaking selloff in the bond market. That explains the elevated MOVE. In contrast, the equity market has also been selling off for the better part of 2022 but has done so in a much more orderly manner, hence the muted VIX.
Fast forward to today, the MOVE has collapsed to around 100 from the high of 160. The market seems to have finally come to a consensus that inflation has peaked, the Fed’s rate hike is more or less done, and we are near the terminal rate. In other words, no more surprises in either inflation or policy move. We still remain a strong skeptic of that. The alligator jaw will most likely close up soon, either via the “nice” way, where MOVE collapsed further back to its historical norm, or the “nasty” way, where perhaps the equity market underestimated the risk moving forward. This is the question that keeps us on our toes. Therefore, amid all the uncertainties in the equity and bond markets, we prefer to look beyond these asset classes and explore opportunities in currencies and commodities where the charts provide much cleaner technical setups.
How We Express Our Views
We consider expressing our views via the following hypothetical trades1:
Case Study 1: Short Soybean Oil Future / Long Malaysian Crude Palm Oil Future
We would consider taking a short position on Soybean Oil future (ZLH3) at the present level of 61, and a long position on USD Malaysian Crude Palm Oil future (CPOH3) at the present level of 890 for a notionally equivalent amount. Looking at Figure 3 and Figure 4, if Soybean Oil breaks the H&S neckline, it has the potential to fall relatively more than crude palm oil, closing the gap between the two. Each point move in the ZL future contract is USD 600, and each point move in the CPO future contract is USD 25.
Case Study 2: Long NZD/USD Future
We would consider taking a long position on the NZD/USD future (6NH3) at the present level of 0.648 with a stop-loss below 0.62, which could bring us a hypothetical maximum loss of 0.028 points. Looking at Figure 5, if the H&S bottom breakout is confirmed and trend reversal continues, NZD/USD has the potential to reach 0.74, a hypothetical gain of 0.092 points. Each point move in the NZD/USD future contract is USD 100000.
Original Link: https://www.cmegroup.com/newsletters/fresh-from-the-trading-room/2023-02-01.html
EXAMPLES CITED ABOVE ARE FOR ILLUSTRATION ONLY AND SHALL NOT BE CONSTRUED AS INVESTMENT RECOMMENDATIONS OR ADVICE. THEY SERVE AS AN INTEGRAL PART OF A CASE STUDY TO DEMONSTRATE FUNDAMENTAL CONCEPTS IN RISK MANAGEMENT UNDER GIVEN MARKET SCENARIOS. PLEASE REFER TO FULL DISCLAIMERS AT THE END OF THE COMMENTARY.


