
Welcome to Japan, Mr. Bond
Welcome to Japan, Mr. Bond
Written on 2023-10-06, first published on 2023-10-10


Markets in focus

The Nasdaq has broken down from an eight-month rising channel. Now, it’s gathering itself just above a pivotal neckline. Should it falter here, eyes will be set on potential support only at the 13000 level.
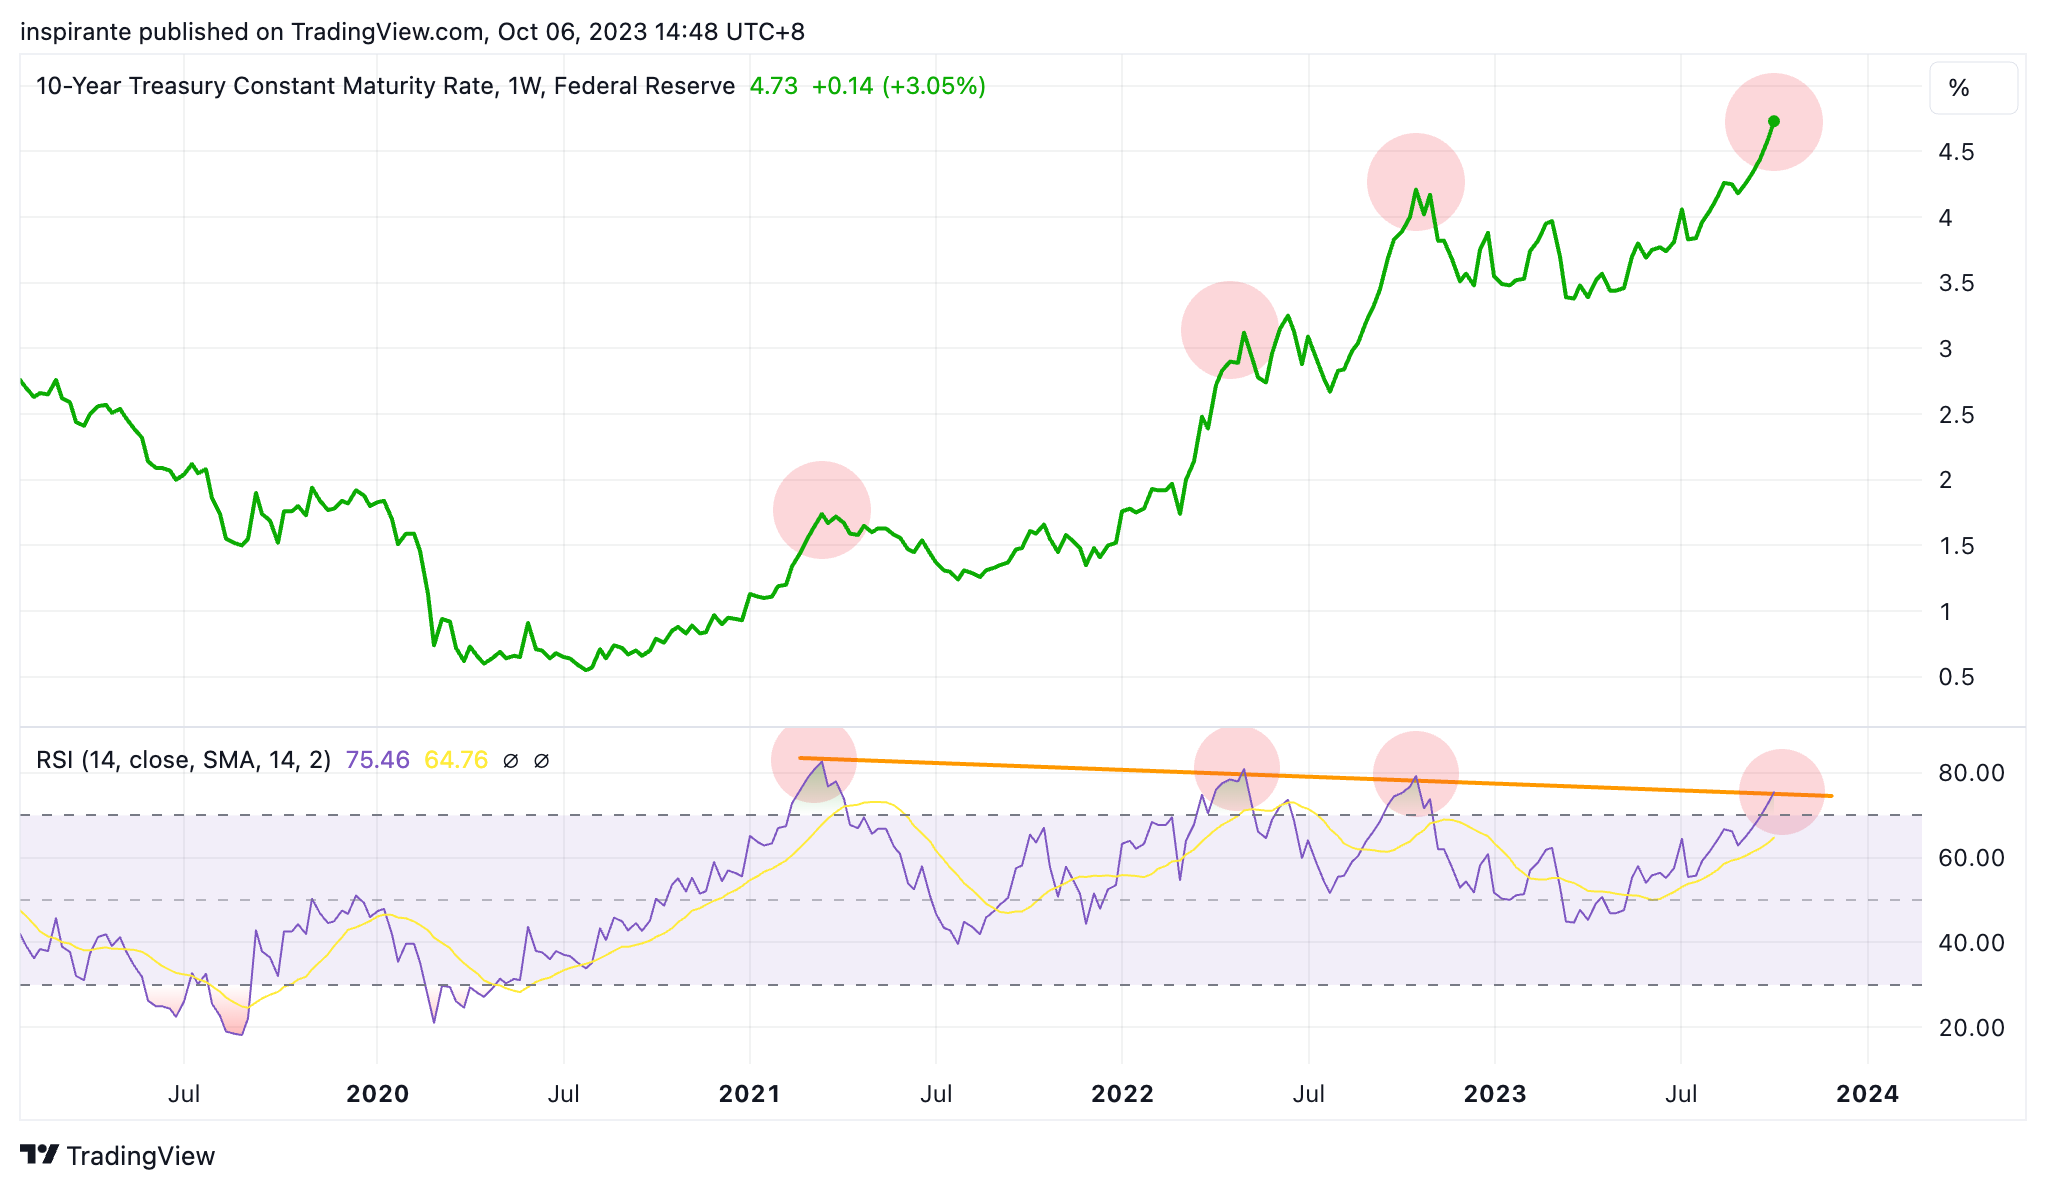
The US 10-year yield has reached its highest level since 2007. Since 2021, it has made four consecutive higher highs. However, the Relative Strength Index (RSI) shows divergence as it only registered four lower highs. Such RSI divergence usually suggests exhaustion in the direction of the trend.
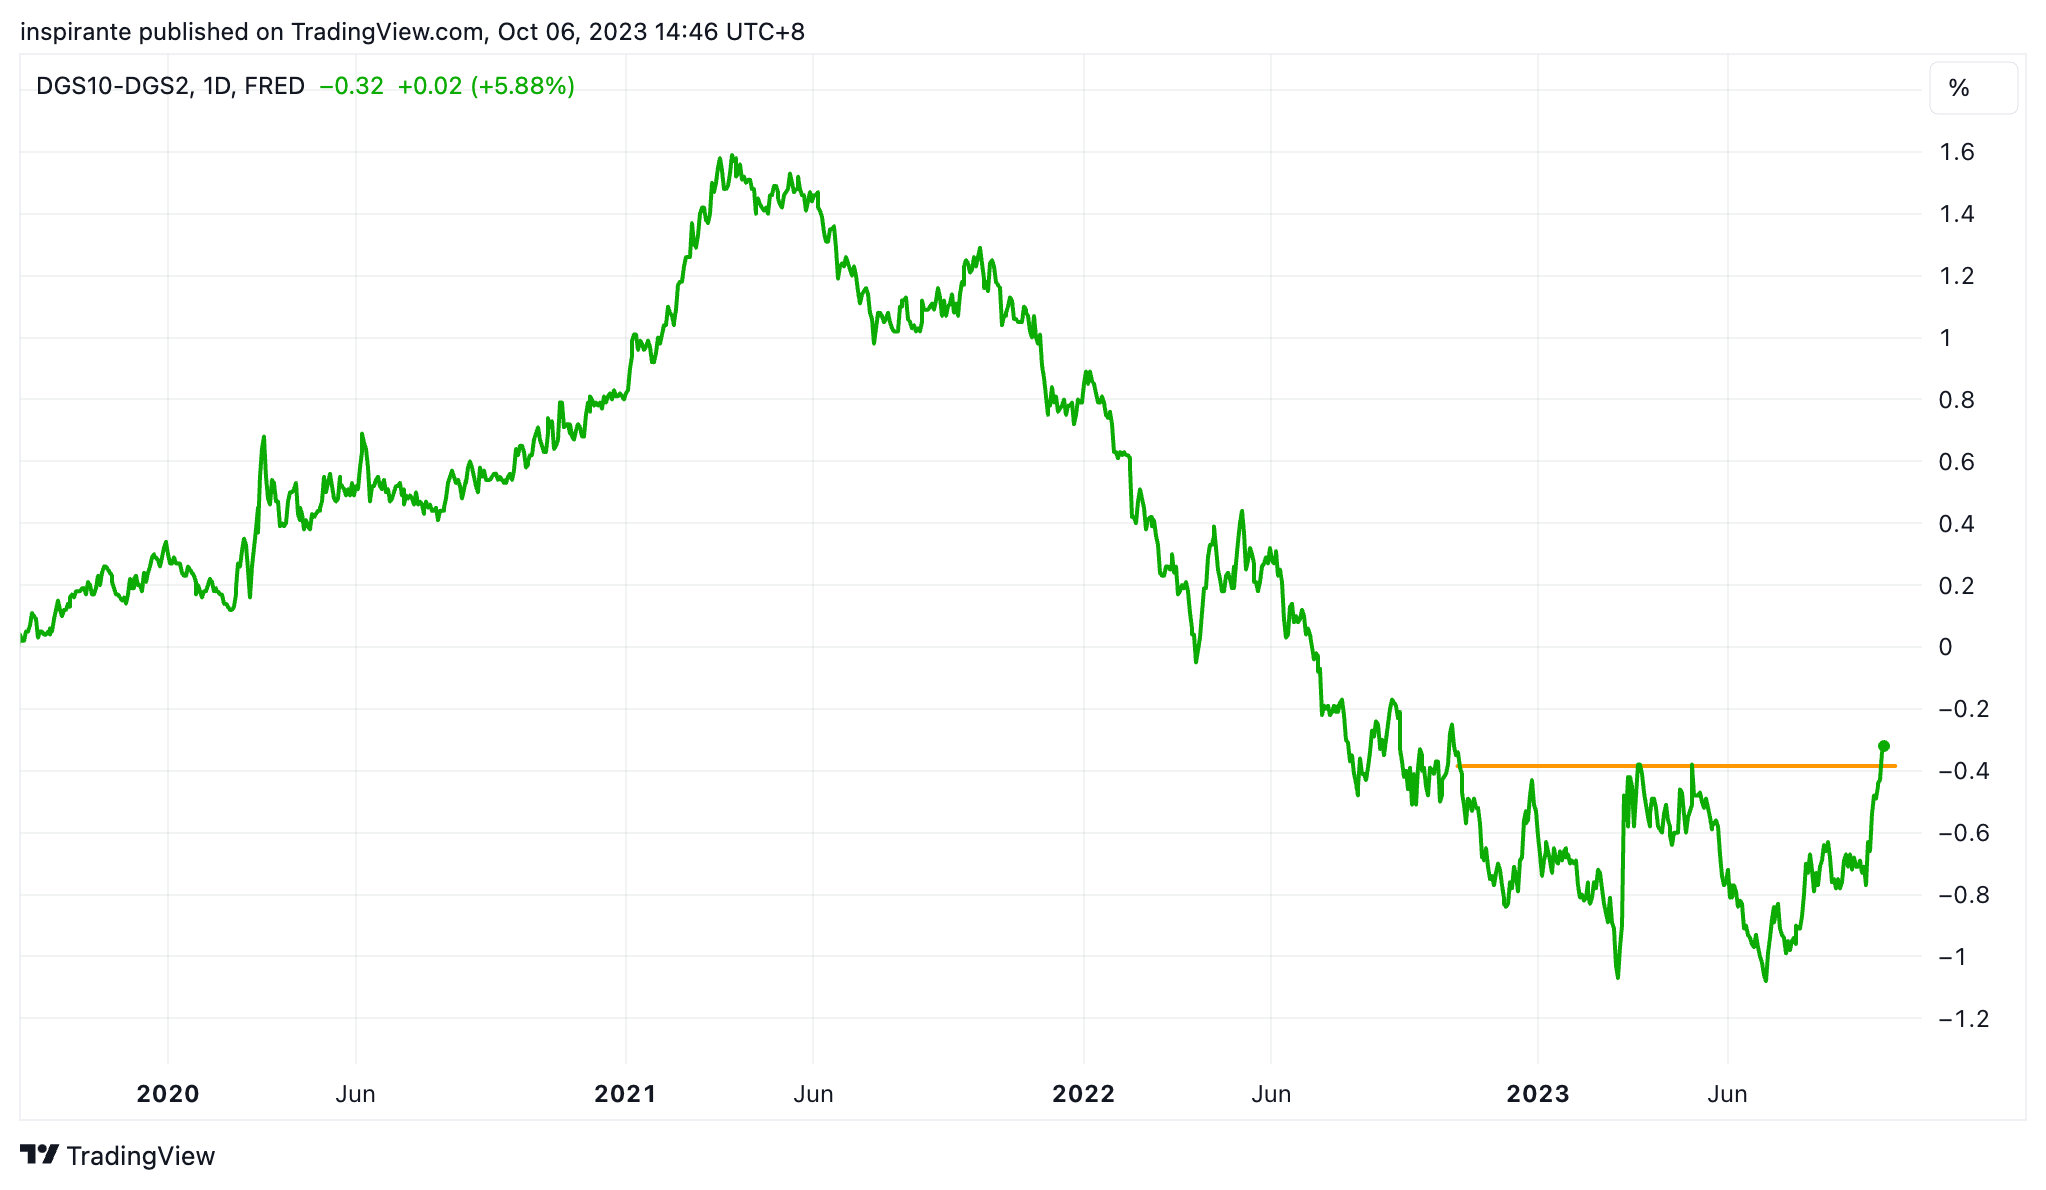
With the US 10-year yield soaring higher, the yield curve steepened substantially, as seen from the 2y10y yield spread. It has arguably completed a double bottom.
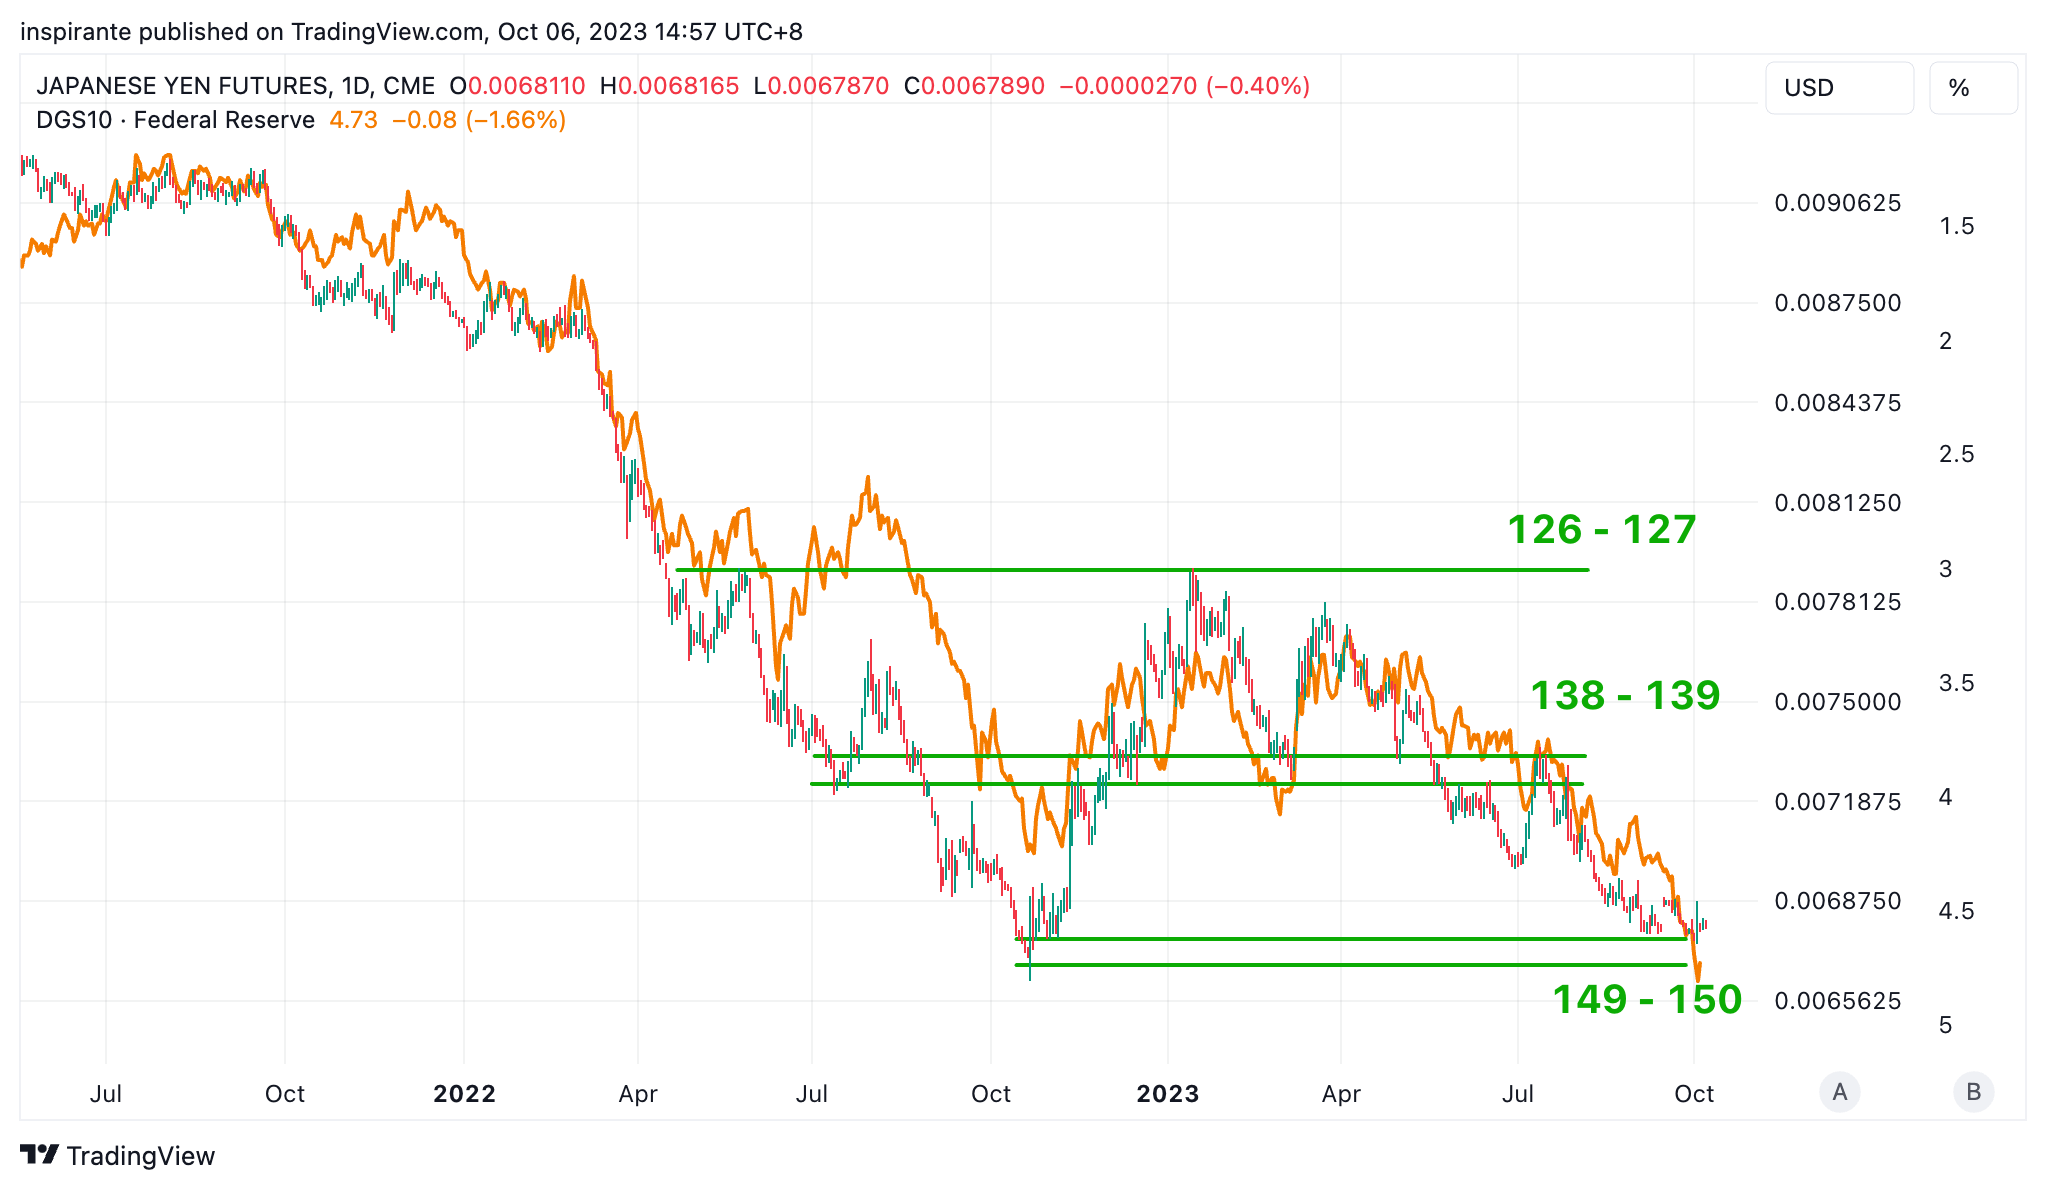
The Japanese Yen has been weakening against the US dollar in lockstep with the US yield move. Interestingly, Yen’s current level is where the Bank of Japan (BoJ) stepped in to intervene in 2022. If we expect bond yields to pull back, Yen will likely strengthen from here.

Natural gas price has been consolidating in a tight range for the better part of 2023. As winter approaches, it starts to move higher and potentially break out from the range.
Our market views
Over the past few weeks, media headlines have buzzed with the “parabolic” surge in US treasury yields. To frame this in context, the US 10-year yield – a global benchmark and the cornerstone risk-free gauge of modern finance – has surged nearly 70 basis points from late August to early October. This places it at levels reminiscent of 2007, eerily just before the fallout of the Great Financial Crisis.
While a myriad of factors have nudged yields upwards, today we will hone in on the technical aspects of recent moves. Post-pandemic, four periods stand out distinctly (from August 2020 to March 2021, March to May 2022, August to September 2022, and May 2023 onwards), where we witnessed brisk rate rises followed by notable pullbacks. Typically, these climbs ranged between 130–140 bps. From its May trough of 3.5%, the US 10-year yield has since ascended over 143 bps, peaking at 4.81%. In addition, as we see in Figure 2, these four local peaks reveal an RSI divergence on a weekly scale. Such patterns often hint at dissipating momentum, with each successive thrust appearing less forceful.
Diving into cross-asset dynamics, it’s clear the US dollar has been on a tear, registering gains for twelve consecutive weeks since July—such a robust streak points towards a potential pause or pullback. Oil prices offer another illustration: having soared from sub-$60 in June to $95 by September-end, the early days of October saw them retract over 13% to settle in the low $80s. Concurrently, gasoline prices dipped by 18%. This abrupt reversal in the energy market, spurred by factors like profit-taking and looming recession concerns, may relieve some yield pressures as inflationary outlooks moderate.
To distill our perspective: markets are seldom linear. Gleaning insights from technical indicators and the pervasive bearish sentiment on social media, we surmise that we might have witnessed a bond market capitulation. The likelihood of a temporary peak in yields followed by a short-term pullback seems plausible. Referring to Figure 4, the Japanese Yen stands out as an ideal instrument to capitalize on the “yield reversal” trade, given its high correlation with yield movements, and its current positioning at a level that might trigger BoJ intervention. In addition, any broad US dollar weakness is also a tailwind for the Yen. Essentially, a long position on JPY is the one single deed that helps us meet many needs.
And just as markets never move in a straight line, neither do they consolidate indefinitely. With winter looming, the historically winter-volatile prices of natural gas start to show the seasonal pattern. We might’ve been a tad early in our August attempt to turn bullish on natural gas. Still, as we highlighted then, the beauty of our ratio call strategy lies in its ability to cap potential losses at the outset if the price breakout did not materialize. Now, we’re inclined to revisit this prospect and give it another try.
How do we express our views?
We consider expressing our views via the following hypothetical trades1:
Case study 1: long JPY/USD future
We would consider taking a long position on the JPY/USD future (6JZ3) at the present level of 0.00678, with a stop-loss below 0.00665, which brings us a hypothetical maximum loss of 0.00678 – 0.00665 = 0.00013 points. As shown in Figure 4, if JPY/USD reverses from the support level, it has the potential to reach 0.0072, a hypothetical gain of 0.0072 – 0.00678 = 0.00042 points. Each JPY/USD futures contract represents JPY 12,500,000, and each point move is USD 12,500,000. E-mini JPY/USD future (J7Z3) is also available at half of the contract size.
Case study 2: short natural gas ratio calls
We would consider taking a short position on natural gas ratio calls. We could sell one natural gas November 2023 call option with strike price 3.3 (ONX3 3.3C) at 0.180 points and buy two ONX3 3.4C at 0.14 points. The setup cost of the ratio calls is 0.14 x 2 – 0.18 = 0.1 points. Looking at Figure 5, if natural gas continues the rally and moves beyond 3.4 + (3.4 – 3.3) + 0.1 = 3.6 by the option expiry, the strategy will be in profit. The maximum loss happens when the underlying settles at 3.4 by option expiry, and the potential loss amount is (3.4 – 3.3) = 0.1 point. A natural gas option contract represents 10,000 MMbtu of natural gas; each point move is USD 10,000. Investors could also consider natural gas weekly options to trade or hedge specific event risks.
EXAMPLES CITED ABOVE ARE FOR ILLUSTRATION ONLY AND SHALL NOT BE CONSTRUED AS INVESTMENT RECOMMENDATIONS OR ADVICE. THEY SERVE AS AN INTEGRAL PART OF A CASE STUDY TO DEMONSTRATE FUNDAMENTAL CONCEPTS IN RISK MANAGEMENT UNDER GIVEN MARKET SCENARIOS. PLEASE REFER TO FULL DISCLAIMERS AT THE END OF THE COMMENTARY.
 | A guest post by
|