
When there’s a divergence
When there’s a divergence
First published on 2022-04-27


Markets in Focus
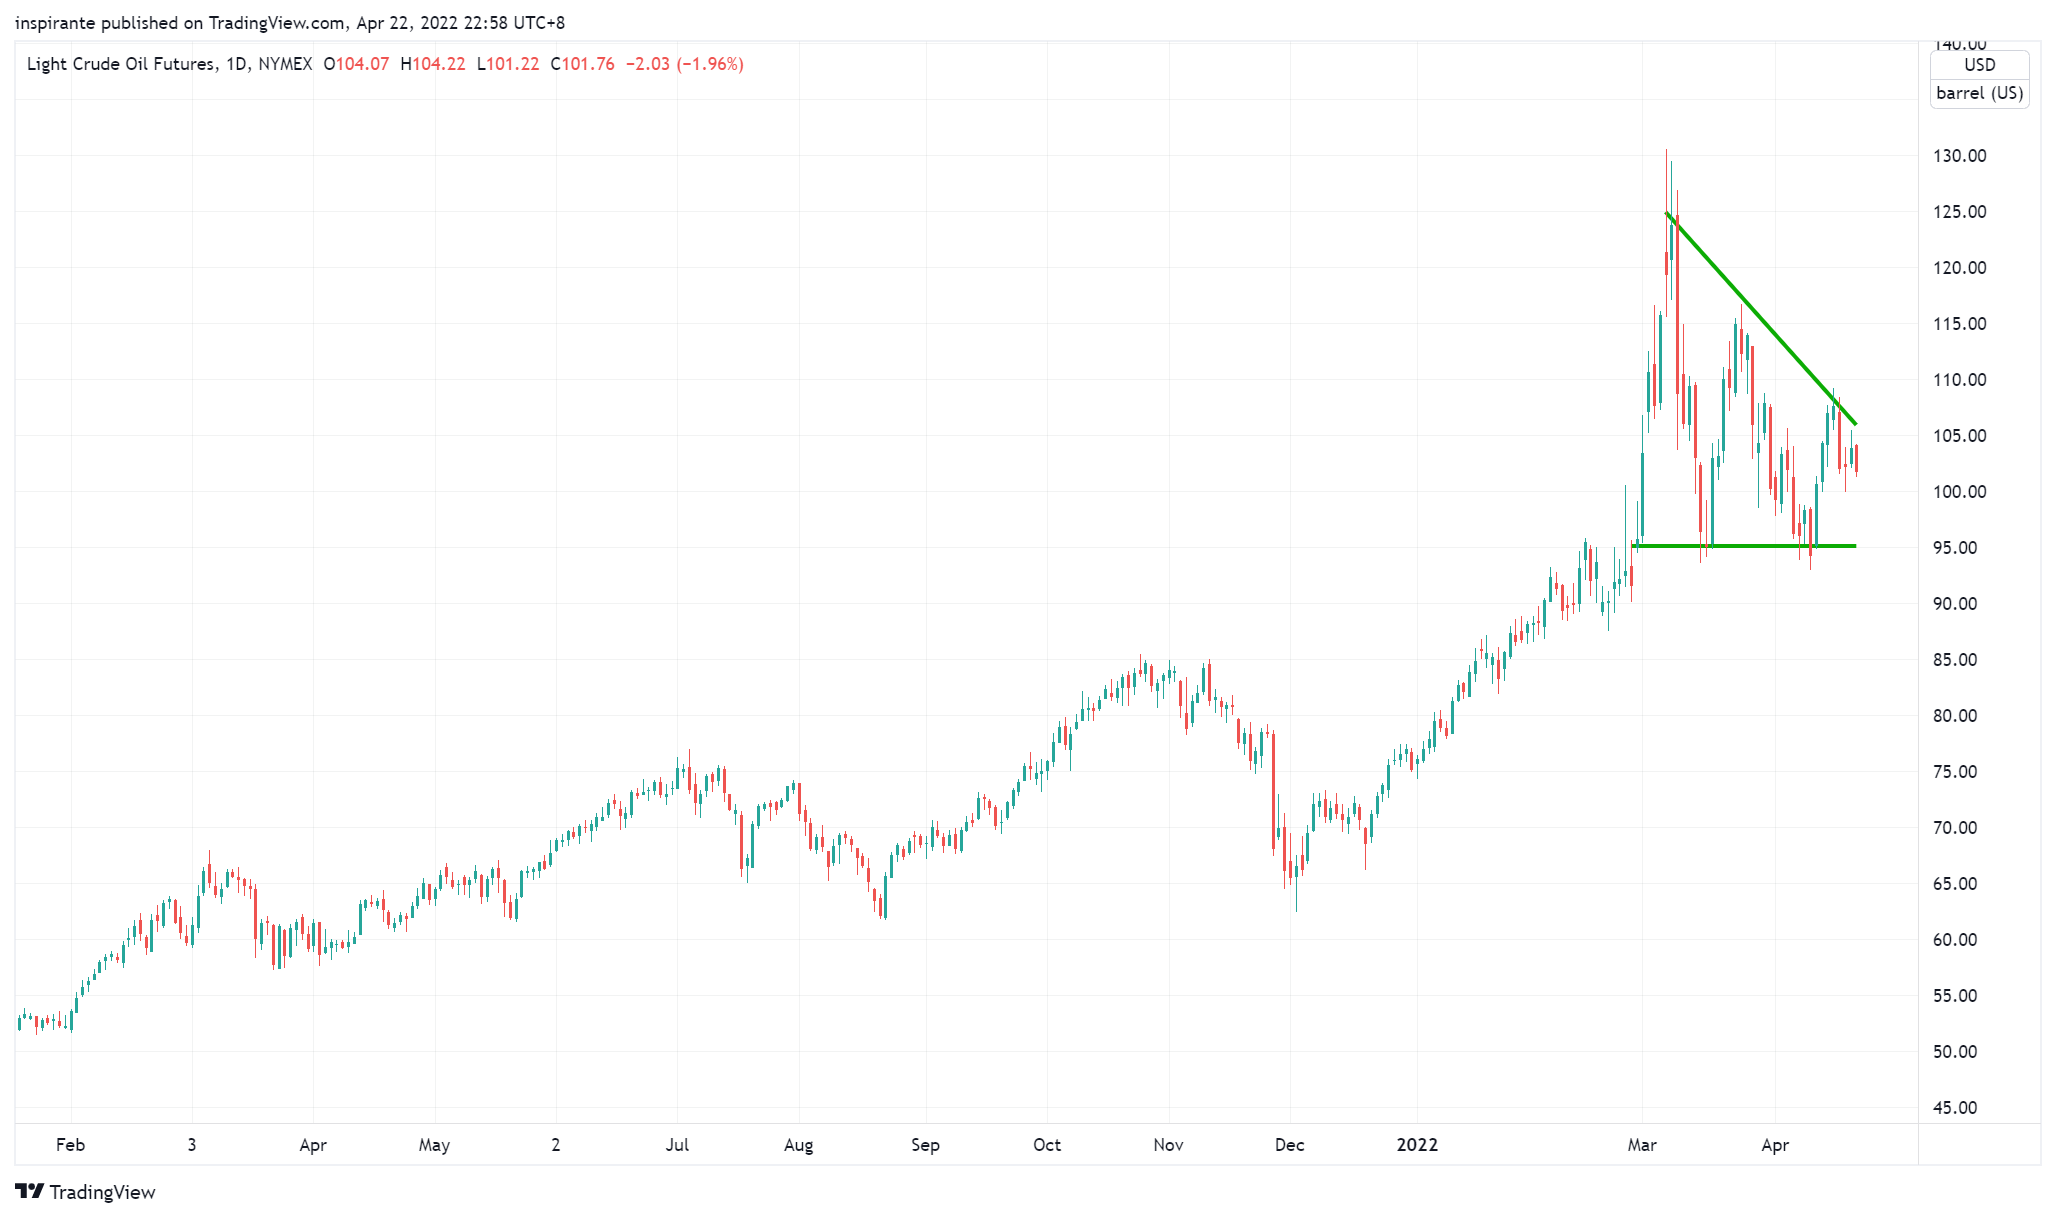
The geopolitical headlines in early March pushed the front-month WTI Crude Oil future price to over 130. The ensuing swings have formed a six-week descending triangle pattern with a significant support at 95. No longer being short-term overbought, the price action looks constructive. The fundamental energy shortage problem will likely resume the uptrend of oil prices once the consolidation is over.
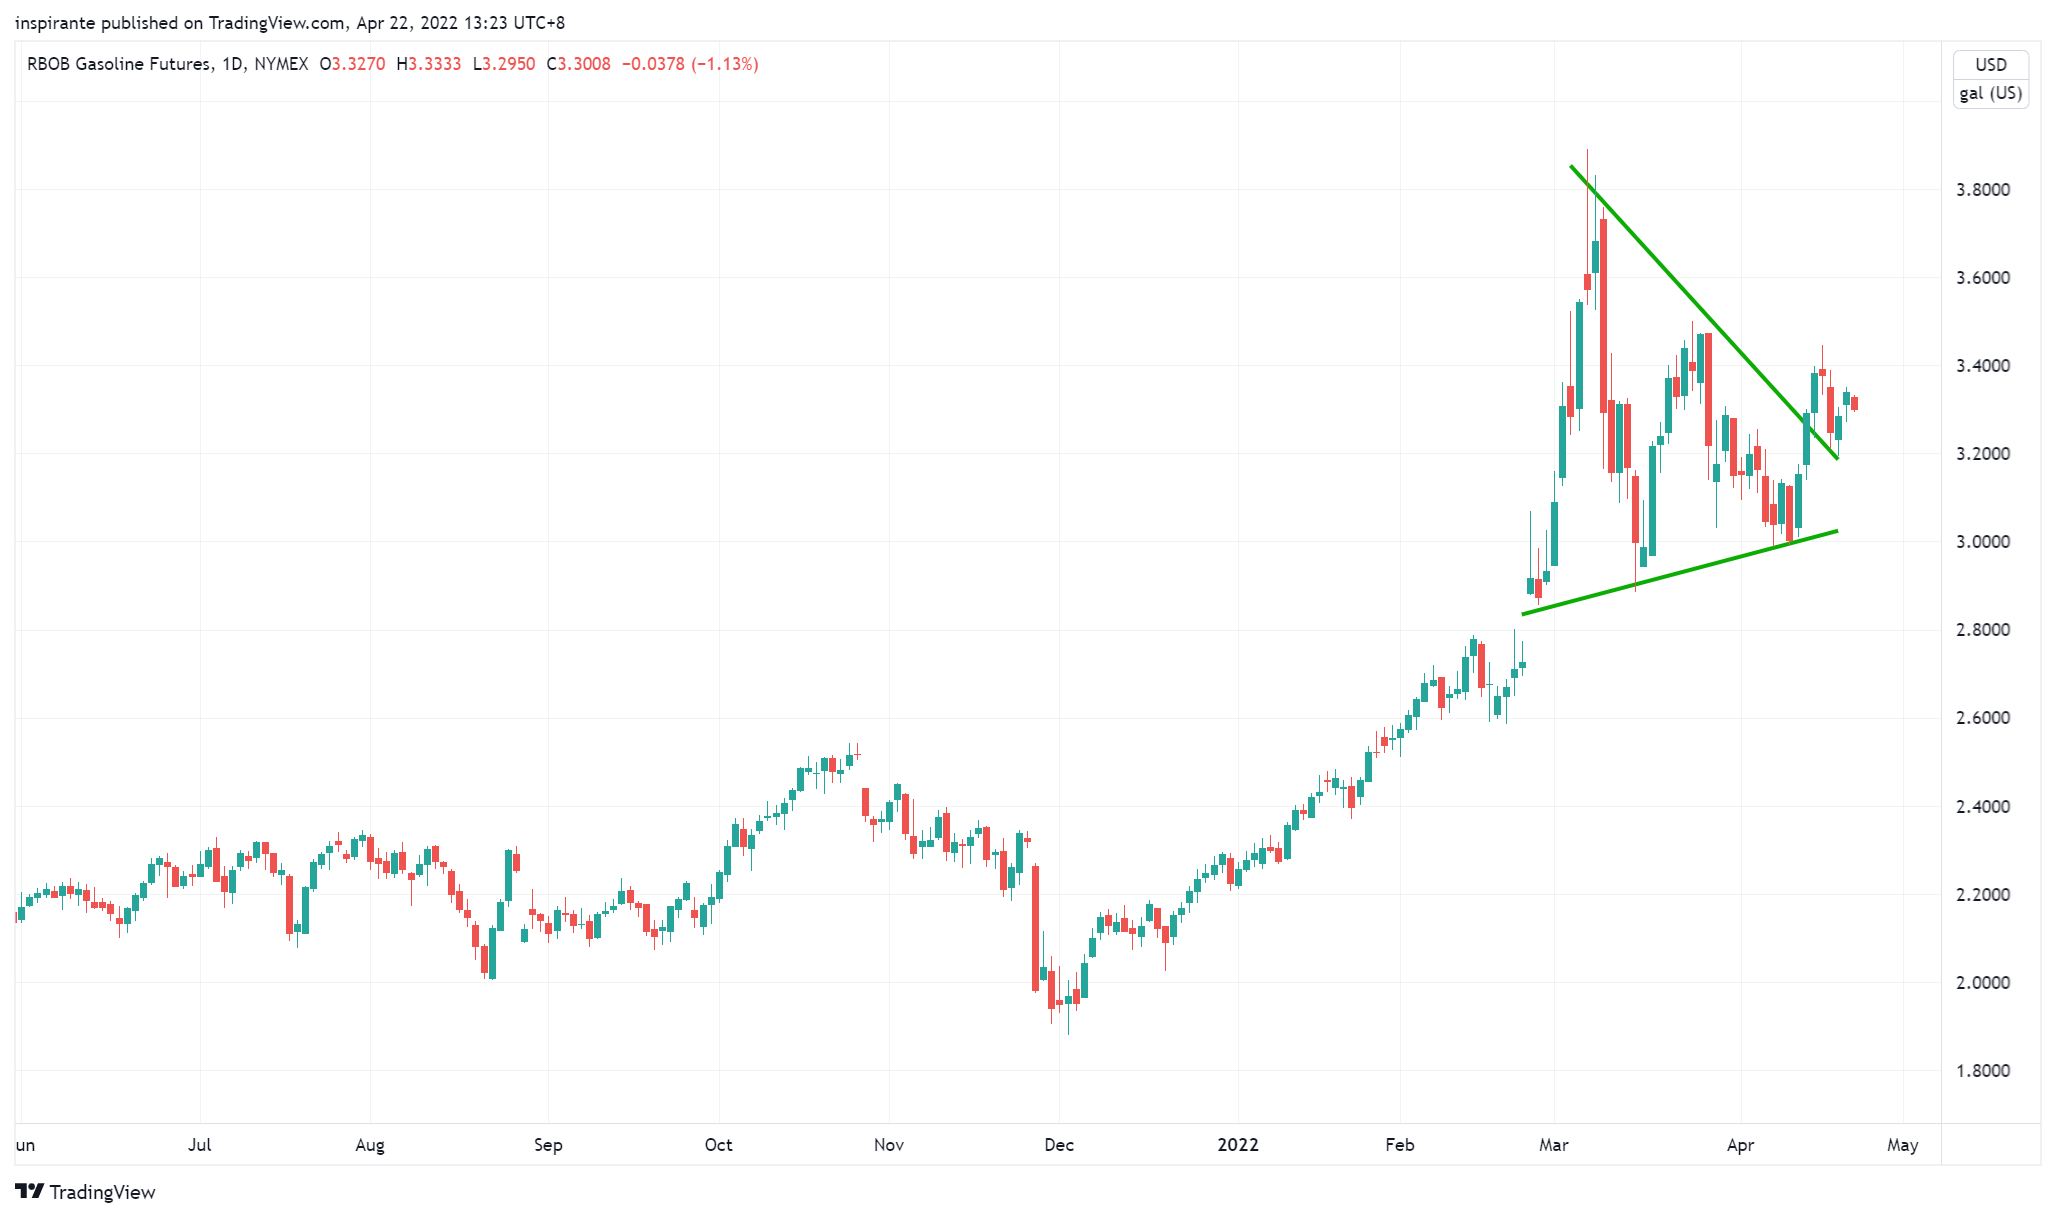
Similarly, RBOB Gasoline price has formed a symmetrical triangle with lower highs and higher lows. It is typically a continuation pattern that, when broken, the dominant trend resumes. It has already broken to the upside, backtested, and held above the upper resistance in the past week. Moreover, the demand and consumption of gasoline are seasonally the strongest in the summertime.
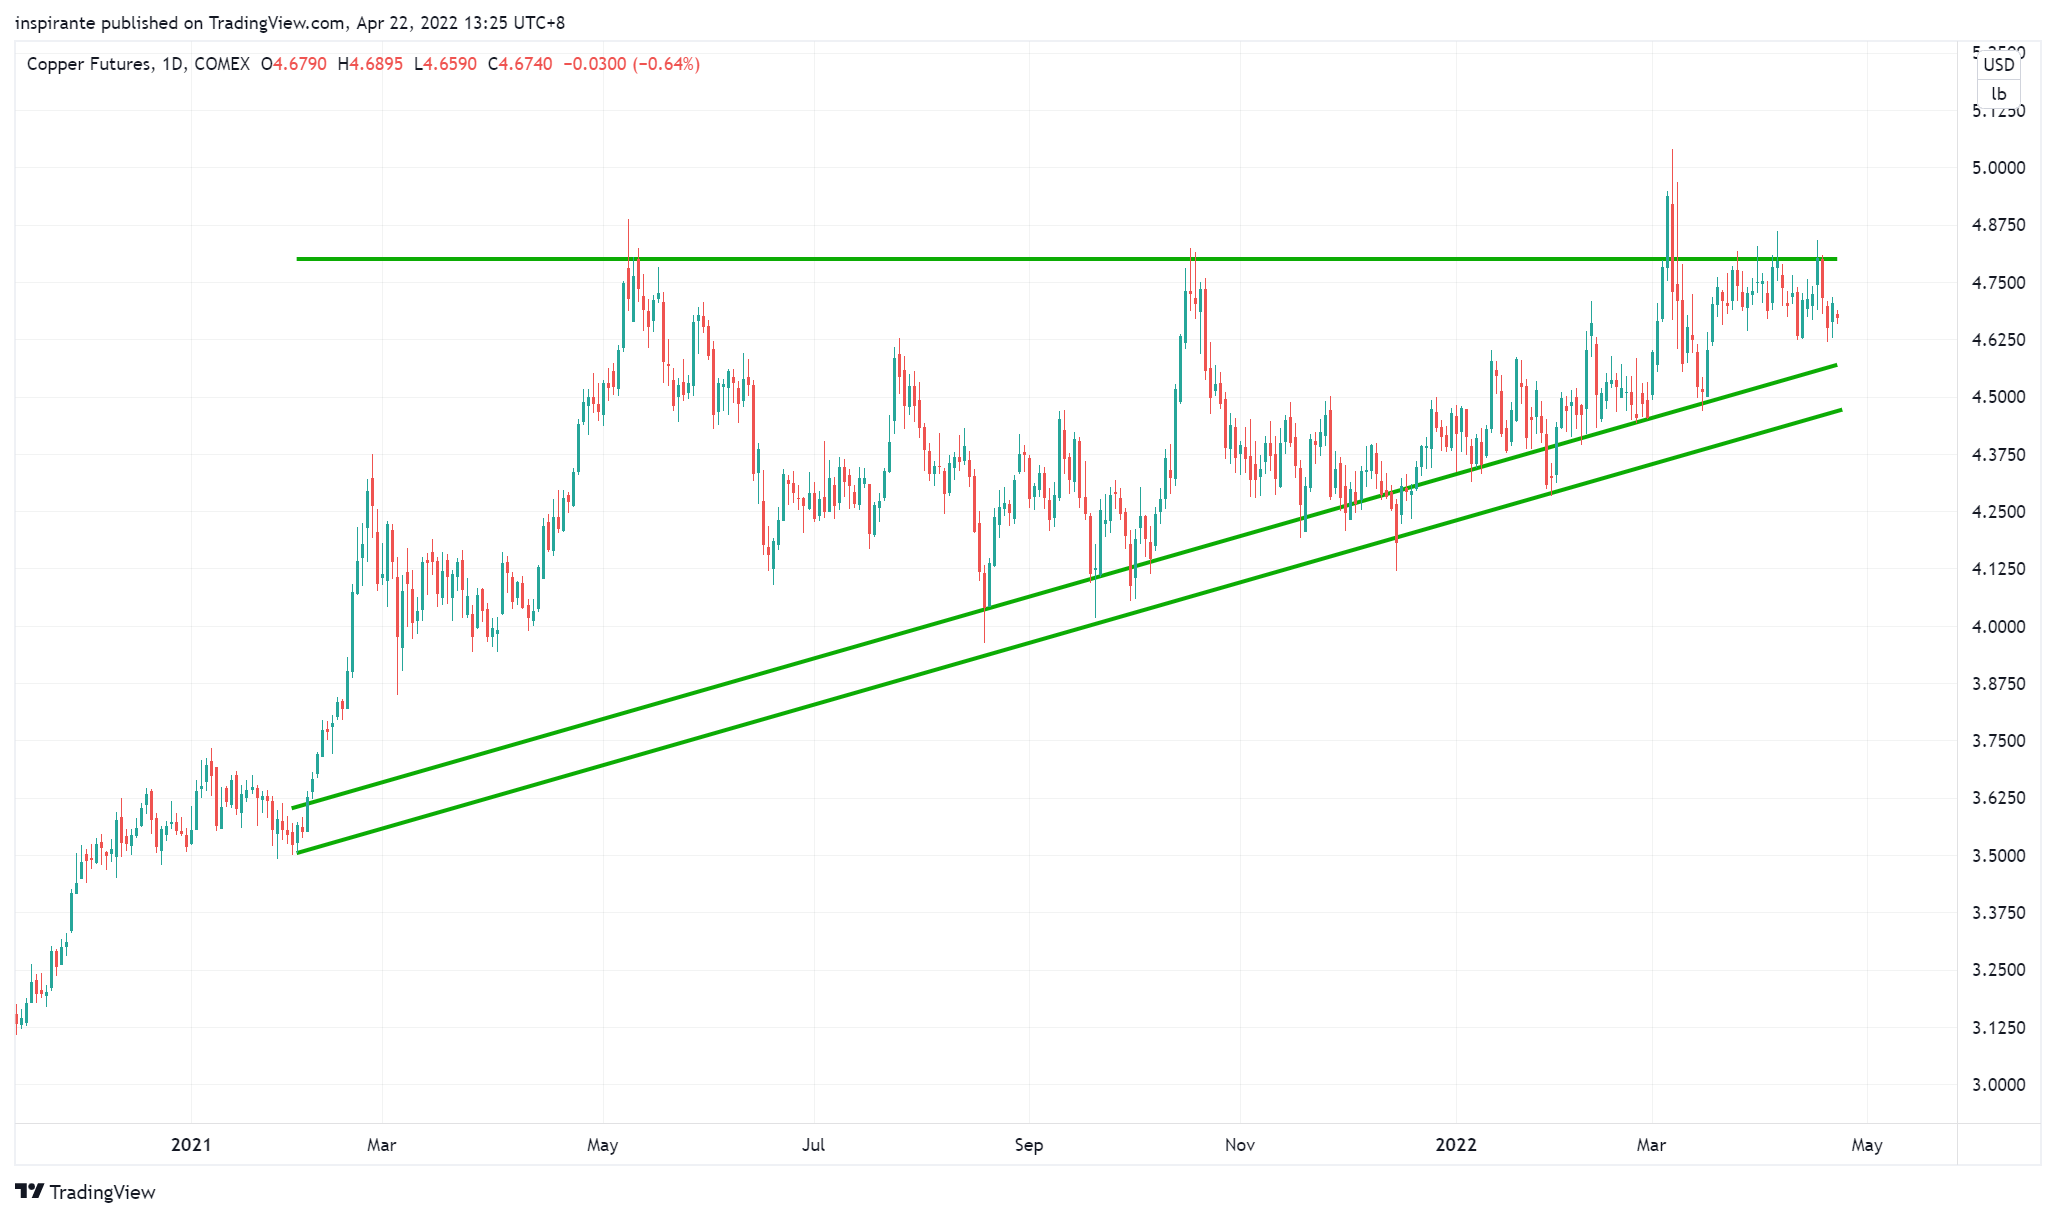
Copper has been consolidating in a gigantic twelve-month ascending triangle. The March headline-triggered spike turned out to be a false breakout. Nevertheless, the compressing trading range near the triangle top suggests that once it is genuinely broken, the next leg up would be massive, too.
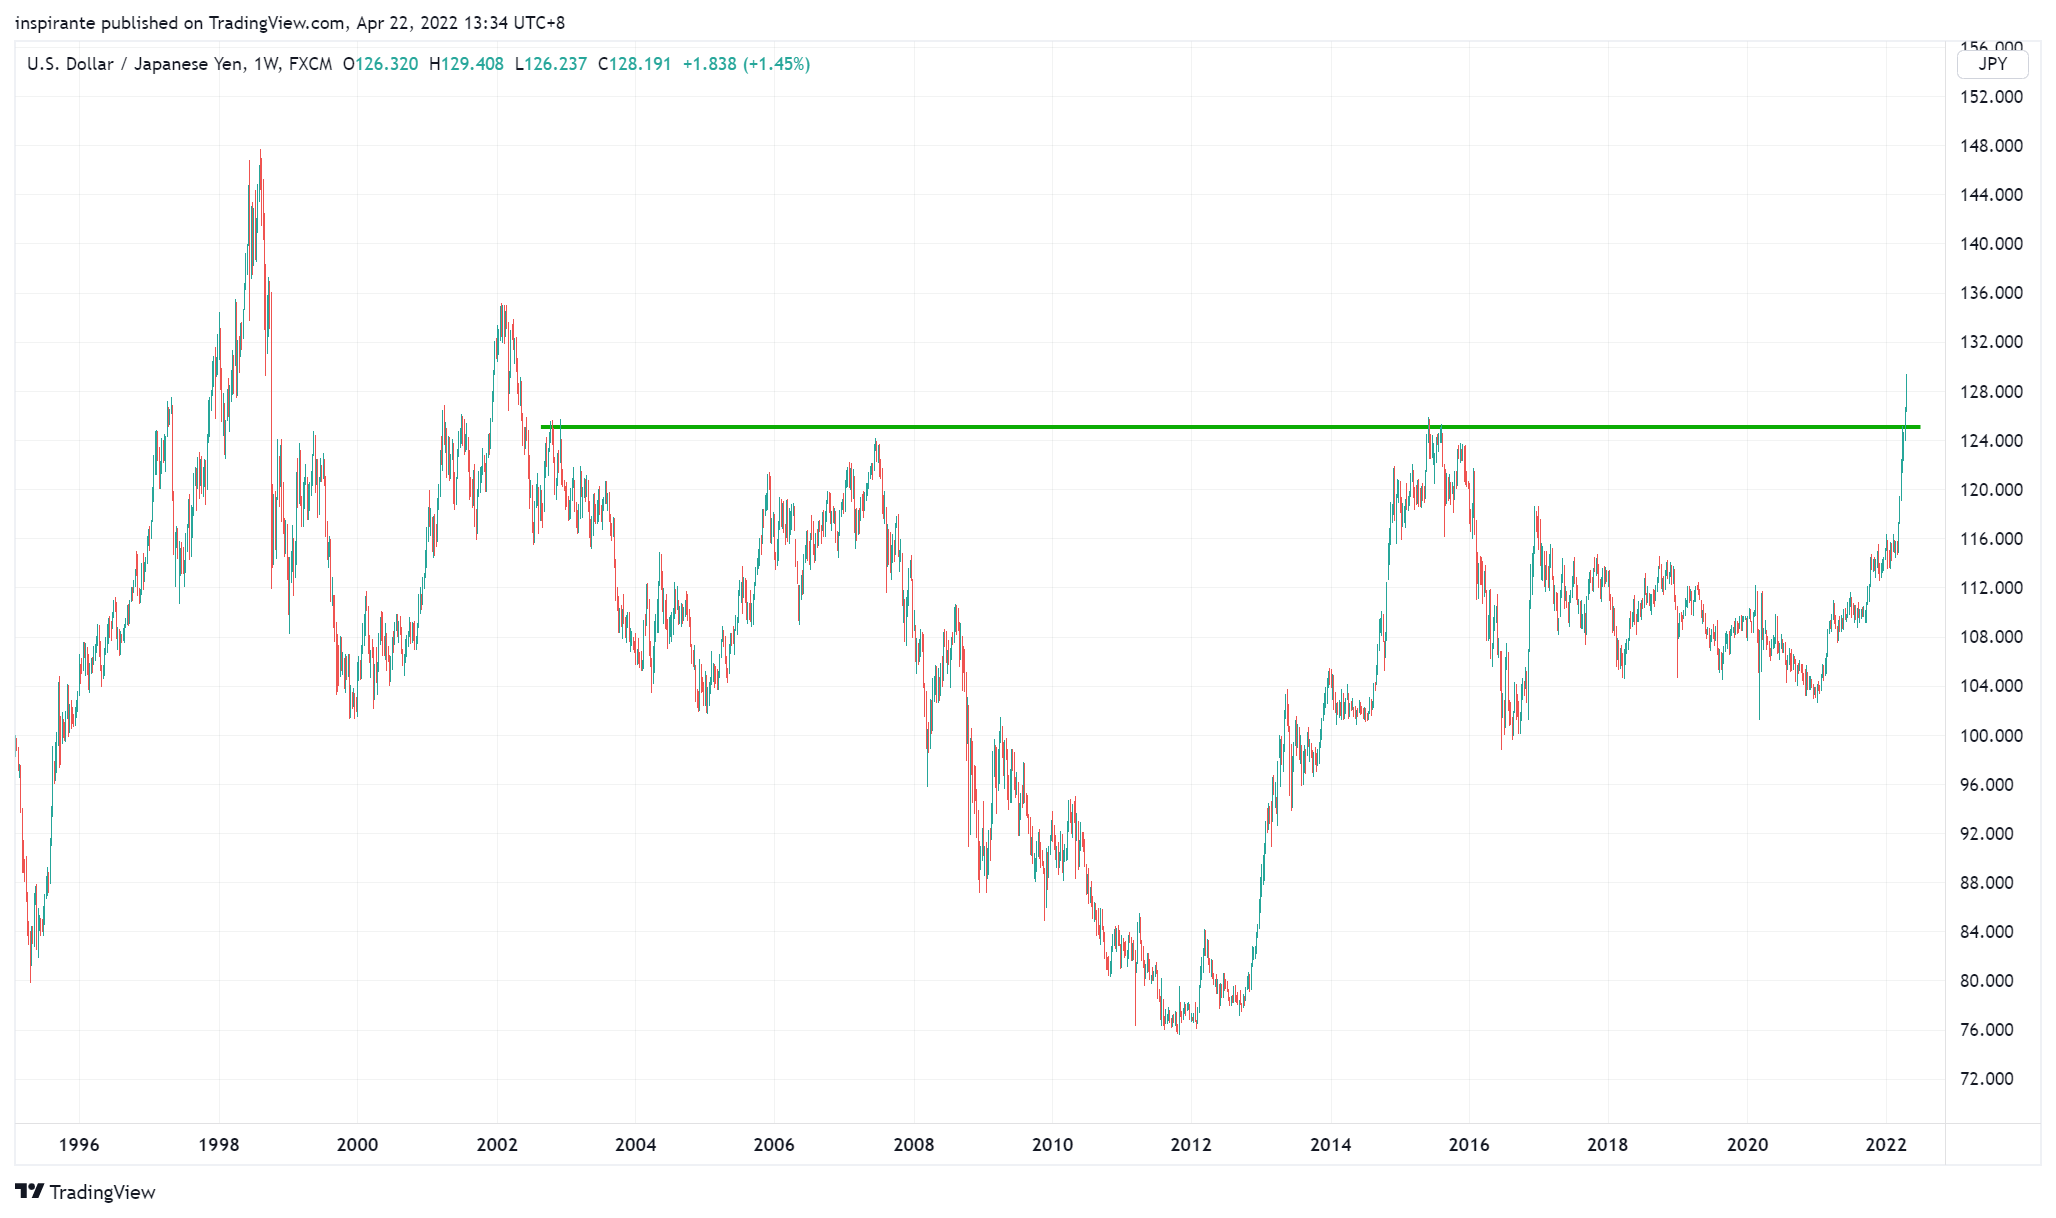
The USD/JPY has penetrated several key technical levels in a short span of a few weeks, all thanks to the BoJ vowing to keep the Yield Curve Control program and other easing measures. The policy divergence resulted in the Japanese Yen quickly weakening to levels last seen in 2002. It has also completed a twenty-year inverted Head-and-Shoulder bottom. If the breakout is confirmed, the upside for this pair points to 150 and above.
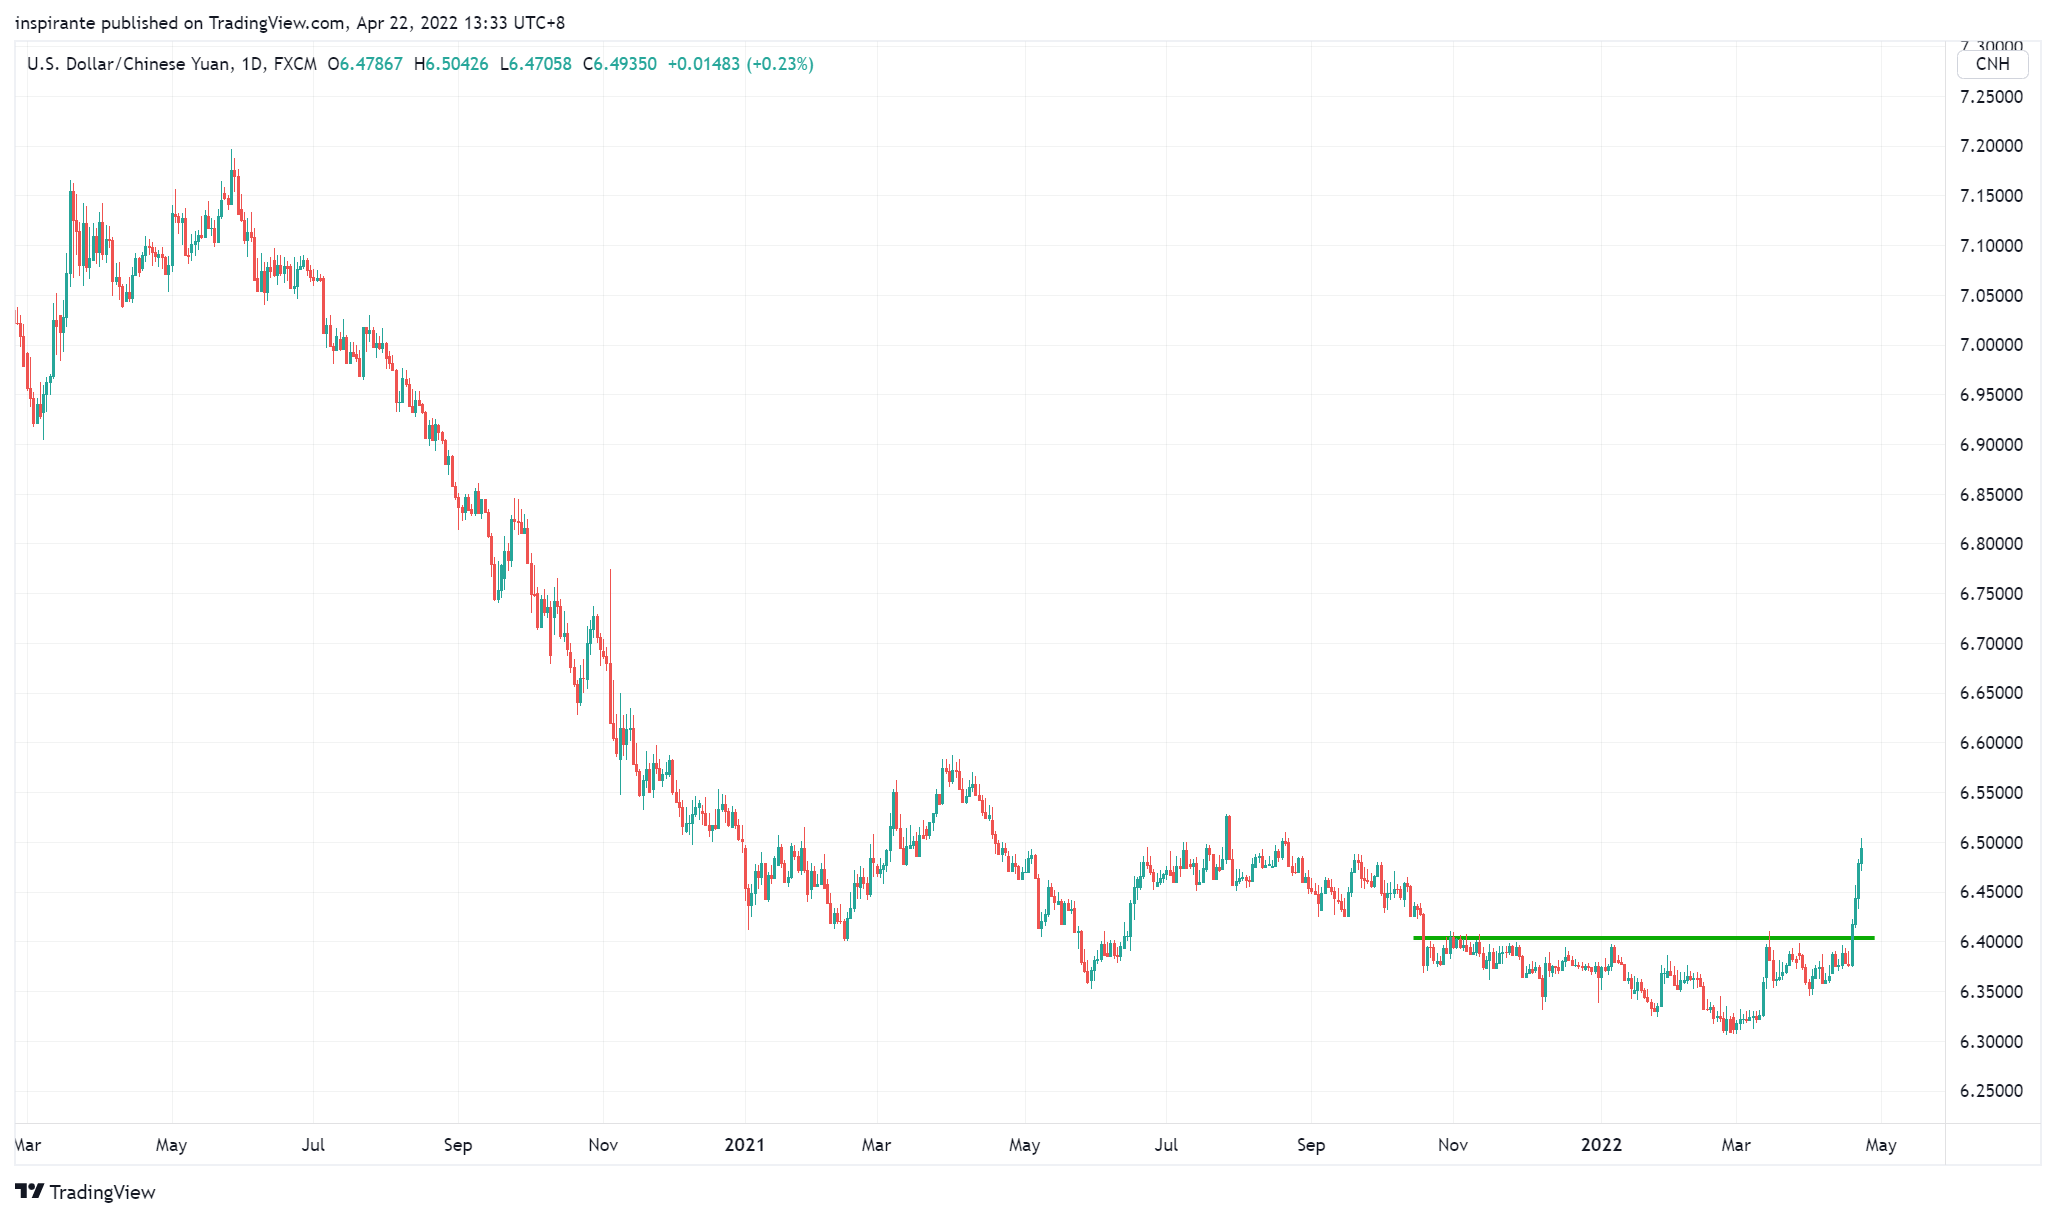
The PBoC is another central bank that maintains an easy monetary policy and would potentially ease even further. The increasing policy divergence between the PBoC and the Fed has finally pressured the currency pair to move higher. If the USDJPY is any guide, we could expect the CNH to weaken substantially further against the US Dollar.
Market Views
In August 2021, we observed that major global central banks’ monetary policies had been increasingly synchronized. This is evident both during the initial pandemic outbreak and currently, as more and more central banks withdrew easing measures. Some even started tightening.
Two notable exceptions are the Bank of Japan (BOJ) and the People’s Bank of China (PBOC). Governor Kuroda insists that the BoJ must keep applying monetary stimulus as inflation in Japan is much more subdued than that in the US. The BoJ adamantly defended the bond yield target by offering to buy an unlimited amount of JGB to cap the yield. This determined defense of the bond yield has become the principal driver of downward pressure on the Japanese Yen (JPY), turning the currency into the pressure release valve. JPY depreciated by more than 12% in a few weeks, a startling move for a currency traditionally perceived as “safe-haven” in the financial world.
Similarly, the PBoC is undoubtedly not in the tightening mode yet, as Governor Yi Gang says the current monetary policies are in the “comfortable range” to boost the economy. Meanwhile, the PBoC has set the Yuan reference rate to the weakest since November 2021. Given the new COVID outbreaks and lockdowns in many Chinese cities, we could be seeing more accommodative measures coming. If the monetary policies between China and the US diverge further as the Fed becomes increasingly hawkish, the Yuan depreciation we have seen so far could be just a prelude.
The primary reason for tightening policies in the US, Europe, and many other countries is to curb sticky and rampant inflation amid higher energy costs. Most countries face dire energy shortages due to a confluence of reasons such as higher post-pandemic demand, aggressive ESG push, geopolitical conflicts, and sanctions. As summer comes to the Northern Hemisphere, the fundamental demand and supply imbalance may once again become the dominant force driving energy prices to multi-decade highs.
How to play the theme out
A hypothetical investor can consider the following trades1:
Case Study 1: Long USD/CNH Future
If the investor were to long the USD/CNH Future (CNHM2) at 6.55 and set the stop below 6.4, his maximum loss per contract would be (6.55 – 6.4) x 100000 = 15000 CNH. An initial target points to 6.7 and subsequently 6.9, resulting in (6.7 – 6.55) x 100000 = 15000 CNH and (7 – 6.55) x 10000 = 45000 CNH.
Case Study 2: Long RBOB Gasoline Future
If the investor were to long RBOB Gasoline future (RBM2) at 3.28 and set the stop below 3.12, his maximum loss per contract would be (3.28 – 3.12) x 42000 = 6720 USD. An initial target points to 3.6 and subsequently 4.4, resulting in (3.6 – 3.28) x 42000 = 13440 USD and (4.4 – 3.28) x 42000 = 47040 USD.
Original Link: https://www.cmegroup.com/newsletters/fresh-from-the-trading-room/files/fresh-from-the-trading-room-2022-04-27.pdf
Examples cited above are for illustration only and shall not be construed as investment recommendations or advice. They serve as an integral part of a case study to demonstrate fundamental concepts in risk management under given market scenarios.
 | A guest post by
|