

Why “BTD” isn’t the only approach?
First published on 2022-02-15


Markets in Focus

The S&P 500 Index had a meaningful rebound from 4200 to 4600 since the end of January after the initial sharp selloff. However, all is not clear yet. As the Fed is getting more hawkish by the day and geopolitical risks continue rising between Russia and Ukraine, the equity market could be forming the right shoulder of a giant Head-and-Shoulder top. 4200 is the neckline that the bulls need to defend ferociously.

The Russell 2000 Index further confirms that the end-January up-move was a countertrend relief rally to be sold. It got rejected at the critical 2100 level, a support-turned-resistance.
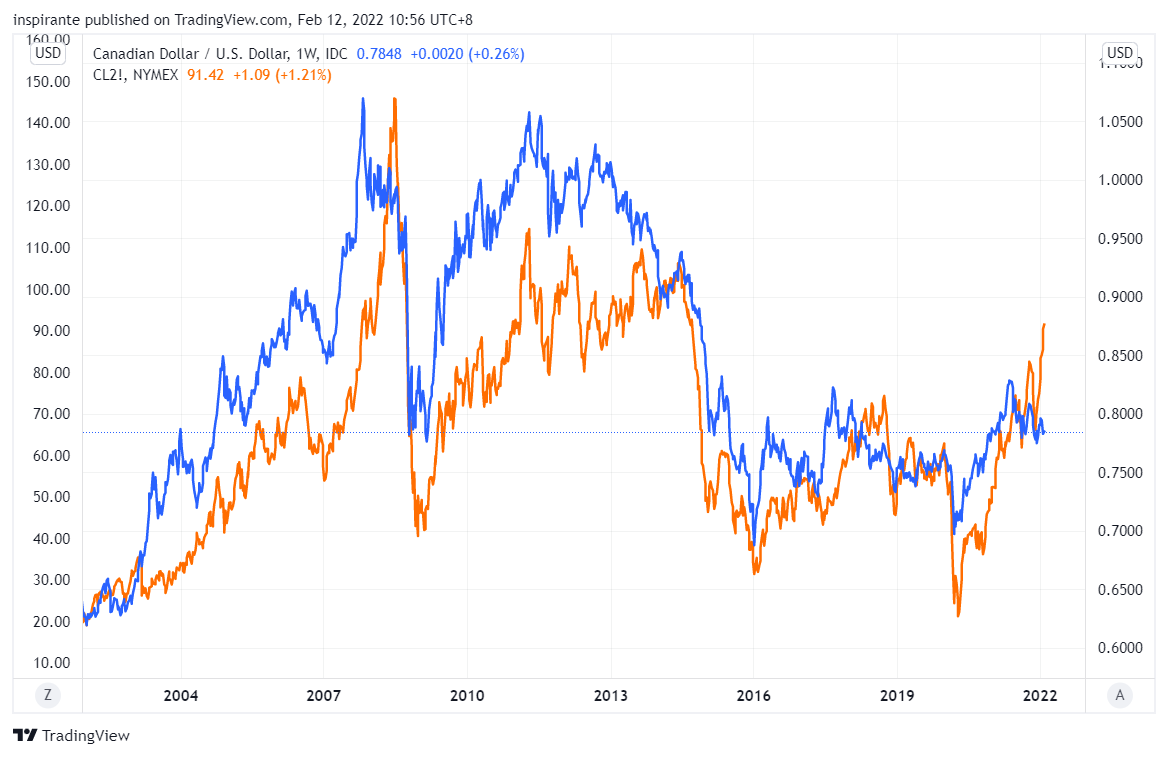
For nearly two decades, crude oil and the Canadian Dollar have been closely correlated because Canada is one of the world’s top crude oil producers and exporters. The nation earns most of its US Dollar from the sale of crude oil. Since January, however, the two have notably diverged as crude oil rallied to multi-year highs, but the Canadian Dollar continued to weaken against the US Dollar.

Fed’s recent hawkish pivot has significantly raised the bond yield across the entire curve, more so on the front-end. The US 5-year treasury yield has reached two standard deviations (s.d.) above the regression line. Since the mid-80s, the 5-year yield has been oscillating between +/-2 s.d. of its downward regression line in every major economic cycle.

In recent weeks, the Short-term Interest Rate (STIR) market has rapidly repriced the path of the Fed’s rate hikes. The Eurodollar Dec 2023 future is trading between 97.75 now, suggesting more than 200bps of rate hikes in the next two years.
Market Views
In our mid-December 2021 issue, we laid out why we believe 1.75% will not be the terminal rate of this cycle, given our view on inflation for the better part of 2021. “All we know is, if that turns out not to be the case, the repricing of the Eurodollar market is going to happen rather briskly.” How true is that! Eurodollar Dec 2023 future was trading near 98.4 back then. It is now below 97.75.
The STIR market has priced in some very aggressive rate hikes, as the Fed officials finally acknowledged the severity of the running inflation and are trying to slam hard on the brakes to tighten financial conditions. However, the equity market has not taken it too kindly. Its stellar rally since March 2020 has been the result of many factors, primarily global central banks going all out providing liquidity and stimulus to the financial system. This explains why “Buy the Dip (BTD)” has been a winning strategy that worked wonders even though the market wobbled a few times along the way, so long as the tap is kept open.
We want to caution the readers not to have the “BTD” mentality too ingrained in their minds, as if it is the only approach. The macro regime has changed. “BTD” works when central banks are stimulating post-recession; however, it will likely stop working when they are tightening in an overheating economy. When liquidity is getting drained out of the system by balance sheet reduction and rate hikes, we are afraid that “Sell the Rally” might be the new sheriff in town. Failure to recognize the regime change and adjust accordingly can lead to pain.
Seeing how quickly everyone jumped on the same side of the rate hike trade before Fed even made the first move, we want to take a contrarian short-term tactical trade on the short side of bond yields in case the equity market deteriorates further. We are not predicting an imminent market crash. On the contrary, we think a prolonged side-way market with a bearish bias and heightened volatility is the more likely outcome. The most crucial thing in such a market is to stay nimble and light. Looking ahead, we see opportunities abound.
How to play the theme out
A hypothetical investor can consider the following trades1:
Case Study 1: Short Micro E-mini Russell 2000 Index Future
If the investor were to short the Micro E-mini Russell 2000 Index future (M2KH2) at around 2025 and set the stop above 2110, his maximum loss per contract would be (2110 – 2025) x 5 = 425 USD. A measured target points to 1800, resulting in (2025 – 1800) x 5 = 1125 USD.
Case Study 2: Short Micro 5-year Yield Future
If the investor were to short the Micro 5-year Yield future (5YYG2) at around 1.9 and set the stop above 2.4, his maximum loss per contract would be (2.4 – 1.9) x 1000 = 500 USD. An initial target points to 1.0 and subsequently 0.2, resulting in (1.9 – 1.0) x 1000 = 900 USD and (1.9 – 0.2) x 1000 = 1700 USD.
Original Link: https://www.cmegroup.com/newsletters/fresh-from-the-trading-room/files/fresh-from-the-trading-room-2022-02-15.pdf
Examples cited above are for illustration only and shall not be construed as investment recommendations or advice. They serve as an integral part of a case study to demonstrate fundamental concepts in risk management under given market scenarios.
 | A guest post by
|