
A delicate balance
A delicate balance
Written on 2024-05-03, first published on 2024-05-07


Markets in focus
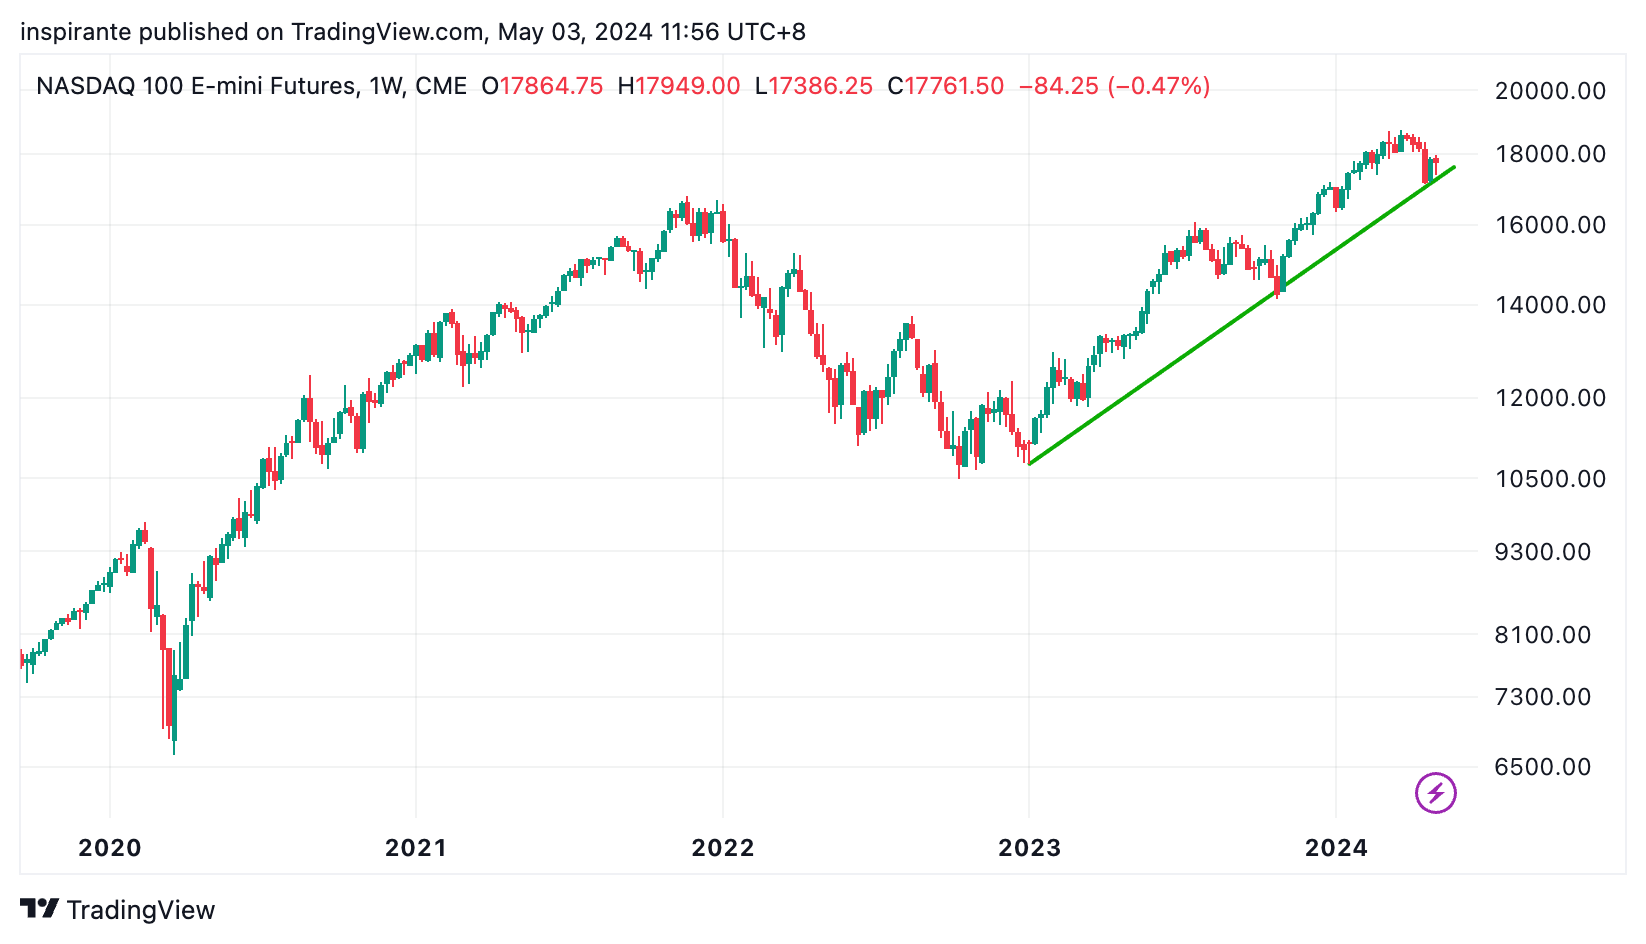
The Nasdaq 100 index recently reached a new all-time high. However, the current pullback threatens the ascending trend support since early 2023.
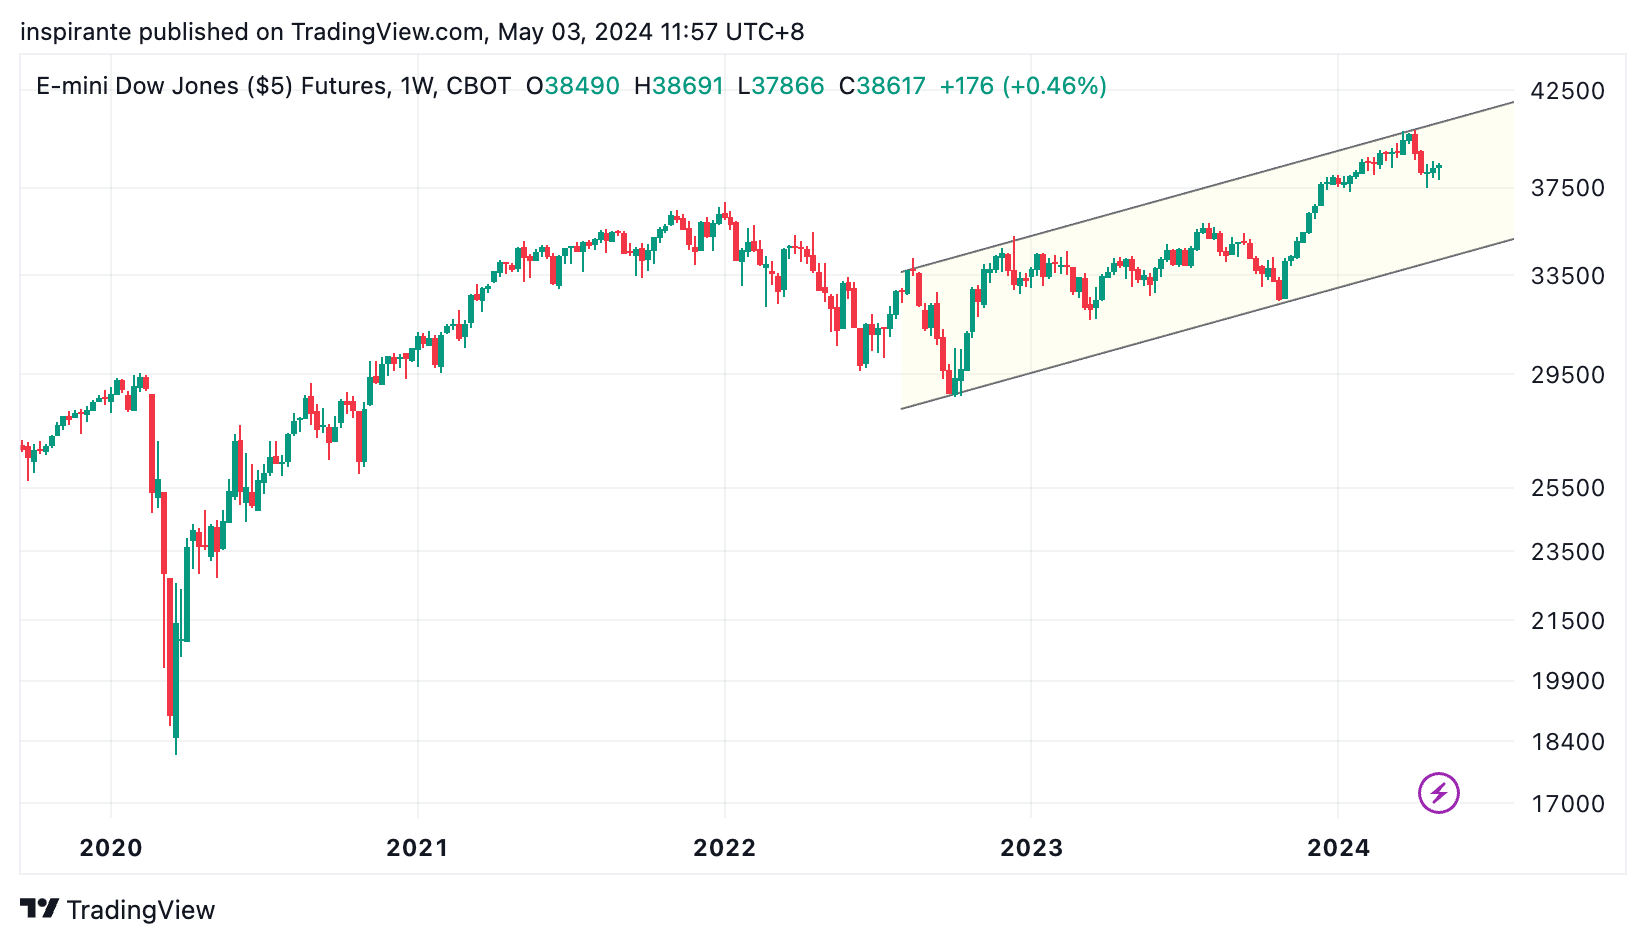
Similarly, the Dow Jones Industrial Average also recorded its all-time high and is currently trading within a two-year ascending channel.
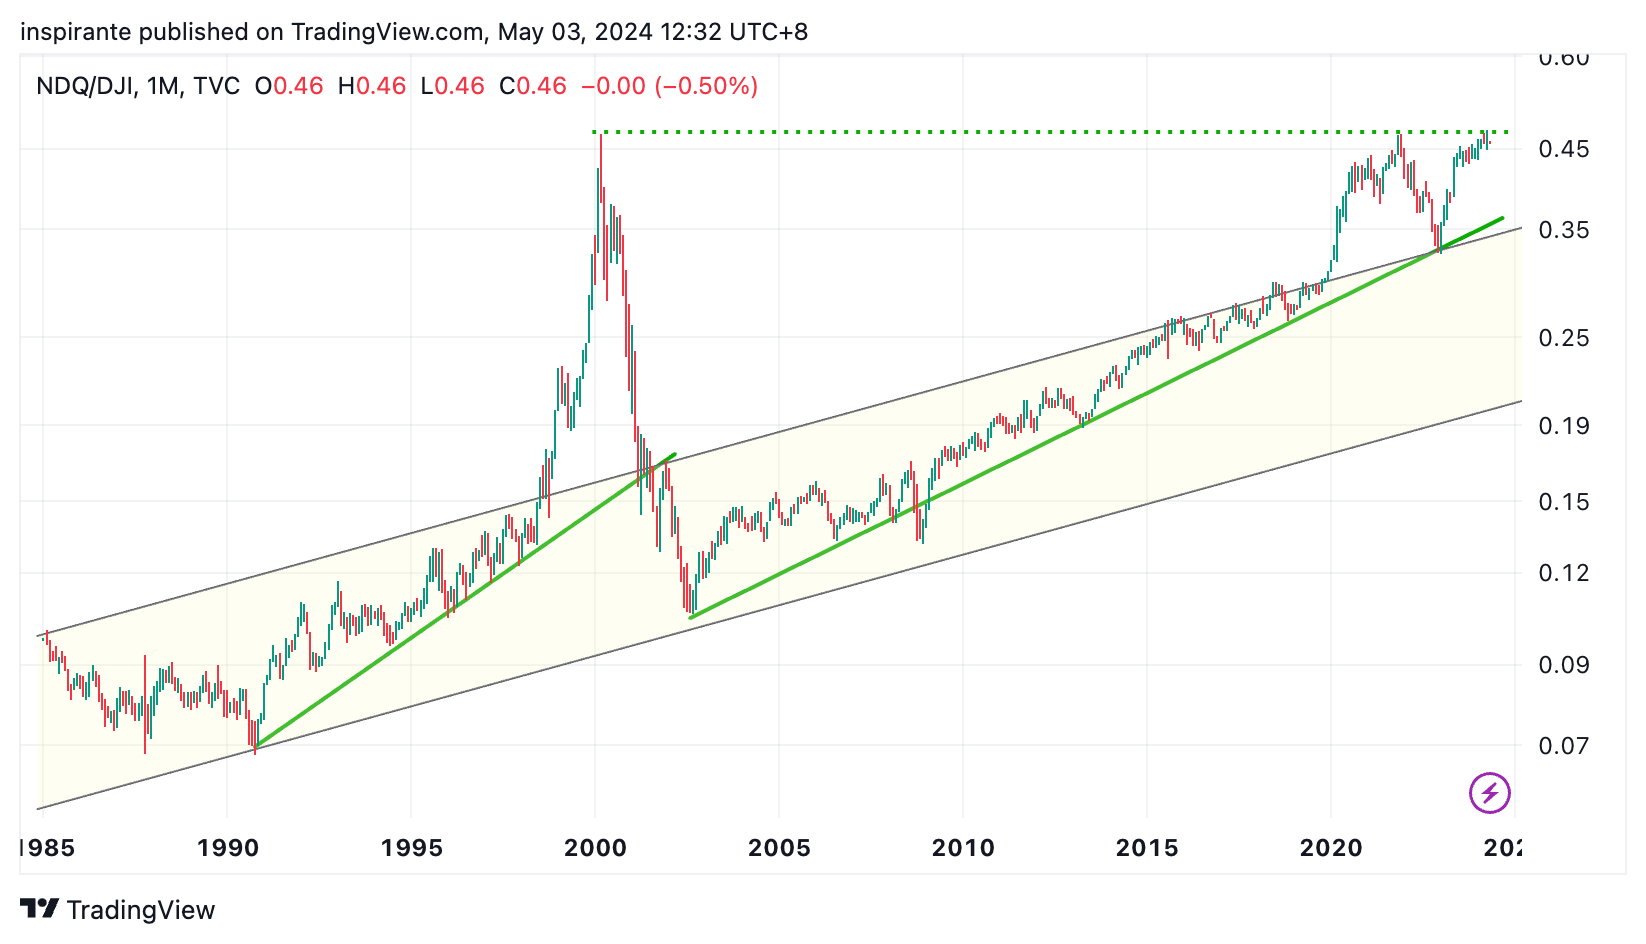
The ratio between the Nasdaq and Dow Jones indices is approaching a historical peak. Notably, previous instances when the ratio reached similar levels—such as during the DotCom bubble and December 2021—were followed by sharp reversals back to the long-term uptrend line.
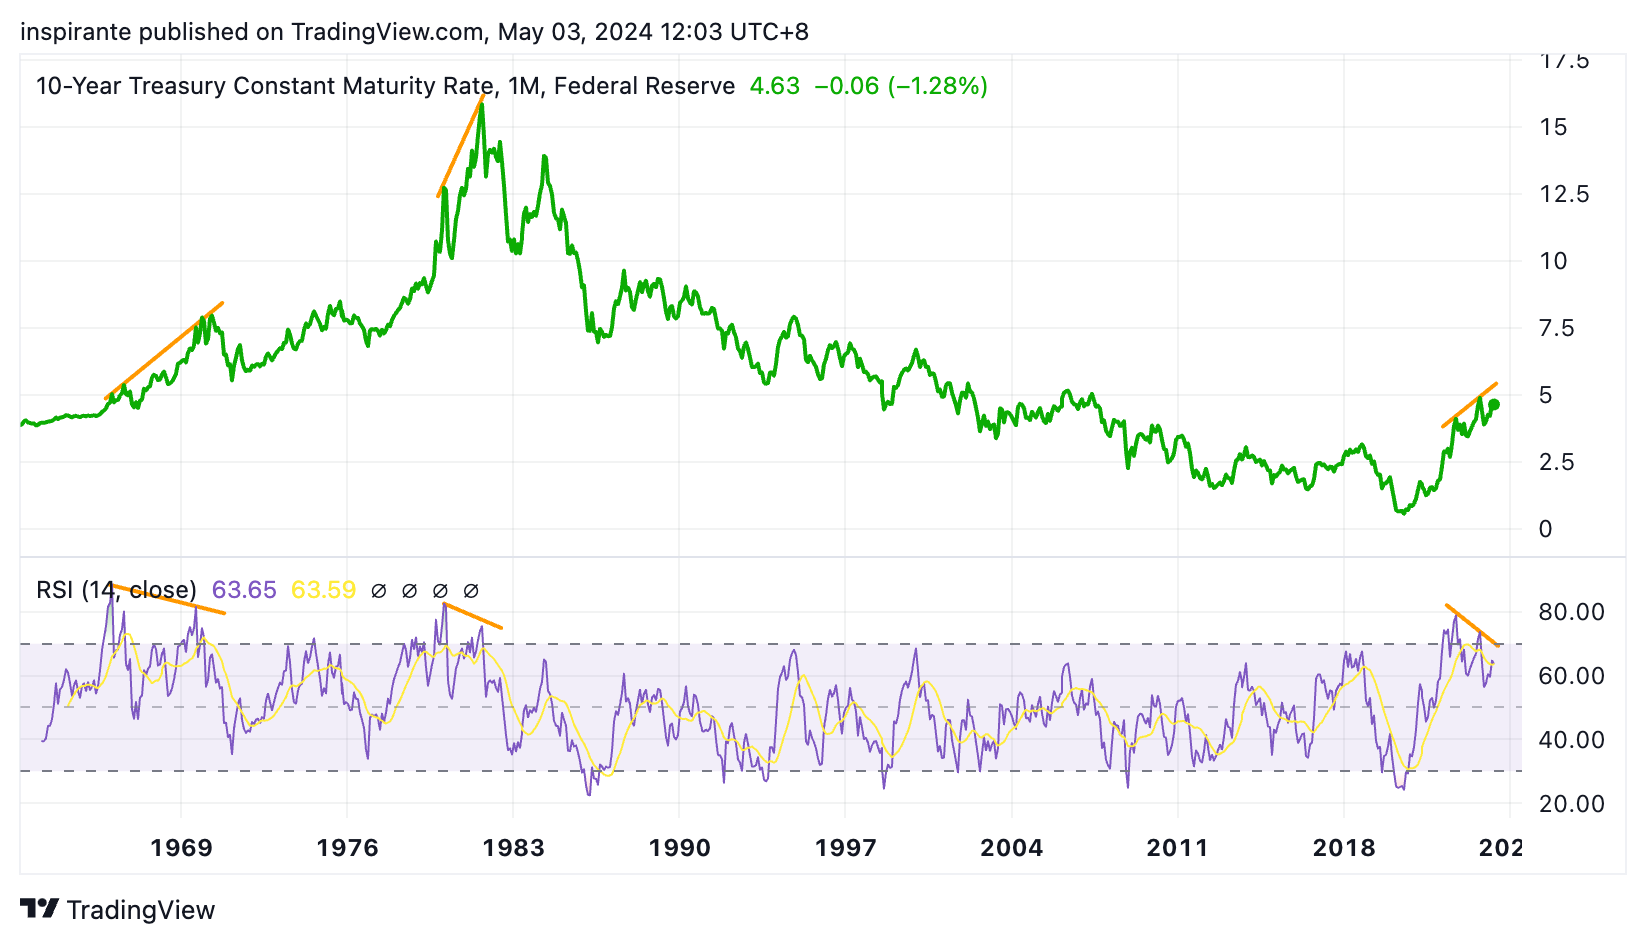
The U.S. 10-year treasury yield is experiencing a resurgence. On a longer time frame, it exhibits a rare monthly Relative Strength Index (RSI) divergence; despite higher highs in yields, the RSI prints lower highs, indicating diminishing momentum. Historically, similar patterns preceded significant declines in yields.
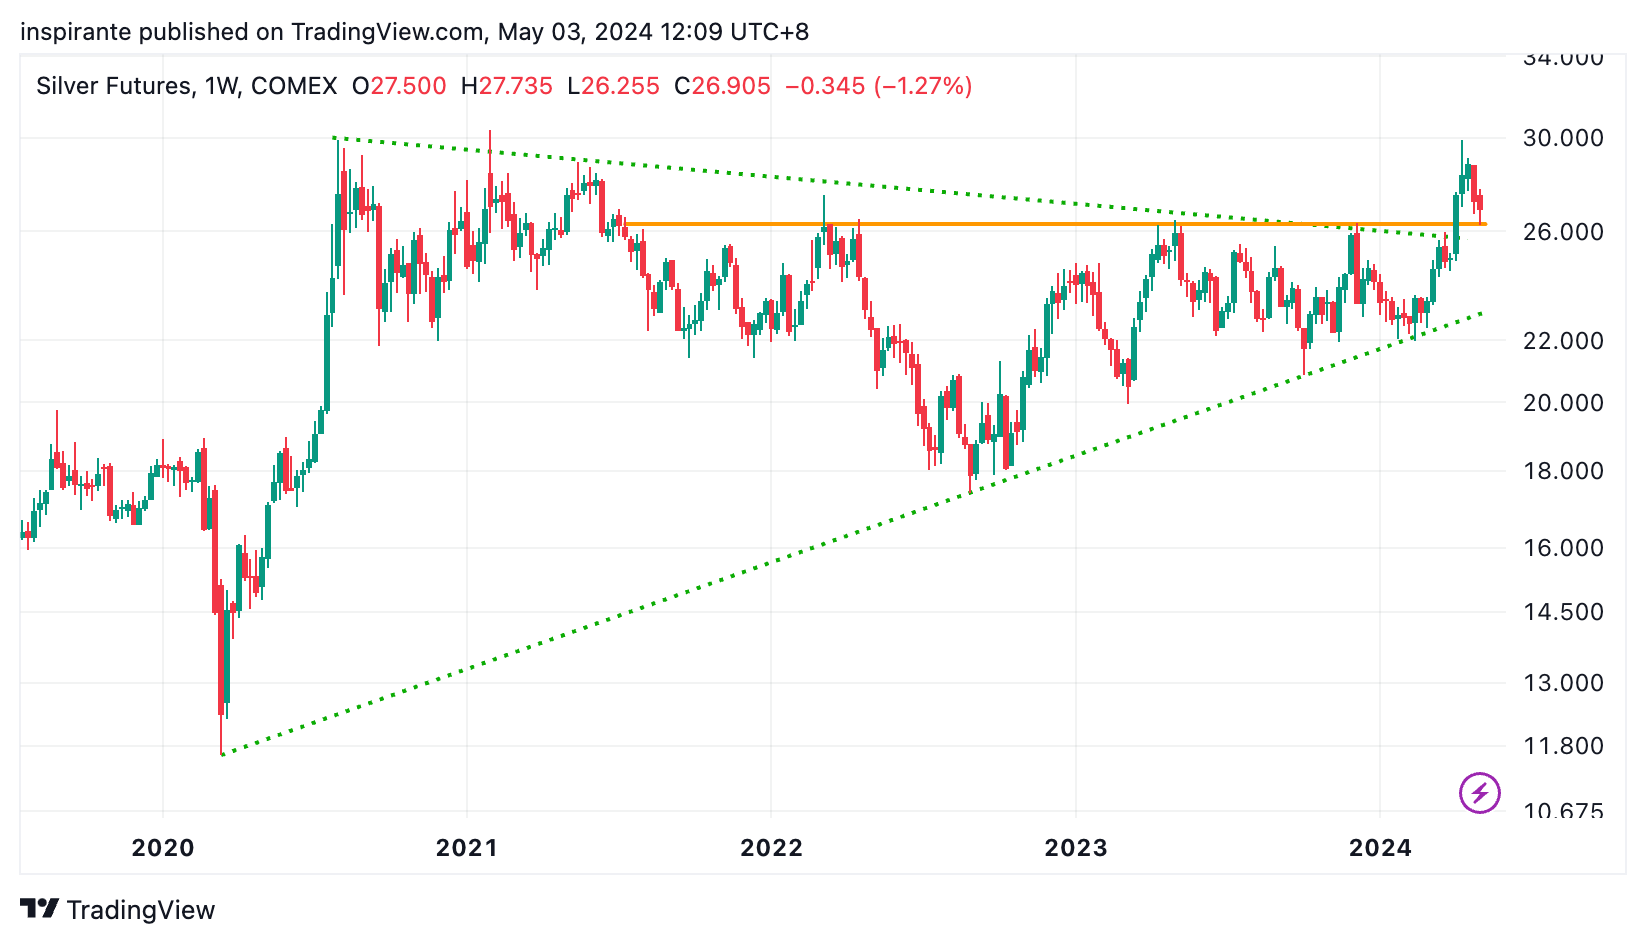
Silver has decidedly broken out from a multi-year triangle and a significant resistance at 26. Following a brief pullback, it is now retesting this former resistance, now acting as support. Should this support level hold, an upward continuation is anticipated.
Our market views
From 1994 to 1998, under then Federal Reserve Chairman Alan Greenspan, the central bank adopted what is known as an "opportunistic approach to disinflation." This strategy involved not actively fighting inflation with tight monetary policies unless deemed necessary, even though inflation is moderate but still above the long-run objective. Instead, the central bank waited for external circumstances – such as economic recessions or favorable supply shocks to naturally lower inflation. Then, it maintained the lower inflation level without aggressively targeting further reductions unless inflation rose significantly. In July 1995, for instance, the Fed reduced the interest rate by 75 basis points and maintained this rate for over 30 months, effectively fine-tuning rather than overhauling monetary policy.
Fast forward to the present, there are indications that the Federal Reserve, currently under Chairman Jerome Powell, may be adopting a similar strategy in response to today's increasingly complex macroeconomic landscape. On the one hand, signs such as a disappointing Non-farm Payroll report for April, with fewer jobs added than expected and a rising unemployment rate, suggest the U.S. could be nearing a recession. Concurrently, earnings reports from major companies like Starbucks, McDonald's, and Yum! Brands show declining sales and a pullback in consumer spending. On the other hand, despite these economic slowdown signals, the equity market, as evidenced by the S&P 500, remains close to its all-time high, buoyed partly by expectations of rate cuts, even as the inflation rate rose to 3.5% in March—significantly above the Fed's target.
This situation presents a critical dilemma for the Fed: easing monetary policy too soon risks a repeat of the 1980s, when a secondary inflationary wave surged higher; easing too late, however, could stifle discretionary spending further, potentially dragging the economy into a deep recession, even as it curtails inflation. Adding to the complexity is the impending U.S. presidential election. Although Chairman Powell has asserted that the election will not influence the Fed's policy decisions, the central bank is undoubtedly keen to avoid both a resurgence of inflation and a deep recession during an election year.
The Federal Reserve's communication has been explicit in conveying these concerns. Fed Governor Chris Waller, commenting on the current atypical easing cycle, remarked, "I see no reason to move as quickly or cut as rapidly as in the past." From this perspective, we believe that the U.S. equity market—particularly the technology sector and growth-oriented stocks, which typically benefit from low interest rates and economic expansion—is still overly optimistic, pricing in an aggressive easing scenario over the next 6-12 months. As the Fed navigates these turbulent waters with caution, striving to maintain a delicate balance in its policy approach, these high-multiple, growth stocks are likely to underperform compared to value stocks, which are generally more defensive and resilient in such an environment.
How do we express our views?
We consider expressing our views via the following hypothetical trades1:
Case study 1: Short Nasdaq / Dow ratio
We would consider taking a short position in the Nasdaq / Dow ratio, by simultaneously selling one Micro E-mini Nasdaq 100 future (MNQM4) at 17,770 and buying two Micro E-mini Dow Jones future (MYMM4) at 38,620, with an effective price ratio of 17,770 / 38,620 = 0.46. We would put a stop-loss above 0.475, which could bring us a hypothetical maximum loss of 0.015 points. Looking at Figure 3, the ratio has the potential to fall to its long-term trendline support at 0.36, a hypothetical gain of 0.10 points. Each point move in the Micro E-mini Nasdaq futures contract is 2 USD, and each point move in the Micro E-mini Dow futures contract is 0.5 USD. Both legs have similar notional values (Nasdaq: 17,770 x 2 = 35,540 USD and Dow: 38,620 x 0.5 x 2 = 38,620 USD). We can look at two hypothetical scenarios to understand the approximate dollar value of a 0.001 point move in the ratio.
Scenario 1: Assuming the Nasdaq stays unchanged, and the Dow rallies to 38,714, the ratio becomes 17,770 / 38,714 = 0.459. The overall profit, which only comes from the Dow position in this case, is (38,714 – 38,620) x 0.5 x 2 = 94 USD.
Scenario 2: Assuming the Dow stays unchanged, and the Nasdaq rallies to 17,804, the ratio becomes 17,804 / 38,620 = 0.461. The overall loss, which comes from the Nasdaq position in this case, is (17,770 - 17,804) x 2 = -68 USD.
In Scenario 1, the ratio drops by 0.001 points, yielding a profit of 94 USD from the long Dow Jones position. In Scenario 2, the ratio rises by 0.001 points, yielding a loss of 68 USD from the short Nasdaq position. There is margin offset for Nasdaq / Dow ratio spreads.
Case study 2: Short U.S. 10-Year Yield Future
We would consider taking a short position in the U.S. 10-Year Yield future (10YK4) at the current level of 4.5, with a stop-loss above 4.8, which could bring us a hypothetical maximum loss of 4.8 – 4.5 = 0.3 points. Looking at Figure 4, the U.S. 10-year yield has the potential to fall to 3.8, the previous low registered in December 2023, a hypothetical gain of 4.8 – 3.8 = 1.0 point. Each point move in the 10-Year Yield futures contract is 1,000 USD.
EXAMPLES CITED ABOVE ARE FOR ILLUSTRATION ONLY AND SHALL NOT BE CONSTRUED AS INVESTMENT RECOMMENDATIONS OR ADVICE. THEY SERVE AS AN INTEGRAL PART OF A CASE STUDY TO DEMONSTRATE FUNDAMENTAL CONCEPTS IN RISK MANAGEMENT UNDER GIVEN MARKET SCENARIOS. PLEASE REFER TO FULL DISCLAIMERS AT THE END OF THE COMMENTARY.
 | A guest post by
|