Markets in focus
The recent ascent of gold to an all-time high becomes particularly significant when analyzed in non-USD currencies. For instance, in Japanese yen terms, gold's performance has substantially outpaced its gains when measured in U.S. Dollars.
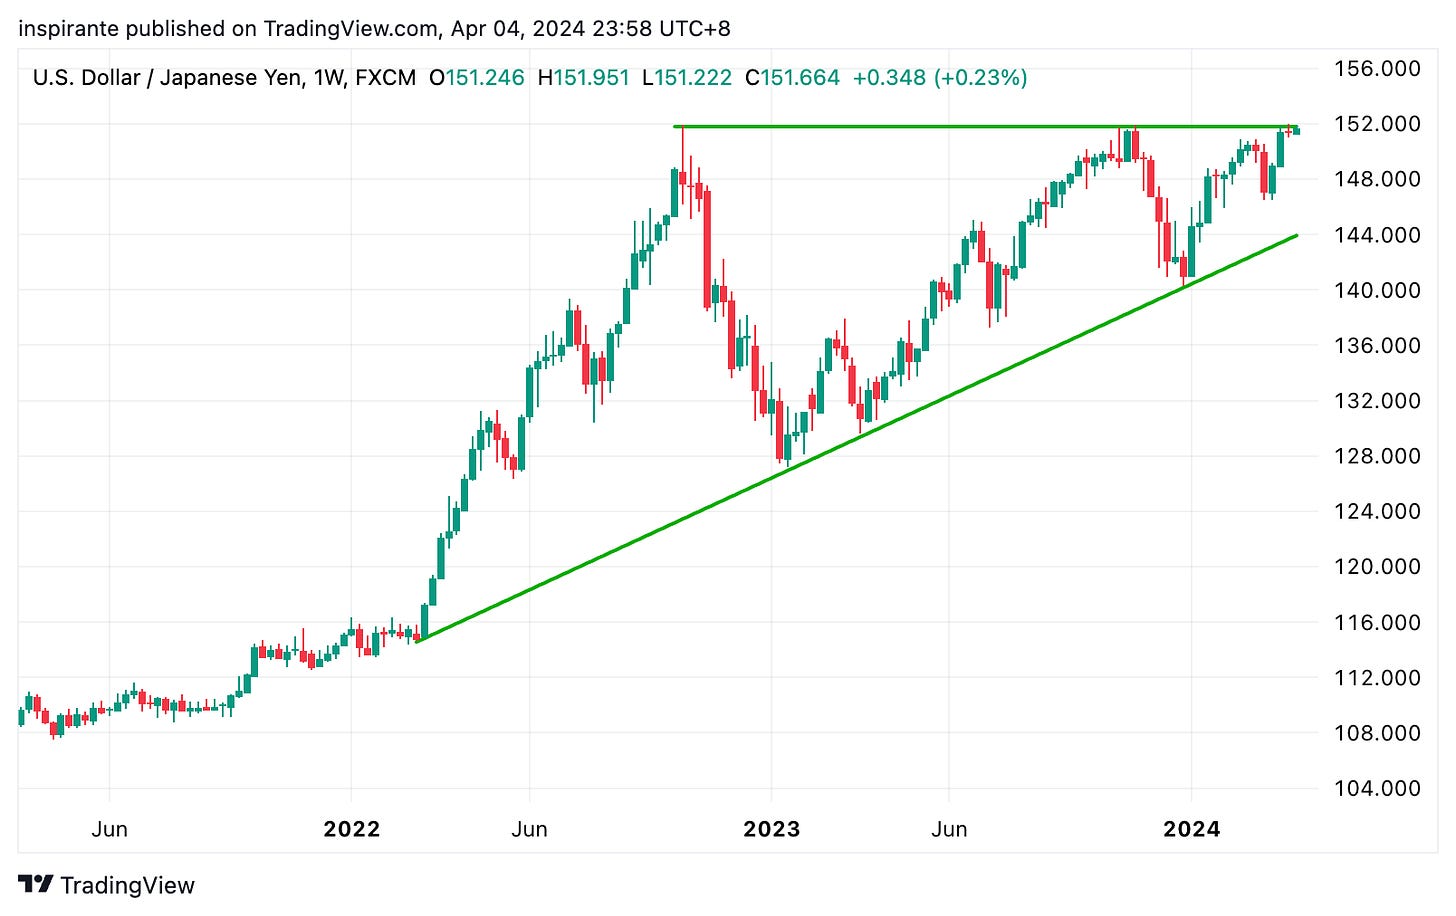
The USD/JPY pair is testing the key resistance level near 152 for the third time since 2022. Amid the Bank of Japan's (BoJ) ongoing efforts to normalize monetary policy and signals from the Ministry of Finance (MoF) regarding potential intervention to address yen weakness, the bias for USD/JPY appears tilted towards potential downside, indicating a stronger yen against the U.S. Dollar.
The ratio of the Nasdaq to the Nikkei 225 is hovering at a critical support line that has been in place over the last decade. A breach of this support could signify a shift of capital flows from the U.S. to Japan, indicating investor sentiment favoring Japanese equities over their U.S. counterparts in the foreseeable future.
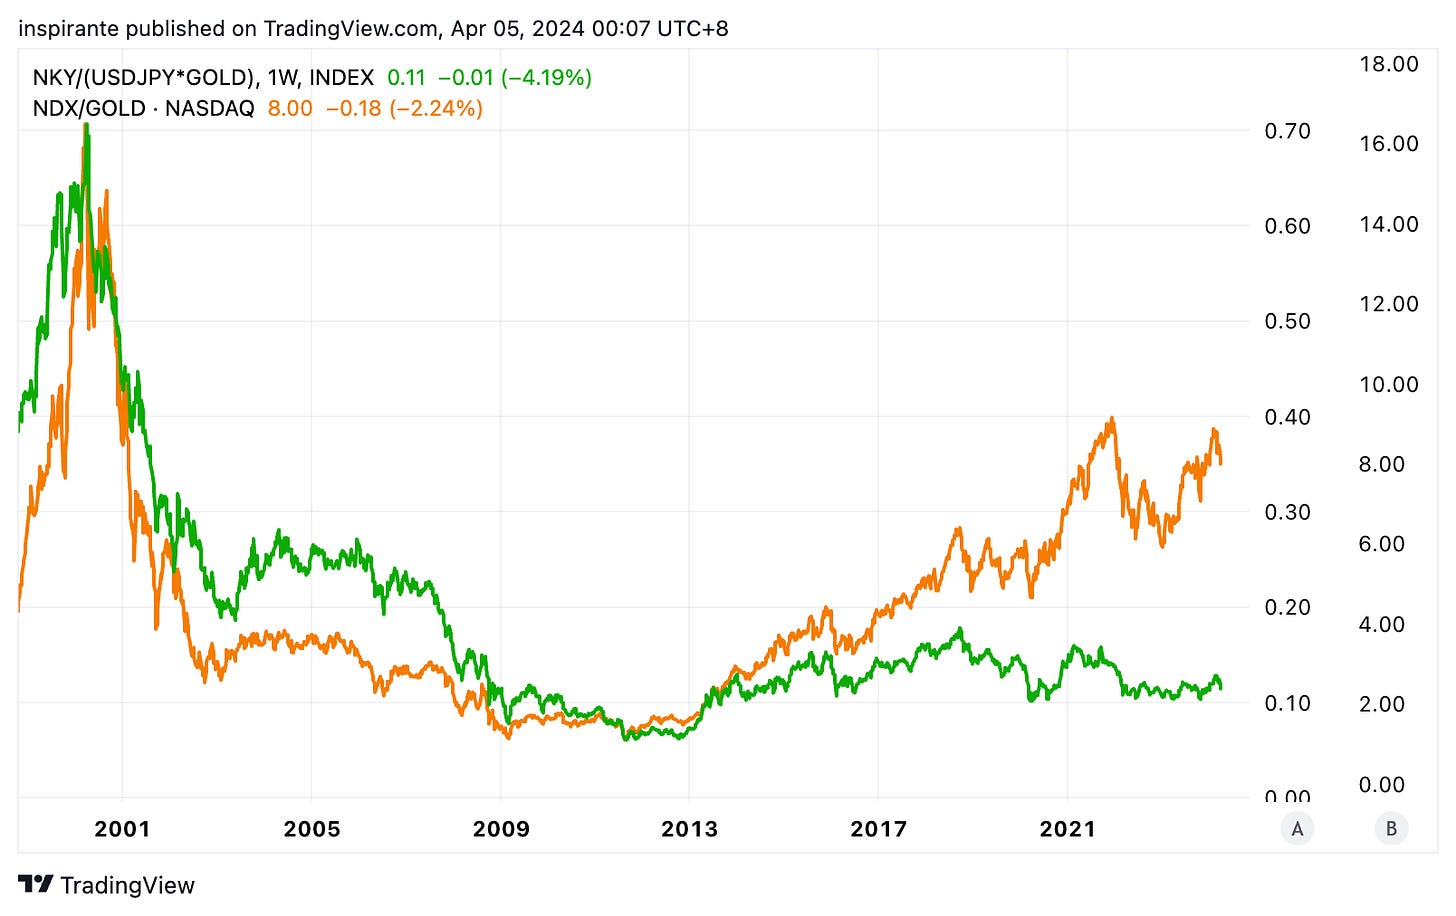
Analyzing the Nasdaq and Nikkei indices through the lens of gold, which is considered a more stable measure and store of value, reveals that since the low in 2013, the relative valuation of the Nasdaq has increased markedly compared to the Nikkei. Specifically, where less than 2 ounces of gold were once sufficient to buy one unit of the Nasdaq index, it now requires over 8 ounces. Conversely, the Nikkei's valuation relative to gold has remained relatively stable over the past decade, suggesting a disparity in the relative valuation change between the two indices when gold is used as a benchmark.
Our market views
Our regular readers are no strangers to our view on Japan, which goes back to even before the Nikkei's parabolic rise thrust Japan back into the limelight for investors worldwide. Well, the shoe has finally dropped: the Bank of Japan (BoJ) has hiked rates for the first time since 2007, moving away from its Negative Interest Rate Policy (NIRP) and scrapping Yield Curve Control (YCC) all in one go. Despite these monumental shifts, it seems the market still hasn't fully woken up to the potential implications, both in Japan and globally. That said, the BoJ deserves a nod for how skillfully they've laid the groundwork, doing their utmost to cushion the blow and keep market volatility in check.
Why do we think this is a bigger deal than many are giving it credit for? Simple: Japan has been the world's largest exporter of capital for decades, thanks to not just Mrs. Watanabe but also giant institutions like the Government Pension Investment Fund (GPIF), and not to forget the foreign investors and speculators who've made a sport of borrowing in cheap yen. This so-called carry trade has thrived on Japan's long-standing low interest rate environment, letting investors borrow yen at low rates, convert them into other currencies, and then invest those funds in higher-yielding assets abroad, like U.S. treasury bonds or equities. The goal is to profit from the yield differentials such that the earning from the foreign asset investments exceeds the borrowing cost of yen, even after accounting for any exchange rate fluctuations.
The carry trade's Achilles' heel is twofold. First, if Japan's interest rates rise, suddenly borrowing the yen isn't so cheap anymore. Second, if the yen strengthens against other currencies, those who haven't hedged their bets could see losses from unfavorable exchange rate moves. The first scenario is already unfolding as the BoJ has made it clear that higher rates are on the horizon. The second scenario hasn't hit just yet, but with the U.S. and Eurozone eyeing rate cuts, the gap in interest rates is likely to shrink, possibly strengthening the yen in the process.
Don't overlook the potential for a "stampede effect" here. With decades of carry trade buildup, even a minor uptick in interest rates could start to trigger a massive unwind, forcing investors to sell off foreign assets and buy back yen, further propelling the currency's strength and amplifying losses for those late to the exit party. "If you ain't first, you're last," as the saying goes.
What does all this mean? We're looking at the possibility of trillions of dollars in play, with two main outcomes. First, the yen's trajectory seems heavily tilted towards strengthening — the potential for further weakening (remember, it's at 152 now, rumored to be near the Ministry of Finance's line in the sand) just doesn't stack up against the strengthening scenario. Second, when this flood of capital flows back into Japan, it's going to be looking for a home, likely in yen-denominated assets. Given the Japanese equity market's lag behind its peers over the last decade, especially from a currency-neutral standpoint, as we see in Figure 4, there's a good case to be made for both domestic and international investors to overweight Japan. This could kickstart a virtuous cycle, drawing even more foreign investment (thus higher demand for the yen) to Japanese shores.
In our eyes, the gears are already turning. Maybe the market is just too accustomed to the old status quo in Japan to notice the winds of change. But that's precisely why this moment is so exciting.
How do we express our views?
We consider expressing our views via the following hypothetical trades1:
Case study 1: Long JPY/USD future
We would consider taking a long position in the JPY/USD future (6JM4) at the current level of 0.00667 (equivalent to 150 in USD/JPY terms), with a stop-loss below 0.00645 (equivalent to 155 in USD/JPY terms), which could bring us a hypothetical maximum loss of 0.00667 – 0.00645 = 0.00022 points. Looking at Figure 2, if USD/JPY starts to weaken, it has the potential to fall to 130 (equivalent to 0.00769 in JPY/USD terms), a hypothetical gain of 0.00769 – 0.00667 = 0.00102 points. Each JPY/USD futures contract represents 12,500,000 Japanese yen, and each point move is 12,500,000 USD. E-mini and Micro JPY/USD futures are also available at ½ and 1/10th of the standard contract size.
Case study 2: Short Nasdaq / Nikkei ratio
We would consider taking a short position in the Nasdaq / Nikkei ratio, by simultaneously selling one E-mini Nasdaq 100 future (NQM4) at 18,280 and buying two Nikkei 225 USD future (NKDM4) at 39,250, with an effective price ratio of 18,280 / 39,250 = 0.466. We would put a stop-loss above 0.54, which could bring us a hypothetical maximum loss of 0.074 points. Looking at Figure 4, if the support is broken, the ratio has the potential to fall to 0.3, a hypothetical gain of 0.166 points. Each point move in the Nasdaq futures contract is 20 USD, and each point move in the Nikkei 225 futures contract is 5 USD. Both legs have similar notional values (Nasdaq: 18,280 x 20 = 365,600 USD and Nikkei 225: 39,250 x 5 x 2 = 392,500 USD). We can look at two hypothetical scenarios to understand the approximate dollar value of a 0.001 point move in the ratio.
Scenario 1: Assuming the Nasdaq stays unchanged, and the Nikkei 225 rallies to 39,310, the ratio becomes 18,280 / 39,310 = 0.465. The overall profit, which only comes from the Nikkei 225 position in this case, is (39,310 – 39,250 ) x 5 x 2 = 600 USD.
Scenario 2: Assuming the Nikkei 225 stays unchanged, and the Nasdaq rallies to 18,330, the ratio becomes 18,330 / 39,250 = 0.467. The overall loss, which comes from the Nasdaq position in this case, is (18,330 – 18,250) x 20 = 1,600 USD.
In Scenario 1, the ratio drops by 0.001 points, yielding a profit of 600 USD from the long Nikkei position. In Scenario 2, the ratio rises by 0.001 points, yielding a loss of 1,600 USD from the short Nasdaq position. There is margin offset for Nasdaq / Nikkei ratio spreads.
EXAMPLES CITED ABOVE ARE FOR ILLUSTRATION ONLY AND SHALL NOT BE CONSTRUED AS INVESTMENT RECOMMENDATIONS OR ADVICE. THEY SERVE AS AN INTEGRAL PART OF A CASE STUDY TO DEMONSTRATE FUNDAMENTAL CONCEPTS IN RISK MANAGEMENT UNDER GIVEN MARKET SCENARIOS. PLEASE REFER TO FULL DISCLAIMERS AT THE END OF THE COMMENTARY.


